

Article Figures & Data
Figures
- Figure 1.
Delineation of GC with neural tracing and immunocytochemistry. Image 45 from the ABA P56 Coronal Reference Atlas at 0.95 mm anterior to bregma is shown in A, with GC colored in red. An anterograde tracer (MicroRuby) was injected unilaterally into the gustatory thalamus (VPMpc) of several B6 mice; terminal labeling was subsequently examined in GC. B, Whole-brain section showing terminal labeling concentrated in the ipsilateral cerebral hemisphere in a lateral position (arrowhead) and at an anteroposterior level approximately equivalent to the ABA schematic. C, Tracer injection site in VPMpc. D, Magnified view of terminal labeling (red) interposed with cellular stain (DAPI; cyan) shows diffuse thalamic input with concentrations in cortical layers 1, 3, and 4. E, Sequential sections from the same mouse show terminal labeling from caudal to rostral levels, from −0.5 to 1.5 mm anterior to bregma; labeling was most robust from ∼0.0 to ∼1.2 mm. F, Muscarinic M2-type receptor (green) is concentrated in layers 3 and 5 of 6-layer neocortex; the expression in layer 2 dissipates ventrally as the granular insular cortex (GI) gives way to the dysgranular insular cortex (DI), which is cytoarchitecturally characterized by the gradual disappearance of layer 4 (the granular layer). Thalamic expression in this section (red) is largely located in the DI. G, Taste-evoked Fos expression (0.003 m QHCl delivered IO to an awake mouse) also overlaps with the thalamic terminal field in GC. Photographs in B, C, and E are all from the same mouse; those in D and F are from another mouse and G is from another. All boundaries superimposed on images are approximate. SS, Somatosensory cortex; AI, agranular insular cortex.
- Figure 2.
Location of recording fields for 2P imaging. A, Diagram depicting region of recordings based on vasculature. B, Example image taken from a recording window with one imaging field superimposed. Right, Two-photon image of example field showing labeled neurons. C, GCaMP-visualized neurons were verified to be within GC by the presence of anterograde mCherry-labeled VPMpc thalamic fibers. D, Example of postimaging location verification. Fluorogold (FG) was injected into the recording field to show that recordings were from GC neurons. cRV, Caudal rhinal vein; GI/DI, granular/dysgranular insular cortex; AI, agranular insular cortex; S1, primary somatosensory cortex; S2, secondary somatosensory cortex; Pir, piriform cortex. Schematic in A is modified from Hagen et al. (2012).
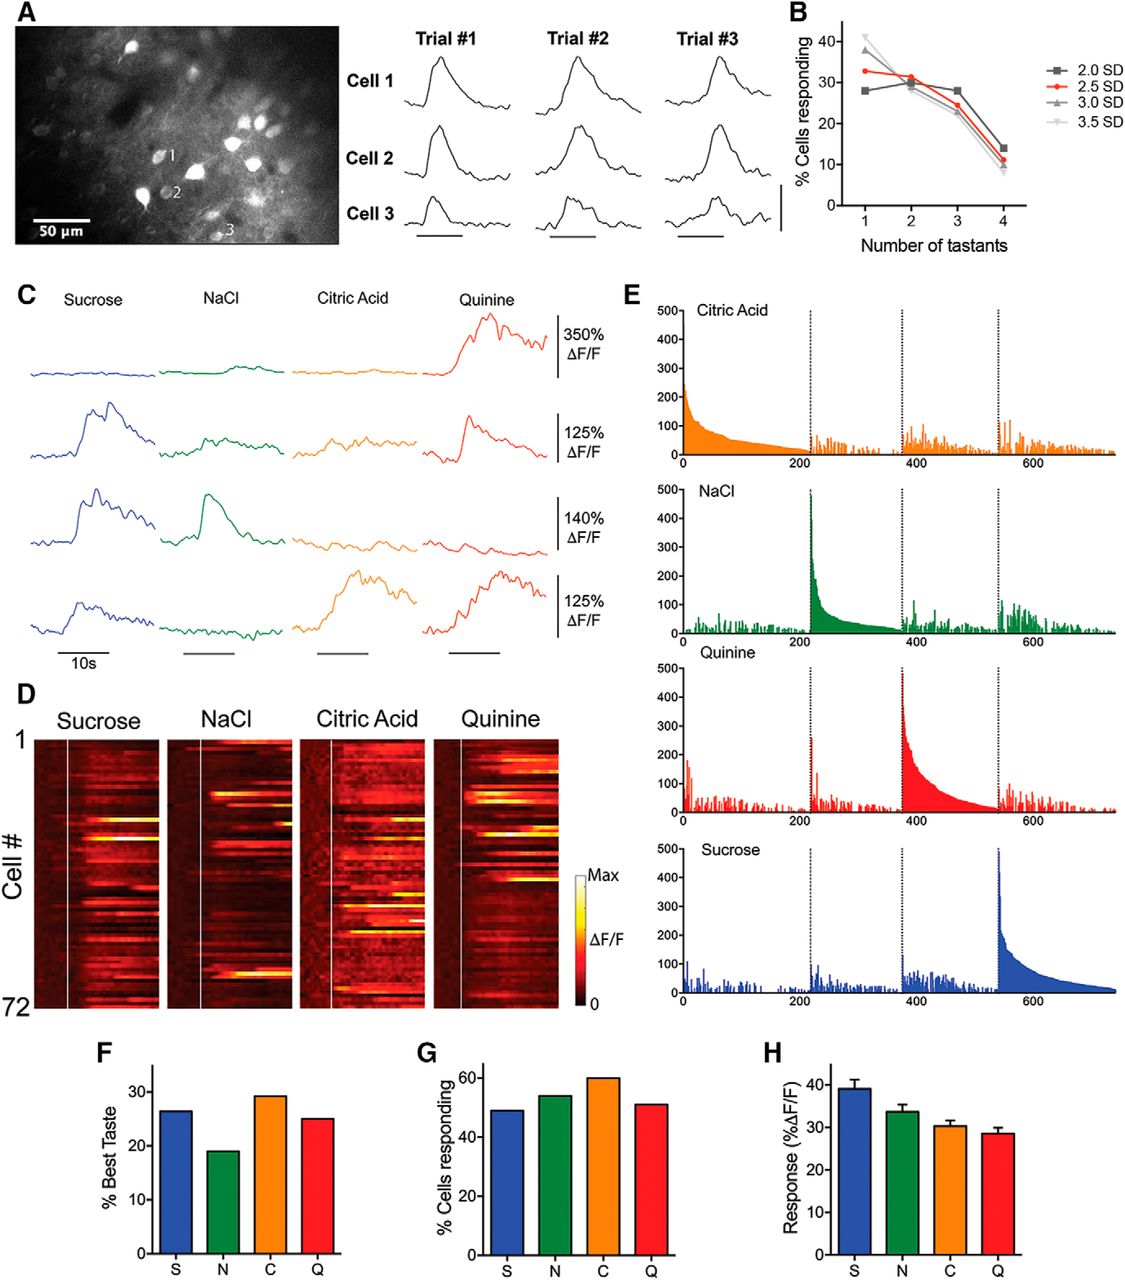
- Figure 3.
A, Taste-evoked imaging responses in layer II/III GC neurons. Fluorescence traces show that multiple taste presentations separated by several minutes evoke similar responses from the three labeled neurons. Horizontal scale bar, 5 s; vertical scale bar, 200% ΔF/F. B, Individual cell response thresholds were set at 2.0, 2.5, 3.0, and 3.5 SDs and the percentage of cells responding to only one, two, three, or four tastants were compared. All other thresholds (grays) produced highly similar percentages of cells as the 2.5 (red) chosen for analysis. C, Example traces from four different GC neurons to taste application (black bar). D, Normalized taste-evoked responses from all cells taken from the field shown in Figure 2B. White line depicts onset of taste delivery. Each row in the “heat map” represents a cell and time is represented along the x-axis. Individual neuron responses vary in their selectivity and temporal response. E, All responsive neurons grouped into best-stimulus categories (colors) and arranged in descending order of response magnitude to that stimulus. F, Percentage of cells by best taste stimulus. G, Similar percentages of cells significantly responding to each taste. H, Mean fluorescence change evoked by each taste across the cell population.
- Figure 4.
Clustering and breadth of responsiveness among all neurons. A, Hierarchical cluster analysis reveals groups of cells with distinct taste response profiles. B, Normalized taste response profiles (mean ± SD) for each cluster in A revealing both singly tuned and more broadly tuned cell types. Entropy (C) and N/S (D) analysis demonstrate narrowly and broadly tuned cell clusters. E, Percentage of strongest (top 10% by maximum response) responding cells according to cluster.
- Figure 5.
Principle components analysis. A, Two-dimensional plots of the first three principal components (accounting for 91% of the total variance) relative to one another reveal that the population data effectively and separately encodes each tastant in coding space. In all graphs, the individual cell positions are plotted and color coded according to cluster to demonstrate how each cluster contributes to the coding of each taste stimulus. B, Mean lick ratios relative to water differ according to each taste quality. Overall, water-restricted mice preferred sucrose and avoided citric acid and quinine while displaying no preference for NaCl compared with water. Asterisks above bars indicate significantly different groups. Error bars indicate SEM.
- Figure 6.
Spatial analyses according to taste response and entropy. Examples of the spatial distribution of neurons within individual fields of GC in different mice based on best taste (A), cluster (B), and tuning breadth for each mouse. Normalized distances between cells categorized by best taste (D), cluster (E), and breadth of tuning (F). *Denotes a significant difference from 1.


