

Abstract
The maturation of cortical parvalbumin-positive (PV) interneurons depends on the interaction of innate and experience-dependent factors. Dark-rearing experiments suggest that visual experience determines when broad orientation selectivity emerges in visual cortical PV interneurons. Here, using neural transplantation and in vivo calcium imaging of mouse visual cortex, we investigated whether innate mechanisms contribute to the maturation of orientation selectivity in PV interneurons. First, we confirmed earlier findings showing that broad orientation selectivity emerges in PV interneurons by 2 weeks after vision onset, ∼35 d after these cells are born. Next, we assessed the functional development of transplanted PV (tPV) interneurons. Surprisingly, 25 d after transplantation (DAT) and >2 weeks after vision onset, we found that tPV interneurons have not developed broad orientation selectivity. By 35 DAT, however, broad orientation selectivity emerges in tPV interneurons. Transplantation does not alter orientation selectivity in host interneurons, suggesting that the maturation of tPV interneurons occurs independently from their endogenous counterparts. Together, these results challenge the notion that the onset of vision solely determines when PV interneurons become broadly tuned. Our results reveal that an innate cortical mechanism contributes to the emergence of broad orientation selectivity in PV interneurons.
SIGNIFICANCE STATEMENT Early visual experience and innate developmental programs interact to shape cortical circuits. Visual-deprivation experiments have suggested that the onset of visual experience determines when interneurons mature in the visual cortex. Here we used neuronal transplantation and cellular imaging of visual responses to investigate the maturation of parvalbumin-positive (PV) interneurons. Our results suggest that the emergence of broad orientation selectivity in PV interneurons is innately timed.
Introduction
The mature response properties of neurons in the primary visual cortex emerge during the first few weeks after the eye opens. Dark-rearing experiments have revealed that a rudimentary level of cortical organization develops in the absence of normal vision (Hubel and Wiesel, 1963; Wiesel and Hubel, 1974; Blakemore and Van Sluyters, 1975; Chapman and Stryker, 1993; Crair et al., 1998; Chapman et al., 1999; White et al., 2001). For example, numerous studies have shown that excitatory (Exc) neurons develop normal orientation selectivity without visual experience (Rochefort et al., 2009; Wang et al., 2010; Kuhlman et al., 2011; Li et al., 2012a,b; Ko et al., 2014; Sarnaik et al., 2014). The onset of visual experience has a pronounced impact on inhibitory interneurons (Desai et al., 2002; Maffei et al., 2004; Gandhi et al., 2005). Dark rearing prevents the emergence of broad orientation selectivity in cortical parvalbumin-positive (PV) interneurons (Kuhlman et al., 2011; Li et al., 2012a,b). It has been proposed that the onset of vision guides the maturation of interneurons by promoting the production of growth factors, such as Otx2 (Sugiyama et al., 2008; Beurdeley et al., 2012) and BDNF (Huang et al., 1999). The release of these growth factors at the onset of vision may instruct the emergence of mature orientation selectivity in PV interneurons. Alternatively, innate cortical mechanisms may determine when PV interneuron orientation selectivity matures while experience-dependent mechanisms merely play a permissive role (Xu et al., 2004; Cang et al., 2005; Chattopadhyaya et al., 2007; Huberman et al., 2008; Kerlin et al., 2010; Maroof et al., 2013).
Cortical GABAergic interneurons can be isolated from the embryonic medial ganglionic eminence (MGE) and transplanted into the postnatal neocortex (Wichterle et al., 1999; Wonders and Anderson, 2006). Remarkably, MGE precursors disperse widely in host neocortex and express markers of mature GABAergic interneurons (Wichterle et al., 1999; Southwell et al., 2010, 2012; Davis et al., 2015). Transplanted interneurons have been shown to undergo apoptosis following an intrinsically timed program (Southwell et al., 2012). Transplantation studies have also revealed that interneurons induce critical-period cortical plasticity through a cell-age-dependent process (Southwell et al., 2010; Tang et al., 2014; Davis et al., 2015). In this study, we make use of interneuron transplantation to investigate whether maturation of orientation selectivity in PV interneurons is innately timed.
If the availability of vision-dependent growth factors determines when PV interneurons mature, then younger PV interneurons introduced through transplantation should mature at the same time as their host counterparts. In contrast, if innate growth programs determine when broad orientation selectivity emerges, then younger PV interneurons introduced into older visual cortex ought to mature later than endogenous PV interneurons in the host animal. Using embryonic interneuron transplantation into postnatal visual cortex, we find that broad orientation selectivity emerges in transplanted PV (tPV) interneurons after it emerges in endogenous PV interneurons. We also find that transplantation does not alter the orientation selectivity of endogenous PV interneurons. These findings support the idea that an innately timed mechanism contributes to the maturation of orientation selectivity in PV interneurons.
Materials and Methods
Animals
All protocols and procedures followed the guidelines of the Animal Care and Use Committee at the University of California, Irvine. To identify PV-expressing interneurons, PV-tdTomato (PV-tdT) mice were generated. The PV promoter in these mice drives expression of Cre, which then subsequently activates expression of the red fluorescent reporter protein tdTomato (Hippenmeyer et al., 2005; Madisen et al., 2010). Other mice solely expressing Cre under the control of the PV promoter were used for viral targeting of GCaMP6s expression to PV cells. Both male and female mice were studied.
MGE dissection and transplantation
The MGE was dissected from embryonic day (E) 13.5 PV-tdT embryos as previously described (Davis et al., 2015). Detection of a sperm plug was used to define E0.5. Explants were maintained in chilled L-15 medium and DNase (Roche; 40 μl/ml) until transplantation. MGE chunks were loaded into a beveled glass micropipette (50–75 μm tip diameter) using a hydraulic manipulator (Narishige, MO-10). The loaded micropipette was lowered perpendicular to the surface of the right hemisphere and advanced quickly 650–750 μm into the cortex.
GCaMP6s virus delivery
To assess visual responses of PV and Exc neurons, adeno-associated virus (AAV)-Syn-GCaMP6s (Chen et al., 2013; UPenn Vector Core AV-1-PV2824) was injected into visual cortex 2–3 weeks before imaging. For recordings from host PV (hPV) interneurons, PV-Cre pups were injected with Cre-activated GCaMP6s (AV-1-PV2821). Virions were diluted 10-fold with ACSF to ∼2 × 10¹² genome copy number per milliliter and 150–400 nl was injected at a rate of 5–15 nl/min.
Surgical preparation
At least 2 days before imaging, custom-made titanium headplates were affixed to the skull using Vet bond and dental acrylic. Kwik-cast sealant (World Precision Instruments) was placed on the skull to prevent drying. Mice were anesthetized with isoflurane in O2 (2–3% for induction, 0.5–1.5% maintenance). Carprofen (5 mg/kg, s.c.) was administered to provide analgesia. Sterile eye ointment (Rugby Laboratories) was used to protect the eyes. Body temperature was maintained at 37.5°C using a heating pad under feedback control from a rectal thermoprobe. Lactated Ringer's solution (∼0.2 ml) was given toward the end of surgery to prevent dehydration. Mice were allowed to recover on a warm heating pad.
For the calcium imaging session, isoflurane and carprofen were used as described above and supplemented by chlorprothixene (1–2 mg/kg, i.p.). A craniotomy (<3 mm diameter) was performed over the binocular visual cortex located using intrinsic signal imaging mapping performed in an earlier recording session (Kalatsky and Stryker, 2003; Gandhi et al., 2008; Davis et al., 2015). A 3 mm glass coverslip (World Precision Instruments) was placed over the exposed brain and sealed with Vetbond and dental acrylic. A thin layer of optically clear silicone oil (30,000 centistokes; Dow Corning) was used to protect eyes. Secretions were reduced through the use of atropine (0.15–0.3 mg/kg, s.c.).
Two-photon imaging
Red (HQ605/75, Chroma Technology) and green (565dcxr, Chroma Technology) fluorescence were gathered with a Moveable Object Microscope system (Sutter Instrument) using a 40× 0.8 Numerical Aperture objective (Olympus) with 920 nm excitation light (Mai Tai HP, Newport). Image sequences typically covering a field of 140 × 140 μm (128 ×128 pixels) were acquired at 6.1 Hz using ScanImage software (v3.8; Pologruto et al., 2003) at a depth of 175–350 μm below the pia.
Visual stimuli
Visual stimuli were generated by custom-written Matlab code using the Psychophysics Toolbox (Brainard, 1997). The monitor was positioned 25 cm from the animal and covered with a color-correction gel filter sheet (day blue gel D2-70, Lowel) to better exploit the spectral sensitivity of mouse vision (Jacobs et al., 2004). All stimuli were presented on an Acer V193 monitor (30 × 37 cm, 60 Hz refresh rate, 20 cd/m2 mean luminance). To measure orientation selectivity, full-field drifting square gratings (0.05 cycles/°; 1 Hz) were presented at 12 directions spaced by 30°. Some recordings made to determine preferred orientation used eight oriented gratings alone. Four or eight repeats of each orientation and a blank stimulus were presented in a randomized order (percentage of PV interneurons shown four repeats: post-natal day (P) 18, 50%; P28, 55%; 25 d after transplantation (DAT), 36%; 35 DAT, 25%). Each stimulus repeat was presented to the contralateral eye for 6 s followed by a 6 s presentation of a gray screen.
Cell counting
Brains were perfused and mounted (300 μm intervals) 40–45 DAT as previously described (Davis et al., 2015), and imaged using a Leica SP8 confocal microscope. Transplanted neurons were counted within a 250 μm2 region centered over the binocular visual cortex that spanned all cortical layers.
Data analysis
Cell responses.
Custom-written Python routines were used to remove motion artifact, identify cell ROIs, and extract calcium fluorescence traces. Endogenous and tPV interneurons were identified by the expression of tdTomato. Host PV interneurons were identified by the green fluorescence of flex-GCaMP6s and absence of red fluorescence present in tPV interneurons. Neurons with nuclear expression of GCaMP6s were not recorded (Chen et al., 2013).
For each imaged cell, a fluorescence trace was computed by averaging the values across all pixels in the ROI. Neuropil contamination was removed from each trace by subtracting the averaged value of pixels in a 20 μm shell surrounding the ROI (Kerlin et al., 2010; Chen et al., 2013): FCell = FROI − (r * FNeuropil), where r, the neuropil contamination factor, was estimated from the ratio of averaged fluorescence present in small-diameter blood vessels compared with the surrounding neuropil. For the 0.8 numerical aperture objective used in these experiments, r was estimated as 0.7, closely in line with values reported in other studies (Kerlin et al., 2010; Chen et al., 2013).
To determine a cell's response to each stimulus trial, the cell's trace corresponding to the trial was (1) normalized to the baseline value for the 2 s period preceding stimulus presentation and (2) averaged over the 6 s stimulation period. The cell's response to a given direction θi was defined as the average response across the 4–8 repeats of each condition: F(θi). An estimate of a cell's spontaneous calcium fluctuation was also determined using normalization to the 2 s preceding the start of the blank condition. Neuronal responsiveness was determined using a one-way ANOVA calculated (SciPy v0.16.1) across stimulus conditions plus a blank condition (p < 0.05).
Preferred orientation.
Preferred orientation (θpref) was calculated as half the mean of the directions weighted by the response strength F(θ) at each orientation, expressed as follows (Eq. 1):
 A tuning curve, R(θ), was determined by fitting F(θ) to a sum of two Gaussians centered on θpref and θpref + π, with different amplitudes and equal width, and a constant baseline. The amplitude of the response at the preferred orientation (Rpref) was R(θpref).
Orientation selectivity index.
The cell's orientation selectivity was determined using the circular variance method (Niell and Stryker, 2008; Kerlin et al., 2010) expressed as follows (Eq. 2):
 where F is the response at direction θ.
The orientation selectivity index (OSI) was also computed using the sum-of-Gaussians methods (Niell and Stryker, 2008; Wang et al., 2010; Davis et al., 2015). After fitting F(θ) with the tuning curve, R(θ), the OSI was computed as (Rpref − Rorth)/(Rpref + Rorth), where Rpref was R(θpref) and Rorth was R(θpref + π/2).
Calcium signal decay time.
For each PV interneuron, the decay time of the calcium signal was estimated by (1) aligning the off periods to the stimulus that drove the maximal response, and (2) fitting the average of these off periods with a monoexponential function.
Statistical analyses.
The Mann–Whitney U test was used to assess differences between groups. Correlations were determined using Spearman's rank correlation. Unless otherwise stated, statistical analyses were performed using Prism v6.03 (GraphPad).
Results
Emergence of broad orientation selectivity in PV interneurons
In the days following the onset of vision, it has been shown that PV interneurons exhibit an initial orientation bias (Kuhlman et al., 2011; Li et al., 2012b). By P26–P30, these cells develop broad orientation selectivity comparable to that of adult PV interneurons (Kuhlman et al., 2011; Li et al., 2012a,b). To confirm these electrophysiological observations, we performed two-photon functional imaging using the genetically encoded calcium indicator GCaMP6s (Chen et al., 2013). The visual cortices of neonatal mice were injected with a virus encoding GCaMP6s and then studied at one of two postnatal age ranges: P18–P19 (P18) or P26–P31 (P28; Fig. 1A). We guided our two-photon recordings to the binocular region of the primary visual cortex using intrinsic signal mapping (Davis et al., 2015). Figure 1A shows an example field of view in which a PV interneuron expresses both the red fluorescent protein tdTomato and GCaMP6s while neighboring, putative Exc neurons express only GCaMP6s. Since the synapsin promoter driving GCaMP6s expression is active in all neurons, a small proportion of Exc neurons are likely to be inhibitory neurons.
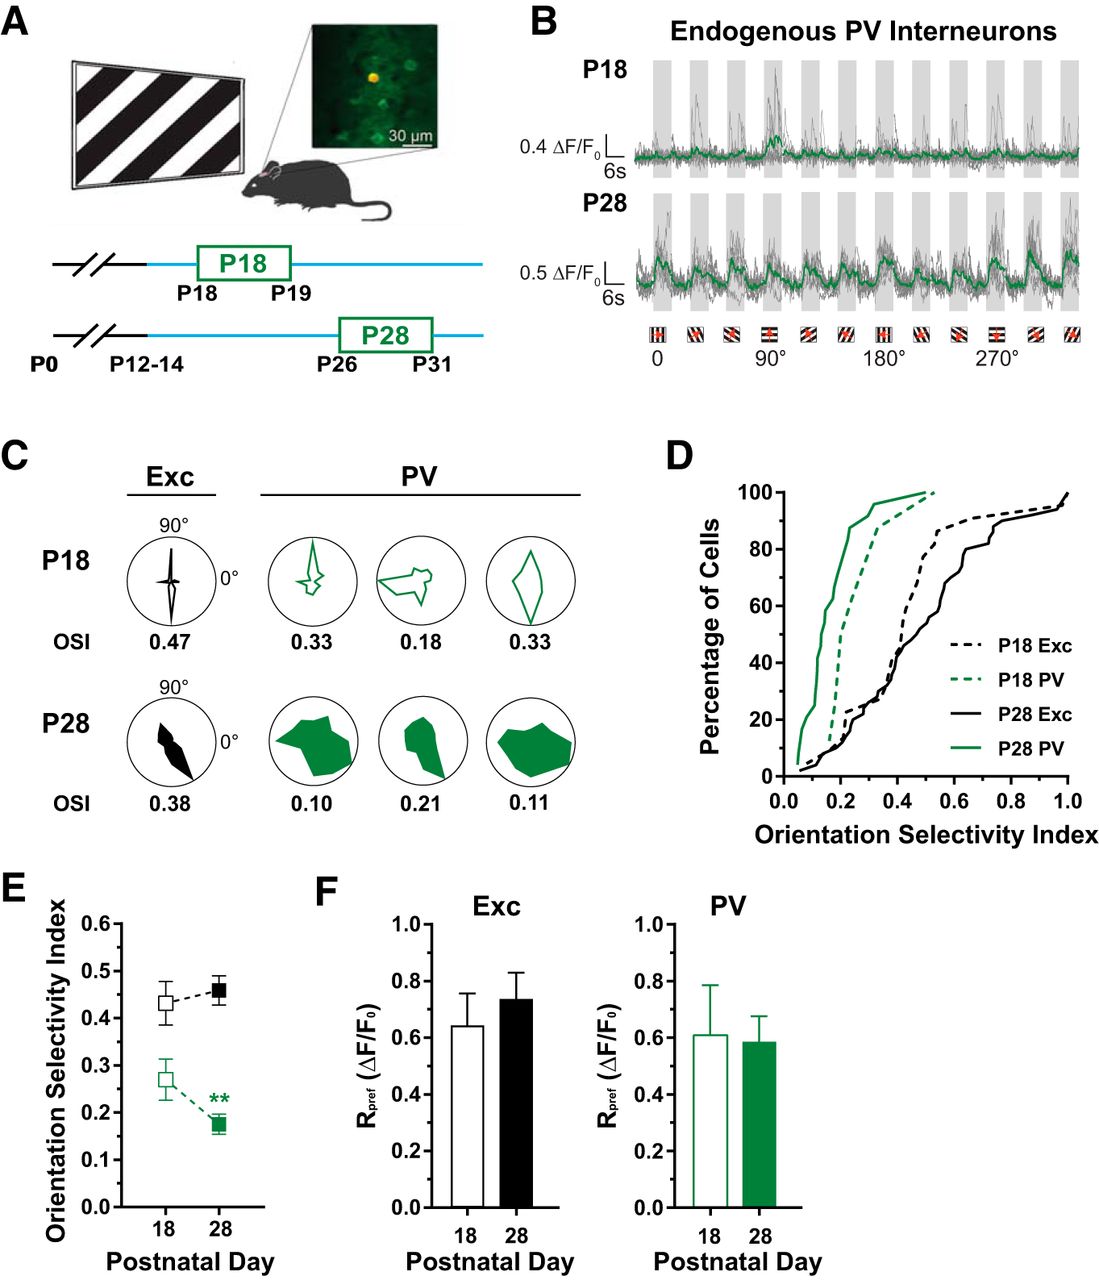
The emergence of broad orientation selectivity in PV interneurons. A, Illustration of experimental setup (above) and imaging timeline (below). In vivo two-photon imaging of visual responses to drifting square-wave gratings stimuli using GCaMP6s. An example field of view (top right) containing a PV interneuron that expresses tdTomato and GCaMP6s (red and green) along with putative Exc neurons expressing GCaMP6s alone (green). Orientation selectivity of cortical neurons was assessed at P18–P19 (P18) and P26–P31 (P28). B, Visual responses to 12 directions of a grating stimulus (6 s on, 6 s off) shown for a PV interneuron recorded at P18 (top) and another recorded at P28 (bottom). Traces for single trials shown in gray and averaged in green. C, Polar plots of averaged visually evoked responses from example PV (green) and neighboring Exc (black) neurons at P18 (top row) and P28 (bottom row). The OSI determined using a circular variance method is shown below each polar plot. D, Cumulative distribution of OSI for Exc (black) and PV (green) neurons at P18 (dashed line) and at P28 (solid line). E, The selectivity of Exc neurons (black) does not change from P18 (0.44 ± 0.05) to P28 (0.48 ± 0.03; U = 469, p = 0.33). In contrast, broad orientation selectivity emerges in PV interneurons (green) between P18 (0.27 ± 0.04) and P28 (0.17 ± 0.02; U = 37; p = 0.009). F, Response amplitudes at the preferred orientation (Rpref). Exc neurons (left) have similar response amplitudes at P18 (0.64 ± 0.11) and P28 (0.74 ± 0.09; U = 452, p = 0.858). Likewise, PV (right) response amplitudes are similar at P18 (0.61 ± 0.18) and P28 (0.59 ± 0.09; U = 87, p = 0.974). Error bars reflect SEM. PV: nP18 = 8 cells, 6 mice; nP28 = 24, 6 mice; Exc: nP18 = 22 cells, 6 mice; nP28 = 50, 6 mice.
We determined orientation selectivity by measuring responses to 12 directions of a drifting grating visual stimulus. Figure 1B shows the responses of two PV interneurons, one recorded in a P18 animal (top) and another recorded at P28 (bottom). The response to each stimulus orientation was averaged across trials and normalized to the time preceding the stimulus. To quantify orientation selectivity, we computed an index (OSI) which was derived from the circular variance of evoked responses to the 12 stimulus directions (Niell and Stryker, 2008; Kerlin et al., 2010; Kuhlman et al., 2011; Li et al., 2012b). Cells with a high OSI responded to only a few directions of the visual stimulus and were considered sharply selective. Cells with a low OSI responded to many directions and were considered broadly selective. The example PV interneuron recorded at P18 was sharply and not broadly selective for orientation (Fig. 1B, top; OSI, 0.33). In contrast, the example PV interneuron recorded at P28 was broadly selective (Fig. 1B, bottom; OSI, 0.10). Figure 1C shows more example PV and Exc visual responses plotted in polar coordinates.
Previous electrophysiological studies have shown that the OSI for PV interneurons is reduced between P18 and P28 (Kuhlman et al., 2011; Li et al., 2012b). The average OSI of P18 PV interneurons using calcium imaging is 0.27 ± 0.04 (Fig. 1D,E). In contrast, the average OSI of P28 PV interneurons is 0.17 ± 0.02 (Fig. 1D,E), confirming the emergence of broad orientation selectivity in these cells by P28 (p = 0.009). In contrast to the PV interneurons, Exc neurons are sharply selective at both P18 (0.44 ± 0.05) and P28 (0.48 ± 0.03; Fig. 1D,E). From P18 to P28, the amplitude of responses at the preferred direction (Rpref) for both populations remained unchanged (Fig. 1F).
In addition to the circular variance method, we computed an alternative OSI by fitting evoked responses with a sum of Gaussians (Niell and Stryker, 2008; Kerlin et al., 2010). We found a strong correlation between OSI values computed using the circular variance method and the sum-of-Gaussians method (r = 0.95, p < 0.0001; Fig. 2A).

Robust orientation selectivity estimation in endogenous PV interneurons. Open and closed green squares represent P18 and P28 PV neurons, respectively. A, OSI calculated using the circular variance method is highly correlated to the index value determined using a sum-of-Gaussians fitting method (r = 0.95, p < 0.0001). B, Response amplitude at the preferred orientation did not affect OSI values (r = −0.13, p = 0.484). C, Orientation selectivity is weakly correlated with baseline signal intensity (r = −0.43, p = 0.014). D, The calcium signal decay is not correlated with orientation selectivity (r = 0.038, p = 0.838).
We considered alternative explanations for the apparent 37% reduction of OSI in PV interneurons from P18 to P28. It is possible that the apparent sharp selectivity at P18 stemmed from weaker GCaMP6s expression. We found, however, no systematic relationship between the response at the preferred orientation, Rpref, and OSI (r = −0.13, p = 0.484; Fig. 2B). It is also possible that the broader tuning observed at P28 is the product of increased baseline fluorescence. We found a significant but weak relationship between the baseline signal intensity and OSI (r = −0.43; p = 0.014; Fig. 2C). Significant increases in the decay of calcium signals in PV interneurons could reduce OSI. However, we did not find a relationship between calcium decay and OSI (r = 0.038, p = 0.838; Fig. 2D). Together, these observations confirm previous studies that found that PV neurons develop broad orientation selectivity by P28.
Emergence of broad orientation selectivity in tPV interneurons
Next, we sought to address whether the onset of vision in host animals determines when tPV interneurons develop broad orientation selectivity. Precursors of cortical PV interneurons are born in the MGE from E12 to E16 and subsequently migrate into the cerebral cortex during the third gestational week (Wichterle et al., 1999; Wonders and Anderson, 2006). At P18, 4–6 d after the onset of vision, PV interneurons are ∼20–28 d old. By P28, 14–16 d after the onset of vision, PV interneurons reach 33–38 d old. During this interval, we observe the emergence of broad orientation selectivity in endogenous PV interneurons (Fig. 1). To determine whether the onset of vision instructs the emergence of broad orientation selectivity in tPV interneurons, we grafted E13.5 interneuron precursors from the MGE to the postnatal (P4–P11) visual cortex ∼1 week before the onset of visual experience (Fig. 3A). We injected GCaMP6s-expressing virions (AAV-Syn-GCaMP6s) into transplanted visual cortex 2–3 weeks before imaging. tPV interneurons were identified by the expression of the red fluorescent protein, tdTomato.

The emergence of broad orientation selectivity in tPV interneurons. A, Embryonic interneuron precursors were transplanted into neonatal pups aged P4–P11 and P4–P8 and studied 25 and 35 DAT, respectively. tPV interneurons were identified by tdTomato expression. Neighboring, putative host Exc neurons were identified by GCaMP6s expression alone. Orientation selectivity was assessed 24–26 (25 DAT) or 35–38 DAT (35 DAT) when the host age was between P30–P35 and P39–P44, respectively. B, Visual responses to 12 directions of grating stimulus (6 s on, 6 s off) shown for a tPV neuron recorded 25 DAT (top) and another recorded 35 DAT (bottom). Traces for single trials shown in gray and averaged in red. C, Polar plots of averaged visually evoked responses for example Exc (black) and tPV (red) neurons. The OSI is shown below each plot. D, Cumulative distribution of OSI for Exc (black) and tPV (red) neurons at 25 (dashed line) and 35 DAT (solid line). E, Change in orientation tuning between 25 and 35 DAT. Orientation selectivity in Exc neurons is unchanged between 25 (0.43 ± 0.03) and 35 DAT (0.47 ± 0.04; U = 1432, p = 0.457). In contrast, broad orientation selectivity emerges in tPV interneurons between 25 (0.32 ± 0.06) and 35 DAT (0.16 ± 0.02; U = 60, p = 0.030). F, The response amplitude at the preferred orientation (Rpref) determined using a sum-of-Gaussians fit for Exc (black) and tPV (red) neurons. The response amplitude is higher for Exc neurons (left) at 35 DAT (closed bar; 1.32 ± 0.17) than at 25 DAT (open bar; 0.83 ± 0.10; U = 1074, p = 0.003). In contrast, tPV interneuron (right) Rpref is similar between 25 (0.62 ± 0.09) and 35 DAT (0.60 ± 0.07; U = 107, p = 0.846). Error bars reflect SEM. tPV: n25DAT = 14 cells, 6 mice; n35DAT = 16, 6 mice; Exc: n25DAT = 72 cells, 6 mice; n35DAT = 44 cells, 6 mice.
The orientation selectivity of tPV interneurons was first assessed 24–26 DAT (25 DAT), >2 weeks (16–22 d) after the onset of vision. Figure 3B shows the visual responses of a 25 DAT tPV interneuron (top) to oriented, drifting gratings. The transplanted interneuron was sharply and not broadly selective (OSI, 0.40). Figure 3C shows more example tPV and Exc visual responses plotted in polar coordinates. Across the population of 25 DAT tPV interneurons, the average OSI was 0.32 ± 0.06 (Fig. 3D,E). Impressively, >80% of GCaMP6s-expressing tPV neurons were found to be responsive (Table 1).
Fraction of responsive neurons across cell types and groups
The sharp orientation selectivity of tPV interneurons 25 DAT is revealing. At this stage, the host animals had 2 weeks of visual experience and had reached 30–35 d old, beyond the age at which broad orientation selectivity emerges in endogenous PV interneurons (Fig. 1). If factors produced by the onset of vision drive the emergence of broad orientation selectivity in PV interneurons, then the development of broad selectivity in the younger tPV interneurons should have been accelerated. We found instead at 25 DAT that tPV interneurons are sharply tuned, challenging the view that the onset of vision alone determines when orientation selectivity emerges in these neurons.
It was possible that tPV interneurons were prevented from developing broad orientation selectivity in the host brain. Next, we measured the orientation selectivity of tPV interneurons 35–38 DAT (35 DAT) in recipient animals 39–44 d old. Figure 3B (bottom) shows the responses and orientation selectivity of a tPV interneuron 35 DAT (OSI, 0.17). We observed that orientation selectivity for 35 DAT PV interneurons (0.16 ± 0.02) was broader than for the 25 DAT PV group (32 ± 0.06; p = 0.030; Fig. 3D,E). From 25 to 35 DAT, the amplitude of responses at the preferred orientation (Rpref) for tPV interneurons remained unchanged (Fig. 3F).
We also assessed orientation selectivity in neighboring putative Exc neurons in the host visual cortex. In contrast to tPV interneurons, we found no discernible change in the orientation selectivity of Exc neurons in the host brain from 25 (0.43 ± 0.03) to 35 DAT (0.47 ± 0.04; p = 0.467). Since Exc neurons were identified by GCaMP6s expression alone, this population may include some transplanted non-PV-expressing interneurons as well as host interneurons.
Similar to endogenous PV interneurons, the orientation selectivity of transplanted interneurons computed using the circular variance method and the sum-of-Gaussians method was highly correlated (r = 0.96, p < 0.0001; Fig. 4A). As for endogenous PV interneurons, the developmental broadening of OSI in tPV interneurons could not be explained by changes in response strength (r = −0.175, p = 0.356; Fig. 4B) or calcium signal decay time (r = −0.031, p = 0.872; Fig. 4D). In contrast to the weak correlation found for endogenous PV interneurons, there was no relationship for transplanted PV neurons between baseline signal intensity and OSI (r = 0.336, p = 0.069). Furthermore, the number of transplanted interneurons could not explain the range of orientation selectivity observed (r = 0.40, p = 0.375; Fig. 4E). Moreover, the laminar distribution of tPV interneurons was comparable 25 versus 35 DAT (Fig. 4F).

Robust orientation selectivity estimation in tPV interneurons. Open and closed red squares represent tPV neurons 25 and 35 DAT, respectively. A, OSI values calculated using the circular variance and two-peak Gaussian method were highly correlated (r = 0.96, p < 0.0001). B, There is no correlation between orientation tuning and response at the preferred orientation (r = −0.175, p = 0.356). C, Baseline signal intensity does not determine orientation tuning (r = 0.336, p = 0.069). D, The calcium signal decay is not correlated with orientation selectivity (r = −0.031, p = 0.872). E, Number of tPV interneurons found does not determine OSI (r = 0.40, p = 0.375). F, Laminar distribution of tPV interneurons 25 (open) versus 35 DAT (closed).
Although we estimated and removed the local neuropil signal from each recording (see Materials and Methods; Fig. 5A), it was possible that residual neuropil contamination biased our measurements of orientation selectivity in tPV neurons. We observed a strong correlation between endogenous PV orientation selectivity and the selectivity of the surrounding neuropil (r = 0.709, p < 0.0001; Fig. 5B). Furthermore, we found that the orientation selectivity of endogenous PV neurons was correlated to the intensity of the surrounding neuropil (r = −0.44, p = 0.012; Fig. 5C). To assess whether our measurements from tPV neurons was affected by neuropil, we compared the orientation selectivity of these cells with both the orientation selectivity and intensity of the surrounding neuropil. Unlike endogenous PV interneurons, the orientation selectivity of the transplanted interneurons was not correlated to either the orientation selectivity (r = 0.269, p = 0.150; Fig. 5D) or intensity (r = 0.327, p = 0.077; Fig. 5E) of the surrounding neuropil. These results suggest that neuropil contamination was not artifactually producing the observed broadening of orientation selectivity in tPV neurons.

Influence of local neuropil on the orientation selectivity of PV interneurons. A, Fluorescence signal from a 25 DAT tPV interneuron without local neuropil signal subtracted (top, purple), the local neuropil (middle, blue), and the interneuron after neuropil signal subtraction (bottom, red). Polar plots on right show averaged visually evoked responses. Without neuropil signal subtracted, the selectivity of the neuron is 0.26. The local neuropil signal alone is broadly tuned (OSI, 0.12). With neuropil subtracted, selectivity of the cell is sharpened (OSI, 0.40). B, The orientation selectivity of endogenous PV interneurons (green) is correlated with the selectivity of the local neuropil at P18 (open) and P28 (closed; r = 0.709, p < 0.0001). C, The strength of the neuropil signal is moderately correlated with the selectivity of endogenous PV interneurons (r = −0.44, p = 0.012). D, No correlation was found between the orientation selectivity of tPV interneurons and local neuropil (25 DAT, open symbol; 35 DAT, closed symbol; r = 0.269, p = 0.150). E, Similarly, no correlation was found between the orientation selectivity of tPV interneurons and the strength of the neuropil signal (r = 0.327, p = 0.077).
Transplantation does not affect host parvalbumin orientation selectivity
In early development, Exc neurons in the visual cortex initially respond to visual stimulus presented along the cardinal axes (Rochefort et al., 2011; Hoy and Niell, 2015). Since the orientation preference of visual responses in mature PV neurons matches the averaged preferred orientation of their Exc neighbors (Kerlin et al., 2010; Runyan et al., 2013; Scholl et al., 2015), it may be that the broadening of orientation selectivity in PV neurons reflects the emergence of excitatory responses to noncardinal stimuli. The sharp orientation selectivity in tPV neurons observed at 25 DAT might reflect a transplant-induced restoration to cardinal responses in the host excitatory population. If transplantation restores the bias to cardinal responsiveness, then the pooling of Exc cell activity by endogenous PV interneurons in the transplanted cortex (hPV) would give rise to sharp orientation selectivity in these PV neurons. To characterize the orientation selectivity of hPV interneurons, we used a strategy that restricted GCaMP6s expression to PV interneurons expressing Cre recombinase. By transplanting into PV-Cre recipients, we discriminated hPV from tPV interneurons by the presence of green fluorescence (expression of GCaMP6s) without red fluorescence (tdTomato minus transplanted cells). Figure 6B shows responses of two example hPV interneurons at 25 (top) and 35 DAT (bottom). Figure 6C shows more example hPV visual responses plotted in polar coordinates (green).

hPV interneurons retain broad orientation selectivity after transplantation. A, Embryonic interneuron precursors expressing tdTomato following PV expression (PV-tdT) were transplanted into PV-Cre transgenic pups aged P8 and P3–P5 and studied at 25 and 35 DAT, respectively. Virus carrying Cre-activated GCaMP6s was injected 2–3 weeks before imaging. tPV interneurons were identified by tdTomato expression. Endogenous PV neurons in transplanted (top timeline; hPV) and nontransplanted age-matched (bottom timeline) brains were visualized by GCaMP6s expression alone. B, Visual responses to 12 directions of grating stimulus (6s on, 6 s off) shown for an hPV interneuron recorded 25 DAT (top) and another recorded 35 DAT (bottom). Traces for single trials shown in gray and for averaged trials shown in green. C, Polar plots of averaged visually evoked responses from example hPV interneurons (green) 25 (top) and 35 DAT (bottom) and age-matched controls (magenta). D, Cumulative distribution of OSI for hPV (green) interneurons and age-matched controls (magenta). E, At 25 DAT (left), orientation selectivity of hPV (green; 0.19 ± 0.02) neurons is similar to that of age-matched controls (magenta; 0.17 ± 0.03; U = 236.5, p = 0.642). Likewise, at 35 DAT (right), orientation selectivity of hPV (green; 21 ± 0.03) neurons is similar to that of age-matched controls (magenta; 0.16 ± 0.02; U = 342, p = 0.17). F, Rpref for PV interneurons (green) and age-matched PV interneurons (magenta) 25 (left) and 35 DAT (right). PV interneuron Rpref 25 DAT (1.00 ± 0.12) is not significantly different from that of age-matched controls (0.76 ± 0.08; U = 184, p = 0.350). By 35 DAT, hPV interneuron Rpref (1.12 ± 0.10) is significantly greater than in age-matched controls (0.78 ± 0.09; U = 248, p = 0.004). Error bars reflect SEM. hPV: n25DAT = 31 cells, 4 mice; n35DAT = 31 cells, 5 mice; control for 25 DAT: n = 14 cells, 1 mouse; controls for 35 DAT: n = 28 cells, 2 mice.
For comparison, visual responses were obtained from PV interneurons using the same Cre-dependent viral strategy in age-matched PV-Cre mice that did not receive transplantation (magenta). We found that the orientation selectivity of hPV neurons was not different from that of nontransplanted, age-matched PV neurons at either 25 DAT (hPV, 0.17 ± 0.03; P30, 0.19 ± 0.02; p = 0.642; Fig. 6D,E) or 35 DAT (host PV, 0.16 ± 0.02; P40, 0.21 ± 0.03; p = 0.166; Fig. 6D,E). Interestingly, we observed a transplant-induced increase in the amplitude of responses at the preferred orientation among hPV neurons 35 DAT (hPV, 1.12 ± 0.10; P40 PV, 0.78 ± 0.09; p = 0.004; Fig. 6F) that was not present at 25 DAT (hPV, 1.00 ± 0.12; P30, 0.76 ± 0.08; p = 0.350; Fig. 6F).
Given that PV interneurons pool neighboring orientation preferences (Kerlin et al., 2010; Runyan et al., 2013; Scholl et al., 2015), the broad tuning of hPV interneurons at 25 DAT (Fig. 6D,E) suggests that any potential cardinal bias in the host excitatory network has little bearing on PV orientation selectivity. Instead, our data suggest that the emergence of broad orientation selectivity in PV interneurons depends on innate mechanisms residing within these cells or in the excitatory connections onto these neurons.
Discussion
Using in vivo calcium imaging and interneuron transplantation, we have shown that the emergence of broad orientation selectivity in tPV interneurons does not depend solely upon the start of vision in the host animal. Other transplantation studies have shown that inhibitory interneurons follow a developmental timeline that can be uncoupled from the animal's age and experience. For example, transplanted cortical MGE interneurons undergo apoptosis according to the transplanted cell age and not the host tissue age (Southwell et al., 2012). In both juvenile (Southwell et al., 2010; Tang et al., 2014) and adult (Davis et al., 2015) visual cortex, MGE cell transplantation reactivates critical-period plasticity when the donor animal would have reached its critical period. Although our results are consistent with the notion that the cell age of PV interneurons determines when orientation selectivity in these cells matures, further studies will be needed to evaluate this hypothesis. Perhaps the most direct demonstration of cell age as the primary determinant would be to transplant older interneurons into younger cortex and then to examine whether the transplanted cells developed broad orientation selectivity earlier than their host counterparts.
It has been proposed that the emergence of broad orientation selectivity in PV interneurons may be responsible for triggering the critical period for ocular dominance plasticity (Kuhlman et al., 2011). This hypothesis predicts that broad orientation selectivity would emerge in tPV interneurons when these neurons reactivate plasticity, ∼35 DAT. Our results confirm that broad orientation selectivity emerges in tPV interneurons by 35 DAT.
It has been shown that the development of inhibitory circuits depends on the presence of growth factors in developing visual cortex (Huang et al., 1999; Sugiyama et al., 2008; Beurdeley et al., 2012). Our results indicate that the availability of these factors, although likely supportive, does not appear to determine when PV interneuron orientation selectivity matures. Instead, our results suggest that in addition to visual experience, a mechanism that resides within PV interneurons or perhaps in the growth of excitatory connections onto these cells promotes the emergence of broad orientation selectivity.
It is interesting that transplantation increases the amplitude of visual responses in endogenous PV interneurons while not disturbing orientation selectivity. Previous studies have shown that interneuron transplantation reactivates ocular dominance plasticity in both juvenile (Southwell et al., 2010, Tang et al., 2014) and adult recipients (Davis et al., 2015) ∼35 DAT. The increase in activity of endogenous PV interneurons 35 DAT may provide a substrate for the rapid disinhibition found to initiate juvenile ocular dominance plasticity (Kuhlman et al., 2013; Sun et al., 2016). To better understand how transplantation reactivates cortical activity, future experiments should examine what effects transplantation has on the strength and connectivity of endogenous interneurons.
Interneuron precursors from the MGE give rise to multiple GABAergic cell types, including somatostatin-expressing neurons. It has been shown recently that the maturation of PV circuit formation is dependent on the early integration of somatostatin-expressing interneurons (Tuncdemir et al., 2016). Therefore, it may be that the development of transplanted somatostatin interneurons plays a role in the emergence of broad orientation selectivity in tPV interneurons. Further MGE transplantation studies may address this possibility.
It has been suggested that the broad orientation selectivity of mature PV interneurons is a product of the widely divergent orientation preferences of the local excitatory neurons (Kerlin et al., 2010; Hofer et al., 2011; Runyan and Sur, 2013; Scholl et al., 2015). Since the orientation preferences of young mouse visual cortex has an initial cardinal bias that is lost by adulthood (Rochefort et al., 2011; Hoy and Niell, 2015), the timed emergence of broad orientation selectivity in PV interneurons may simply be caused by the loss of cardinal preference among excitatory neurons. Our evidence of broad tuning in hPV interneurons at 25 DAT when tPV interneurons are sharply tuned undermines this hypothesis. With our current data, however, we cannot rule out the possibility that transplantation causes a subtle reorganization in the host visual cortex. Indeed, the presence of non-PV transplanted interneurons may skew our estimates of the orientation selectivity in the host network. Alternatively, it may be that developmental changes in spike threshold make PV interneurons responsive to a wider range of stimulus orientations (Okaty et al., 2009). Another possibility is that the developmental reorganization of synaptic or electrical coupling between interneurons produces the broad orientation selectivity of mature PV interneurons (Galarreta and Hestrin, 2002; Meyer et al., 2002; Pangratz-Fuehrer and Hestrin, 2011; Ko et al., 2013). The transplantation preparation developed in this study provides a powerful experimental system for addressing these mechanistic questions about PV interneuron maturation.
Although we found no evidence that transplantation affected the orientation selectivity of cells endogenous to the host cortex, it may alter other functional properties of visual cortical responses. Interneuron transplantation has been shown to reactivate ocular dominance plasticity and to restore spatial acuity in the visual cortex of adult amblyopic mice (Davis et al., 2015). It may be that transplantation also affects the binocularity or spatial frequency selectivity of cortical neurons.
Our functional recordings reveal that tPV interneurons retain the growth programs needed to develop mature orientation selectivity. Our analysis of the orientation selectivity and orientation preferences of the host excitatory network also suggests that the insertion of these new cells does not grossly disturb information processing in the recipient visual cortex. Altogether, these results highlight the therapeutic potential for brain repair using inhibitory neuron transplantation while preserving normal function in recipient neural circuits.
Footnotes
This work was supported by a National Institutes of Health Director's New Innovator Award (DP2 EY024504-01), a Whitehall Grant, a Searle Scholars Award, and a Klingenstein Fellowship. K.L.E. and E.R.H. were supported by a predoctoral training grant from the U.S. Department of Education Graduate Assistance in Areas of National Need program. We thank J. Cang and F. Weghorst for providing a critical reading of the manuscript. We also thank V. Jayaraman, R. Kerr, D. Kim, L. Looger, and K. Svoboda from the Genetically-Encoded Neuronal Indicator and Effector Project, Janelia Farm Research Campus, Howard Hughes Medical Institute, for making the GCaMP6s vectors available. Confocal imaging was made possible by the Optical Biology Shared Resource of a University of California Irvine Cancer Center support grant (CA-62203).
The authors declare no competing financial interests.
- Correspondence should be addressed to Sunil P. Gandhi, 2213 McGaugh Hall, Department of Neurobiology and Behavior, University of California, Irvine, Irvine, CA 92697-4550. sunil.gandhi{at}uci.edu


