

Article Figures & Data
Figures
- Figure 1.
The tasks and stimuli. A, Behavioral paradigm. Each trial was initiated when the monkey pulled a lever, bringing up a rectangular gray window. The monkey had to keep its gaze within the window for 400 ms to start a trial. Trials started with a static image followed by nontarget stimuli, which could be just a vocal sound (auditory or A-alone), just a movie clip (visual or V-alone), or bimodal (AV). For A-alone trials, the static image remained on the screen until the end of each trial. After repeating the sequence of static image-nontarget stimuli randomly from 3 to 6 times, we presented an oddball (target) stimulus that differed in its sound or movie content from the nontarget (B, circumscribed by yellow dashed lines). In the figure, the third and fourth stimuli are temporally shrunken. Monkeys had to release the lever upon detection of the target to receive a reward. This was followed by a >1000 ms break period, before another trial could be initiated. B, Stimuli during Tasks 1 and 2. While both tasks used same nontarget stimulus and repeated a sequence of static image and a nontarget stimulus, they differed in the static image that appeared before the first and between following nontargets. The image in Task 2 was the first frame of the following movie clip, whereas in Task 1 the image was the scramble of the first frame. Consequently, a face abruptly appeared at the onset of every movie clip in a trial of Task 1, but in Task 2 a face appeared abruptly only once before the first movie clip. Arrowheads indicate the timing when such abrupt onset of face could occur in both Tasks. In an A-alone trial, the static image was taken from the first clip of the movie clip that was a visual counterpart of the following vocal sound.
- Figure 2.
Location of electrode penetrations in Monkey P. A, Reconstruction of Monkey P's brain, in which the surface of the superior temporal gyrus was exposed by cutting away the parietal and frontal opercula. Left, Right, Auditory areas at higher magnification. Dashed lines indicate borders of auditory areas that were identified in Nissl-stained and parvalbumin-immunolabeled sections. Black dots indicate the electrode penetration sites, identified in Nissl-stained and immunolabeled sections White arrow indicates the penetration into auditory belt that is shown in B. B, Nissl-stained sections of auditory cortex (top) and the lower bank of the STS (bottom), showing the electrode penetration (white arrows) indicated by white arrow in A. Black arrowheads indicate the borders of primary auditory cortex (A1). AL, Anterolateral area; circ. s, circular sulcus; CPB, caudal parabelt area; cs, central sulcus; ls, lateral sulcus; ML, middle lateral area; ps, principal sulcus; R, rostal area of auditory core; RPB, rostral parabelt area; sts, superior temporal sulcus; Tpt, temporal parietotemporal area. Scale bar: B, 0.5 mm.
- Figure 3.
Representative FP responses to face and auditory stimuli in A1. A, Depth profile of FP responses to the face (red) and the sound (blue) of an exemplar AV vocalization during V-alone and A-alone trials of Task 1. Top to bottom, Positions of superficial to deep channels. Bottom inset, Expanded time courses of the visual and auditory stimuli. B, CSD responses. Downward (negative) and upward (positive) deflections are current sinks and sources, respectively. C, MUA responses. A–C, Lines indicate mean of 183 and 131 responses to visual and auditory stimuli, respectively. Dotted lines indicate the 95% CIs. Horizontal dashed lines indicate the borders between the upper bank of lateral sulcus (UB), supragranular layer (Sg), granular layer (Gr), and infragranular layer (Ig) in the auditory cortex. D, Superimposition of the auditory FP responses at all depths shown in A. Vertical bars represent the timing of two peaks in FP responses (magenta and cyan for N1 and P2 peaks, respectively). *P1, **N1, ***P2 in D-G. E, Amplitude distributions of auditory N1 and P2 across depths. F, Visual FP responses in same format as D. Between D and F, timing windows are different due to difference of the onset timing, 244 ms, between auditory and visual stimuli. However, durations of figures are same between D and F, to compare responses of two modalities at same resolutions. G, Amplitude distributions of visual N1 and P2.
- Figure 4.
Comparisons of FP responses to faces between areas. A, FP responses to faces in V-alone trials during Task 1, averaged across sites in caudal areas (cyan, n = 17), A1 (black, n = 33), and rostral areas (red, n = 8). B, FP responses to the onset of static face images in all trials during Task 2, averaged across sites in caudal areas (cyan, n = 12), A1 (black, n = 35), and rostral areas (red, n = 16). A, B, Dotted lines indicate 95% CIs. Bottom insets, Stimulus time courses. Arrowheads indicate the timing of faces' appearance. C, Median and quartile of N1 peak latency of face responses in V-alone trials during Task 1 are plotted for three groups of areas. D, Median and quartile of N1 peak latency of visual responses to the onset of static face images during Task 2 are plotted for three groups of areas. C, D, Notches indicate 95% CIs of medians.
- Figure 5.
Representative FP responses to faces and vocalizations in area R. A, Depth profile of FP responses to the face (red) and the sound (blue) of an exemplar AV vocalization during V-alone and A-alone trials of Task 1. Intercontact spacing on the electrodes was 200 μm. Red vertical line indicates the visual N1 peak timing, 124.5 ms, at a channel in layer 4. Short red vertical dashed line with a black horizontal arrow indicates that N1 peak timing shifted to 158.5 ms in the deepest channel located in white matter. Bottom inset, Expanded time courses of the visual and auditory stimuli. B, CSD responses. Downward and upward deflections are current sinks and sources, respectively. Red vertical dashed line indicates 158.5 ms. C, MUA responses. A–C, Lines indicate mean of 146 and 78 responses to visual and auditory stimuli, respectively. Dotted lines indicate the 95% CIs.
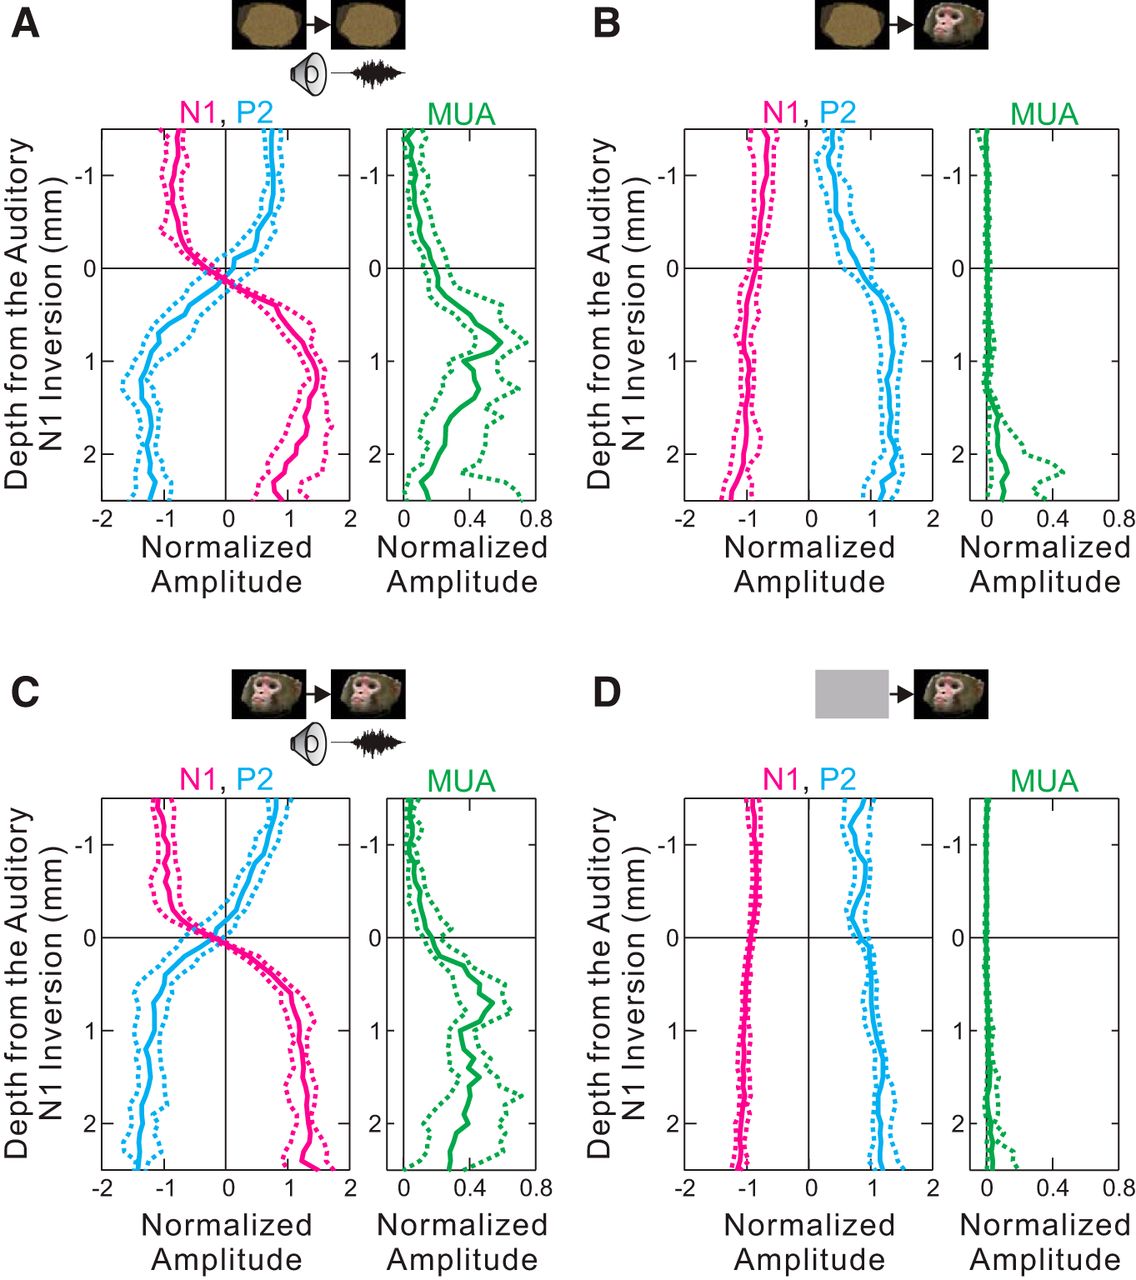
- Figure 6.
Depth-amplitude/polarity gradients for N1 (magenta), P2 (cyan), and MUA (green) in auditory cortex. A, Normalized depth-amplitude/polarity distributions of auditory N1, P2, and MUA responses to sounds during A-alone trials in 3 monkeys performing Task 1 (n = 16, n = 27, and n = 15); median amplitude values with 95% CIs (bootstrap, 1000 resampling) are plotted against depth relative to that of the inversion of auditory N1. B, Normalized depth-amplitude/polarity distributions of N1, P2, and MUA of visual face-onset responses during V-alone trials at the same sites as those in A during Task 1. C, Normalized depth-amplitude/polarity distributions of auditory N1, P2, and MUA responses during A-alone trials in 3 monkeys performing Task 2 (n = 29, n = 29, and n = 5). D, Normalized depth-amplitudes/polarity distributions of N1, P2, and MUA of visual responses to the onset of static face images in all trials at the same sites as those in C during Task 2.
- Figure 7.
Tracking FP responses below auditory cortex. A, A depth FP profile at 0.2 mm resolution from auditory cortex (top) to a point ∼10 mm below auditory cortex (bottom) during A-alone trials in Monkey P performing 3 blocks of Task 2. The depth of the electrode array was shifted between blocks: 3 brackets at the left margin circumscribe electrode channels recorded simultaneously within each block. At depths where electrode array positions were overlapping, FPs corresponding to the overlap positions were averaged. Arrowhead indicates the depth of the polarity inversion of the auditory FP responses. Time course of stimuli at the bottom indicates that a still face image appeared at 0 ms, followed by a movie clip starting at 900 ms, and then by a vocal sound with an additional 244 ms delay. B, Expanded view of the FP during the 100 ms period indicated by red horizontal bar in A (bottom). Vertical line indicates the timing of the visual N1 component. *Visual P1. C, Expanded view of the FP during the 100 ms period indicated by blue horizontal bar in A (bottom). Vertical line indicates the timing of the auditory N1. Double arrowheads indicate the depth of STPa where auditory FP responses show an additional abrupt shift in their laminar voltage gradient, albeit weaker than the frank polarity inversion seen in auditory cortex. D, Amplitude/polarity of visual (red) and auditory (blue) N1 components in B and C plotted against the distance from the auditory N1 inversion. Superimposed dashed lines indicate the amplitudes of visual (red) and auditory (blue) CSD at the timing of N1. *Supragranular sink and source pairs in IT (red) and STPa (blue). Slight overlap of CSD components between STPa and IT is due to coarse spatial sampling with 200 μm intercontact intervals. E, Median and 95% CIs (n = 17) of N1 amplitudes during Task 1 across depth. Amplitudes were normalized within each penetration track, separately for auditory and visual N1. Depth is calibrated relative to the distance between depths of auditory and visual N1 inversions. F, Same as E for FP responses during Task 2 (n = 27).
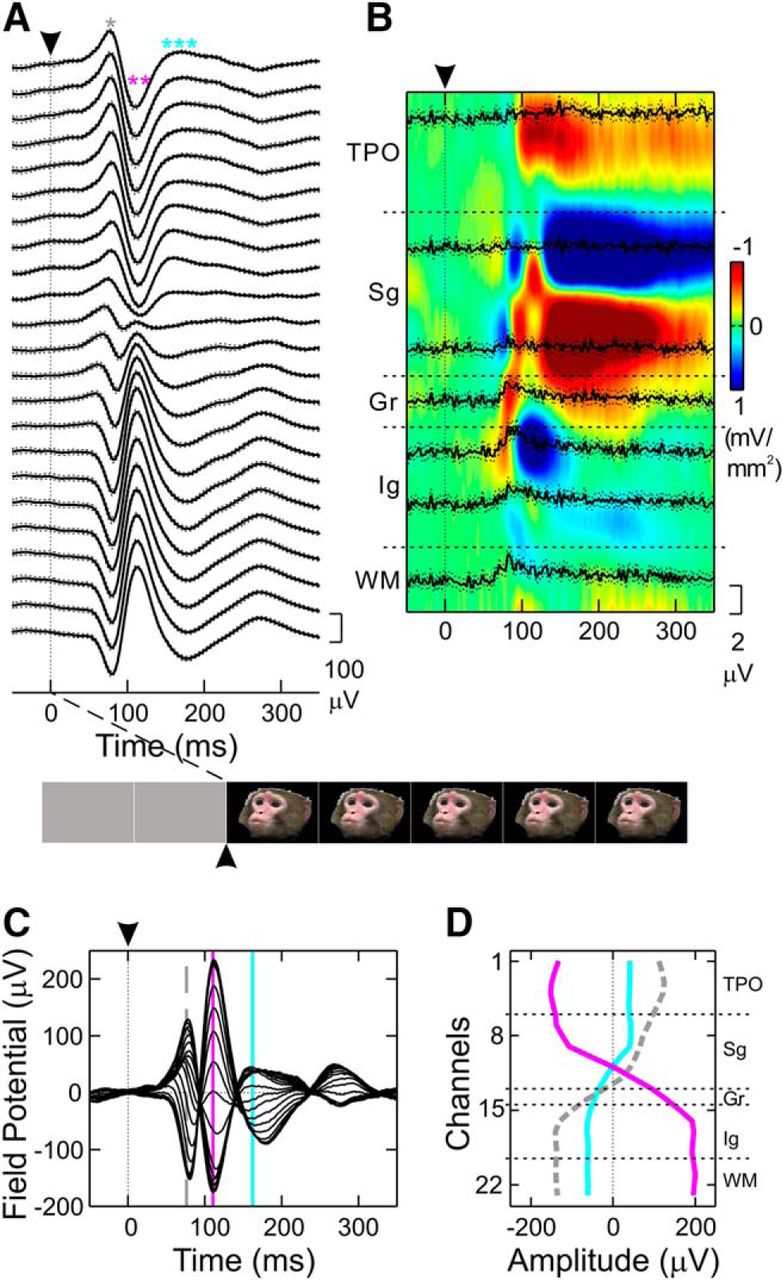
- Figure 8.
A representative laminar profile of face responses in IT. A, Mean FP responses to static face images at the beginning of all trials (n = 86), simultaneously recorded across the layers of IT, in Monkey G performing Task 2 using an electrode with 200 μm intercontact spacing. The electrode was positioned to bracket the layers of IT, so the uppermost channels were located in the supragranular layers of the overlying area TPO and the lowermost channels were in the white matter below IT. Bottom inset, Stimulus time course. A–C, Arrowheads indicate the timing of screen transition. *P1. **N1. ***P2. B, Mean CSD and MUA responses (color plot and line traces, respectively) to faces simultaneously recorded with FP shown in A. A, B, Dotted lines indicate 95% CIs. C, Superimposition of the FP responses in A. Vertical lines indicate the timing of P1 (gray dashed), N1 (magenta), and P2 (cyan). D, Quantified depth distributions of P1, N1, and P2 peak amplitudes.
- Figure 9.
Depth distributions of normalized amplitudes of auditory (A, C) and face responses (B, D) in IT. A, Normalized depth-amplitude/polarity distributions of auditory N1 (blue), P2 (magenta), and MUA (green) responses to sounds of A-alone trials in IT of 3 monkeys performing Task 2 (n = 14, n = 20, and n = 1); median amplitude values with 95% CIs (bootstrap, 1000 resampling) are plotted against depth relative to that of the inversion of visual N1 in B. B, Normalized depth-amplitude/polarity distributions of P1 (gray), N1 (magenta), P2 (blue), and MUA (green) for face responses to static face images at the beginning of all trials during Task 2 at the same sites as those in A. C, Normalized depth-amplitude/polarity distributions of auditory N1, P2, and MUA responses to sounds of A-alone trials in IT of 2 monkeys performing Task 1 (n = 17 and n = 3). D, Normalized depth-amplitude/polarity distributions of P1, N1, P2, and MUA of face responses in V-alone trials during Task 1 at same sites as those in C.
- Figure 10.
Quantifying the relative contribution of local activity to FP responses in IT and AC. A, Spatiotemporal (color map) profile of mean FP response to static face image at the beginning of all trials (n = 86) during Task 2 in an IT site. B, CSD analysis of the FP profile in A. C, FP derived from CSD in B by volume conductor modeling. D–F, Spatiotemporal profiles of mean FPs and CSD responses to stimuli of V-alone trials (n = 205) during Task 2 in an auditory cortical site, in same formats as A–C. G–I, Spatiotemporal profiles of FP and CSD responses to a vocal sound of A-alone trials (n = 16) during Task 2 in the same site as D–F. D–F, G–I, The rows have common color scales. Bottom insets, Time courses of stimuli. G–I, The onset of sound was 137.6 ms. J, Median and quartile of similarity scores between the spatiotemporal patterns of the recorded (observed) and the model-derived (predicted) FP responses during Task 1 are plotted for face response in IT (n = 20) and face responses and auditory responses in auditory cortex (n = 39). K, Same as J for the face response in IT (n = 31) and face responses and auditory responses in auditory cortex (n = 63) during Task 2.
- Figure 11.
Sensory response profiles in STPa. A, Spatiotemporal profiles of mean FP (left) and CSD (right) responses to static image at the beginning of all trials during Task 2 at 0.2 mm intervals from STPa (higher) to IT (lower) recorded from a penetration in Monkey G. Concomitant MUA responses at corresponding depths are superimposed on the CSD plots. STPa and IT both responded with robust excitation. Bottom insets, Stimulus time courses. Inset, Arrowhead indicates the time when a static face image appeared in the rectangle window. B, FP and CSD responses to static image at the beginning of all trials during Task 2 along a track bracketing STPa and IT in Monkey P. C, Auditory-evoked FP and CSD responses to a vocal sound of A-alone trials during Task 2 along the same track as B in Monkey P. The onset of sound was at 137.6 ms. Robust auditory responses were confined to STPa. A–C, Dotted lines for both FP and MUA indicate 95% CIs.


