

Article Figures & Data
Figures
- Figure 1.
A, Simulated connection probability pA,B(v) between neuron classes E and I. Parameters given in Table 1. B, Eigenvalue spectrum of W for a sparse network with {wE, wI, hEE, hEI, hEI, hII, N} = {5.4, 56, 0.022, 0.072, 0.084, 0.34, 1000}. The trivial eigenvalue at λ = −8 is not shown. Unit circle (red) and expected bulk radius qb (gray; Eq. 7) are shown for reference.
- Figure 2.
Globally perturbing the inhibitory network gives rise to a paradoxical inhibitory response in ISNs. A, B, Effect on activity of excitatory and inhibitory neurons in an ISN model of 100 fully connected firing rate neurons of increasing (A) and decreasing (B) excitatory input to the inhibitory population (see Materials and Methods). At 50 ms input is injected to all neurons. At 100 ms, only the input to the inhibitory population is perturbed. Note that increasing the inhibitory input results in a counterintuitive decrease in overall inhibitory activity and vice versa. Parameters: {wE, wI, τ} = {5, 20, 10 ms}. Dashed line is shown for reference to preperturbation activity.
- Figure 3.
Perturbing only a proportion of the inhibitory population may not give rise to a paradoxical inhibitory response. A, B, Result of increasing (A) and decreasing (B) input to a portion p = 50% of the inhibitory population (cf. Fig. 2). Although this network is an ISN with same parameters as in Figure 2, the response of inhibitory neurons to perturbation is starkly different. No evidence for the paradoxical response is visible, the perturbed inhibitory neurons simply follow the perturbing stimulus. Dashed trace is the response of nonstimulated inhibitory neurons shifted up for visibility. The response of excitatory neurons (red) and nonstimulated inhibitory neurons (dashed) are identical.
- Figure 4.
Many inhibitory neurons must be perturbed to evoke a paradoxical inhibitory response. A, Minimum proportion of the inhibitory population p/N that must be perturbed for the paradoxical effect to appear in the perturbed neurons in a network with equal numbers of excitatory and inhibitory neurons. This analytical result does not depend on the size of the network N. Parameters: {hI, hE, fI, τ} = {1, 1, 0.5, 10 ms}. B, Miminum proportion of inhibition p/NI for a network with fI = 20%. Other parameters: {hI, hE, τ, NE, NI} = {1, 1, 10 ms, 80, 20}. Note the difference in scale compared with A. C, Minimum proportion of the inhibitory population p/N that must be perturbed under for the paradoxical effect for networks with sparse synaptic connectivity between excitatory and inhibitory neurons. Note that this does not affect the overall trend for averaged response of stimulated inhibitory neurons (cf. B), but the stochastic effect of introducing sparse connections in smaller networks is evident. Parameters: {hEE, hEI, hIE, hII, NE, NI} = {0.1, 0.5, 0.5, 0.5, 4000, 1000}. “X” in B and C, estimated nominal parameters for mouse visual cortex {wE, wI} = {5.4, 56}. This estimate gives p/NI = 70%. †Non-ISN regime; ‡unstable regime.
- Figure 5.
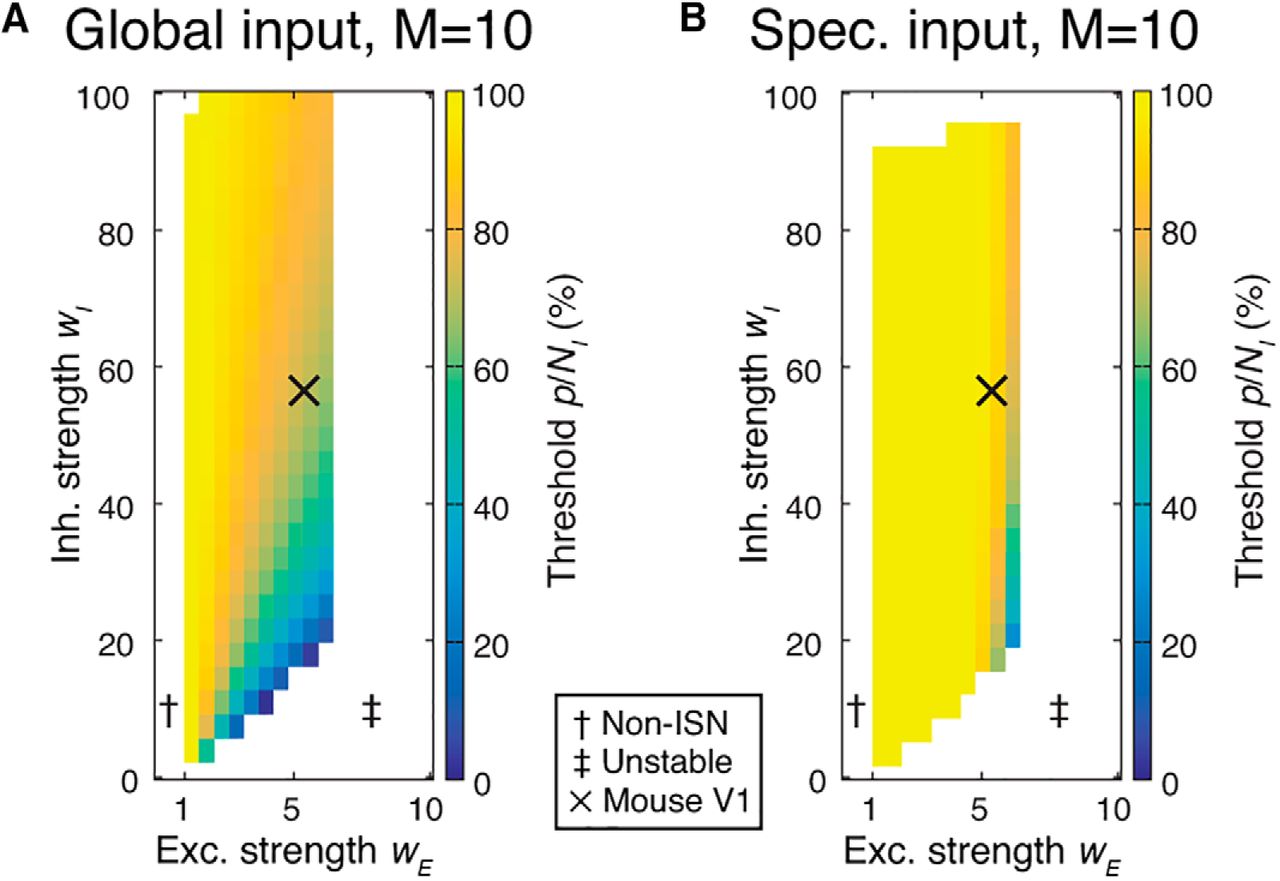
Inhibitory perturbations in networks with specific excitatory connectivity. A, Minimum proportion of inhibition that must be perturbed to observe a paradoxical response is unchanged by the presence of M excitatory subnetworks (M = 10; other parameters as in Fig. 4B), under global external input (cf. Fig. 4B). Specific excitatory connectivity leads to instability for excitatory synaptic strength wE stronger than ∼6.5. B, When external input is provided instead to half of the excitatory subnetworks (Eq. 13), larger fractions of inhibition must be perturbed. Conventions are as in Figure 4. Estimate at “X” in A corresponds to p/NI = 70%; in B, 90%.
- Figure 6.
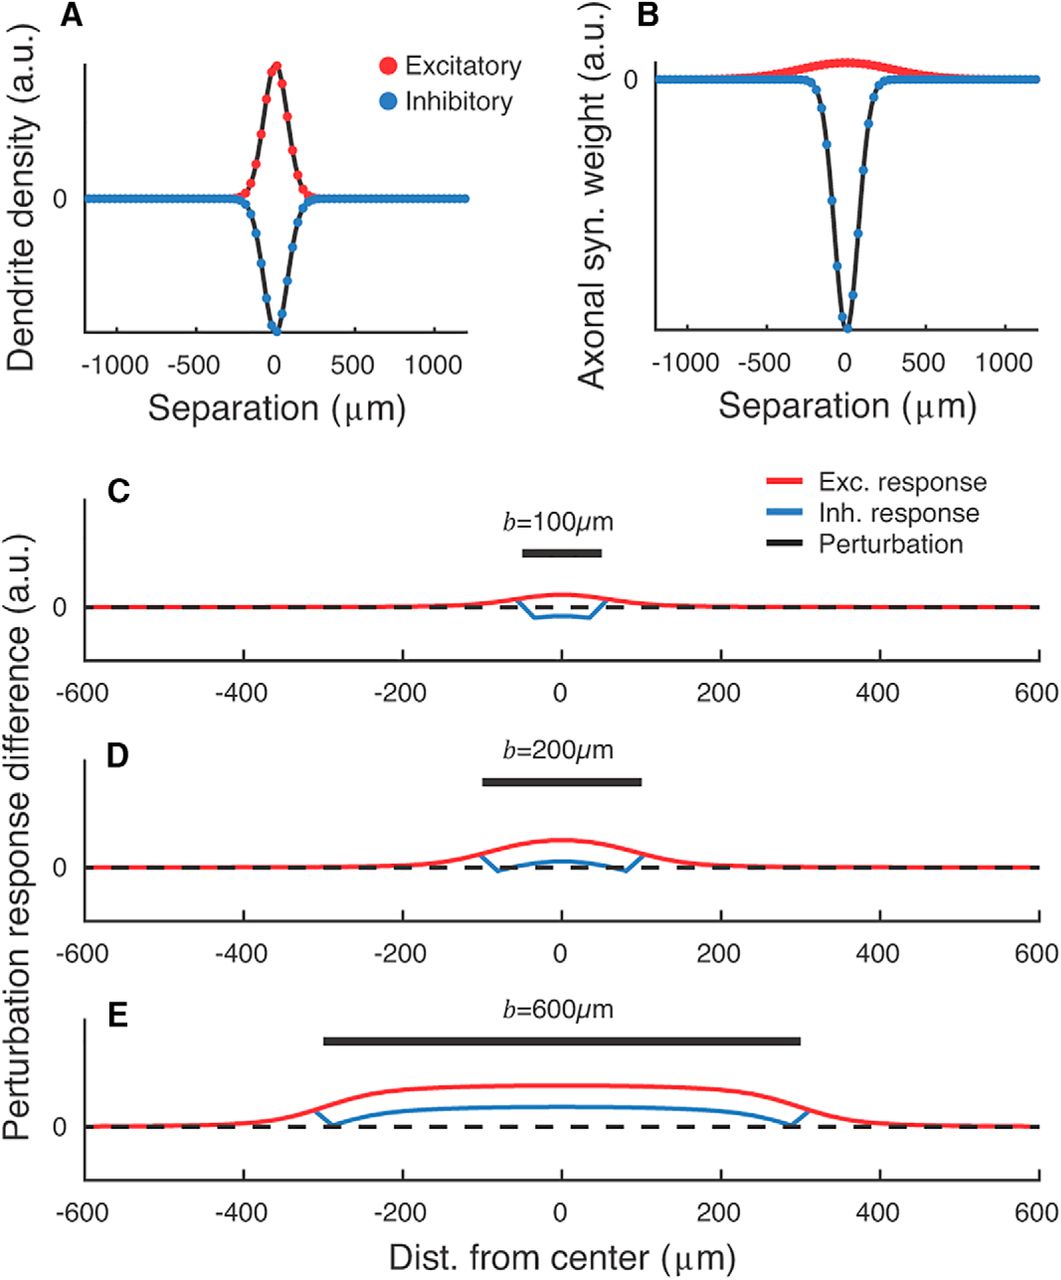
Physical size of an inhibitory perturbation determines whether a paradoxical effect will be displayed in networks with spatial extent. A, B, Cross-sections of 2D dendritic density fields (A) and axonal synaptic weight fields (B) for excitatory (red, positive) and inhibitory (blue, negative) neurons. Dots indicate the resolution of the simulation mesh. C–E, Cross-section of spatial perturbations applied to neural fields in an ISN regime for varying perturbation diameter b. The inhibitory field was perturbed with δ = −0.2. For narrow perturbations, the perturbed inhibitory neurons do not show a paradoxical response even in the presence of an ISN regime (C; perturbation suppressed inhibitory activity). For wider perturbations, a paradoxical inhibitory response is evoked (D,E; perturbation increased inhibitory activity). C–E are shown on a common scale. Parameters are as in Table 1 and {wE, wI} = {4, 4}.
- Figure 7.
Depending on total excitatory strength wE, a minimum proportion of the excitatory population must be active for the network to operate in an ISN regime. For a given wE, the network will only operate in an ISN regime if the effective excitatory recurrence is strong enough to lead to excitatory instability (i.e., λE > 1). Dashed line: λE = 1. Parameters: fI = 20%. X: wE = 5.4 as in Figure 4. Prop., Proportion; exc., excitatory; eig., eigenvalue.
- Figure 8.
Paradoxical effects under simulated optogenetic perturbation. A, Responses to perturbation in an ISN regime network indicating the proportion of excitatory neurons that exhibit a paradoxical effect in the net inhibitory input currents as a function of perturbation strength δ and proportion p of inhibitory neurons perturbed. B, C, Relative change in excitatory (B) and stimulated inhibitory (C) neuron activity for the same simulations as in A. We considered that a paradoxical effect was visible when the input currents changed by at least 10% in the appropriate direction. Outlined regions in A–C indicate responses to perturbation where changes in excitatory and inhibitory activity are approximately equal to those reported by Atallah et al. (2012) (see Materials and Methods). *Region where the majority of excitatory neurons are below threshold, leading to failure of excitatory-driven inhibition. Parameters: {wE, wI, hEE, hEI, hIE, hII, NE, NI} = {4, 100, 6.4 × 10⁻³, 0.21, 0.24, 0.99, 4800, 1200}.
- Figure 9.
Fraction of inhibitory interneurons required to evoke a paradoxical effect in networks with multiple inhibitory subclasses. A, Minimum proportion of PV subpopulation needed to be perturbed to evoke the paradoxical effect, as a function of the coupling strength of recurrent connections between excitatory cells (Exc.) and SOM neurons (see Materials and Methods; Eq. 7 in Litwin-Kumar et al., 2016). For very strong Exc.–SOM coupling values, excitatory activity (red) is completely silenced. No paradoxical effect can be observed in this state. For intermediate values of Exc.–SOM coupling, large fractions of PV neurons must be perturbed to evoke a paradoxical effect. B, C, Effect of simultaneously perturbing the PV and SOM (B) or PV, SOM, and VIP (C) subclasses. The same fraction of neurons was perturbed in each inhibitory class.
- Figure 10.
The paradoxical effect in spiking ISNs depends on the proportion of perturbed inhibitory neurons. A, B, Result of perturbing 10% (A) and 75% (B) of the inhibitory population in a spiking network model by reducing input to inhibitory neurons. Top, Single-trial spike rasters from the entire population. Bottom, Averaged firing rates over 10 trials (smoothed by a boxcar filter of 100 ms width). Black bar is the perturbation period (cf. Fig. 3). Red are excitatory (Exc.) neurons; black are perturbed inhibitory neurons (Inh. pert.); cyan are nonperturbed inhibitory neurons (Inh. non-pert.). Parameters for this network: {NE, NI, Be, Bi} = {1600, 400, 0.1 nS, 0.2 nS}. For other parameters, see Materials and Methods and Table 3. C, Mean (dots) and SD (shading) of the differential rates under a range of perturbed proportions for the network shown in A and B. Cross and dashed line in C is the inferred minimum fraction of perturbed inhibition p/NI required to obtain the paradoxical effect (for details, see Materials and Methods). D, Minimum fraction p/NI for spiking networks while varying Be and Bi (cf. Fig. 4). Dashed line in D: border of the ISN regime according to a simplified linear analysis of the network (see Materials and Methods). †Non-ISN regime; ‡unstable regime (firing rates >100 Hz).


Tables
Parameter Value Reference(s) Axonal width 4σEa, 4σIa% 1200 μm, 300 μm Holmgren et al., 2003; Boucsein et al., 2011; Levy and Reyes, 2012 Dendritic width 4σEd, 4σId% 300 μm, 300 μm Hellwig, 2000 No. of axonal synapses in L2/3 SE, SI 8142, 8566 Binzegger et al., 2004a Density of neurons spanning depth of L2/3 η 36,000 mm−2 Schüz and Palm, 1989 Proportion of neurons in class A fE, fI 80%, 20% Gabbott and Somogyi, 1986 Proportion of A → B synapses rE,I 45% Bock et al., 2011; Bopp et al., 2014 rE,E 1 − rE,I —b rI,E 1 − fI —b rI,I fI —b Parameter Value Membrane capacitance C 120 pf Leak conductance GL 7.14 nS Resting potential EL −70 mV Threshold voltage VT −50 mV Reset voltage Vreset −60 mV Reversal potential Ee, Ei 0 mV, −75 mV Synaptic time constant τe, τi 1 ms Slope factor ΔT 2 ms Refractory period tref 2 ms Parameter Value No. of neurons NE, NI 1600, 400 Connection probability CE→E, CE→I, CI→E, CI→I 15%, 15%, 100%, 100% Baseline input rb 9.6 kHz Strength of baseline input Bb 0.1 nS Average synaptic delay d 0.1 ms Simulation time (transient, baseline, perturbation) Ttrans, Tbase, Tpert 0.15 s, 0.5 s, 0.5 s No. of trials Ntrial 5 (Fig. 10D) or 10 (Fig. 10A–C) Strength of input perturbation δ 0.4 kHz


