
Abstract
Toll-like receptor 4 (TLR4) is a critical component of innate immune signaling and has been implicated in alcohol responses in preclinical and clinical models. Members of the Integrative Neuroscience Initiative on Alcoholism (INIA-Neuroimmune) consortium tested the hypothesis that TLR4 mediates excessive ethanol drinking using the following models: (1) Tlr4 knock-out (KO) rats, (2) selective knockdown of Tlr4 mRNA in mouse nucleus accumbens (NAc), and (3) injection of the TLR4 antagonist (+)-naloxone in mice. Lipopolysaccharide (LPS) decreased food/water intake and body weight in ethanol-naive and ethanol-trained wild-type (WT), but not Tlr4 KO rats. There were no consistent genotypic differences in two-bottle choice chronic ethanol intake or operant self-administration in rats before or after dependence. In mice, (+)-naloxone did not decrease drinking-in-the-dark and only modestly inhibited dependence-driven consumption at the highest dose. Tlr4 knockdown in mouse NAc did not decrease drinking in the two-bottle choice continuous or intermittent access tests. However, the latency to ethanol-induced loss of righting reflex increased and the duration decreased in KO versus WT rats. In rat central amygdala neurons, deletion of Tlr4 altered GABAA receptor function, but not GABA release. Although there were no genotype differences in acute ethanol effects before or after chronic intermittent ethanol exposure, genotype differences were observed after LPS exposure. Using different species and sexes, different methods to inhibit TLR4 signaling, and different ethanol consumption tests, our comprehensive studies indicate that TLR4 may play a role in ethanol-induced sedation and GABAA receptor function, but does not regulate excessive drinking directly and would not be an effective therapeutic target.
SIGNIFICANCE STATEMENT Toll-like receptor 4 (TLR4) is a key mediator of innate immune signaling and has been implicated in alcohol responses in animal models and human alcoholics. Members of the Integrative Neuroscience Initiative on Alcoholism (INIA-Neuroimmune) consortium participated in the first comprehensive study across multiple laboratories to test the hypothesis that TLR4 regulates excessive alcohol consumption in different species and different models of chronic, dependence-driven, and binge-like drinking. Although TLR4 was not a critical determinant of excessive drinking, it was important in the acute sedative effects of alcohol. Current research efforts are directed at determining which neuroimmune pathways mediate excessive alcohol drinking and these findings will help to prioritize relevant pathways and potential therapeutic targets.
- (+)-naloxone
- chronic intermittent ethanol vapor
- drinking-in-the-dark
- lipopolysaccharide
- operant self-administration
- Toll-like receptor 4 knock-out
Introduction
Gene expression studies have shown strong representation of immune- and inflammatory-related genes in brains from human alcoholics and rodents after chronic alcohol treatment (Liu et al., 2006; Robinson et al., 2014; Crews and Vetreno, 2016). Deletion of immune genes reduced alcohol consumption in mice and provided corroborating behavioral validation for several immune mediators that were predicted by the genomic studies (Blednov et al., 2012; Mayfield et al., 2013). In addition, alcohol craving and consumption were positively correlated with elevated plasma levels of inflammatory cytokines in human alcoholics (Leclercq et al., 2012; Leclercq et al., 2014) and immune marker expression in human postmortem brain was correlated with total lifetime alcohol consumption and age of drinking onset (Crews and Vetreno, 2016).
Current research efforts are focused on determining which neuroimmune/inflammatory pathways are important for mediating excessive alcohol drinking. The family of Toll-like receptors (TLRs), in particular TLR4, is a major component of innate immune signaling and has been hypothesized to mediate inflammatory effects of alcohol in the brain (Alfonso-Loeches et al., 2010; Szabo and Lippai, 2014; Alfonso-Loeches et al., 2016). TLR4 activation is triggered through pathogen-derived ligands, such as the bacterial endotoxin lipopolysaccharide (LPS) and endogenous ligands including high mobility group box 1 protein (Vezzani et al., 2011). Acute ethanol exposure activates TLR4 signaling in brain astrocytes and microglia (Blanco et al., 2005; Fernandez-Lizarbe et al., 2013) and chronic ethanol also triggers TLR4-mediated neuroimmune responses (Lippai et al., 2013; Pascual et al., 2015; Alfonso-Loeches et al., 2016).
Some studies have suggested a role for TLR4 in ethanol drinking, although this has not been observed consistently. Systemic injection of LPS (a primary TLR4 ligand) increased voluntary ethanol consumption in mice (Blednov et al., 2011) and elevated plasma levels of LPS, along with increased intestinal permeability, were measured in human alcoholics (Leclercq et al., 2012). Selective knockdown of TLR4 in the CeA or the ventral tegmental area (VTA) (but not the ventral pallidum, VP) decreased binge drinking in alcohol-preferring (P) rats (Liu et al., 2011; June et al., 2015). Although TLR4 deficiency protected against ethanol-induced glial activation and induction of inflammatory mediators, Tlr4 knock-out (KO) mice did not differ from wild-type (WT) mice in chronic ethanol consumption (Alfonso-Loeches et al., 2010; Pascual et al., 2011). The TLR4 antagonist T5342126 decreased drinking and the density of a microglial protein in the CeA in ethanol-dependent and nondependent mice, but the decreased drinking was apparently due to nonspecific effects (Bajo et al., 2016). Overall, there is strong evidence for activation of TLR4 and other neuroimmune mediators in chronic ethanol exposure, but a direct causal link between TLR4 and alcohol drinking behavior has not been shown.
Members of the Integrative Neuroscience Initiative on Alcoholism (INIA-Neuroimmune) consortium (http://www.inia-west.org/) participated in extensive multidisciplinary studies to test the hypothesis that TLR4 is directly involved in ethanol drinking and other ethanol-related responses. TLR4 signaling was inhibited using the following: (1) null mutant rats lacking the Tlr4 gene, (2) selective knockdown of Tlr4 mRNA in the nucleus accumbens (NAc) of mice using Cre recombinase-mediated Tlr4 gene excision, and (3) injection of the selective TLR4 antagonist (+)-naloxone in C57BL/6J mice. None of these approaches provided consistent evidence that TLR4 regulates ethanol intake in any drinking test in mice or rats. However, there was evidence that TLR4 mediates the acute sedative effects of ethanol. Electrophysiological studies revealed that genetic deletion of Tlr4 did not alter spontaneous GABA release in rat CeA neurons, but altered the kinetics of GABAA receptor-mediated IPSCs.
Materials and Methods
Animals
Rats.
A rat line on a Wistar background harboring a nonfunctional Tlr4 gene was produced using transcription activator-like effector nuclease mediated mutagenesis as described previously (Ferguson et al., 2013). This line carries a 13-base pair frame shift mutation in Tlr4 Exon 1 and has a dramatically attenuated response to LPS challenge (Ferguson et al., 2013). Heterozygous breeding pairs were produced at the University of Pittsburgh (Pittsburgh, PA) and shipped to The Scripps Research Institute (La Jolla, CA) and the Indiana University School of Medicine (Indianapolis). WT control and homozygous KO (Tlr4−/−) littermates produced from these heterozygous pairs were used at the respective institutions. Offspring were weaned at ∼21 d of age and genotyped as described previously (Ferguson et al., 2013).
Mice.
Male 12-week-old C57BL/6J mice (The Jackson Laboratory) were used to investigate the effects of (+)-naloxone on ethanol drinking. Mice were housed in groups of four before the drinking tests. Lights were on a reverse 12 h light/12 h dark cycle (lights on at 8:00 P.M.). These studies were conducted at The Scripps Research Institute.
Adult male mice with a floxed Tlr4 gene (i.e., mice with Tlr4 flanked by LoxP sites, denoted as Tlr4F/F) were generated on a C57BL/6 background as described previously (Sodhi et al., 2012) and used for knockdown studies in the NAc. Original breeders were produced at the University of Pittsburgh and mating pairs were shipped to The University of Texas at Austin. Mice were group-housed 4–5 to a cage on a 12 h light/12 h dark cycle (lights on at 7:00 A.M.). Ethanol consumption tests began when the mice were at least 2 months old.
Rats and mice at the different institutions were housed in temperature- and humidity-controlled vivaria with water and food provided ad libitum. All vivaria are approved by the Association for Assessment and Accreditation of Laboratory Animal Care. All procedures adhered to the National Institutes of Health's Guide for the Care and Use of Laboratory Animals and were approved by the institutional animal care and use committees at each site.
LPS injections
Ethanol-naive adult male Tlr4 KO and WT rats (n = 4 per genotype) weighing 479–604 g at the beginning of the experiment were housed individually on a 12 h light/12 h dark cycle (lights on at 6:00 A.M.). Baseline body weight and food and water consumption were measured 24 h before LPS injection. Rats were injected intraperitoneally with 1 mg/kg LPS (L3024, Escherichia coli 0111:B4; Sigma-Aldrich) dissolved in saline 30 min before the start of the dark cycle. Immediately before injection and subsequently every 12 h for 7 d, body weight and food and water intake were measured. Seven to 10 d after a single LPS injection, in vitro electrophysiological experiments were performed to assess the acute ethanol effects on CeA GABAergic transmission.
For LPS effects on operant ethanol self-administration, adult male Tlr4 KO and WT rats (n = 5 per genotype) weighing 350–375 g at the beginning of the experiment were housed in groups of two per cage in a temperature-controlled (22°C) vivarium on a 12 h light/12 h reversed dark-light cycle (lights on at 10:00 P.M.). After completing operant ethanol self-administration training (described below), the rats were housed individually, injected with LPS (1 mg/kg, i.p.), and body weight and food/water intake were recorded daily. Ethanol and water self-administration testing were performed in 30 min sessions for 14 consecutive days followed by a second LPS injection and 14 more days of testing. Baseline body weight and food and water consumption were measured 24 h before the first LPS injection.
LPS data are presented as the mean ± SEM intake in 24 h (food, water) or the percentage change relative to preinjection baseline (body weight). Raw data (intake or body weight change, in grams, over a 24 h period) were analyzed using two-way repeated-measures ANOVA with group (Tlr4 KO vs WT) as the between-subjects factor and days since LPS injection as the within-subjects factor. Bonferroni and Newman–Keuls tests were used for post hoc analyses.
Ethanol intake tests in rats
Two-bottle choice (2BC).
Rats were double-housed by sex and genotype (Tlr4 KO vs WT). Lights were on a reverse 12 h light/12 h dark cycle (lights on at 10:30 P.M.). On postnatal day 85, male and female rats were transferred from their home cages and singly housed in hanging stainless steel wire-mesh cages for habituation to this environment. Male and female littermate offspring of each genotype were tested using the 2BC ethanol consumption test beginning on postnatal day 90. Rats were given ad libitum choice access to 10% ethanol (v/v) and water for 5 weeks. Ethanol (grams per kilogram body weight) and water (milliliters per kilogram body weight) consumption were assessed 5 d/week and body weight (kilograms) was measured 3 d/week. Ethanol intake was converted to grams of absolute (i.e., corrected for specific gravity) ethanol consumed/kilogram of body weight/day. Due to daily fluctuations in ethanol consumption in all groups, the data for each day were averaged across each week of access. The weekly data were submitted to a 3 × 2 × 5 (genotype by sex by week) mixed-model ANOVA, with genotype and sex as the between-subjects factors and week as the within-subjects factor.
Operant self-administration.
Adult male Tlr4 KO (n = 12) and WT (n = 13) rats weighing 250–350 g at the beginning of the experiment were housed in groups of two per cage in a temperature-controlled (22°C) room on a reverse 12 h light/12 h dark cycle and the behavioral tests were conducted during the dark phase of the circadian cycle. Self-administration sessions were conducted in standard operant conditioning chambers (Med Associates). Animals were first trained to self-administer 10% ethanol (w/v) and water solutions until stable responses were maintained. The rats were subjected to an overnight session in the operant chambers with access to 1 lever (right lever) that delivered water [fixed ratio 1 (FR1) schedule of reinforcement, i.e., each operant response was reinforced with 0.1 ml of the solution]. Food was available ad libitum during training. After 1 d off, the rats were subjected to a 2 h session (FR1) for 1 d and a 1 h session (FR1) the next day, with 1 lever delivering ethanol (right lever). All of the subsequent sessions lasted 30 min and 2 levers were available (left lever: water; right lever: ethanol) until stable levels of intake were reached. Upon completion of this procedure, the animals were allowed to self-administer 10% (w/v) ethanol and water (FR1). Self-administration was analyzed by two-way repeated-measures ANOVA with group as the between-subjects factor and session as the within-subjects factor.
Chronic intermittent ethanol (CIE).
Rats were made dependent by chronic, intermittent exposure to ethanol vapor for 5–7 weeks as described previously (O'Dell et al., 2004; Gilpin et al., 2008). They underwent cycles of 14 h on [blood ethanol concentrations (BECs) during vapor exposure ranged between 150 and 250 mg%] and 10 h off, during which behavioral testing for acute withdrawal and operant self-administration (see below) occurred (i.e., 6–8 h after vapor was turned off when brain and BECs are negligible; Gilpin et al., 2009). In this model, rats exhibit somatic withdrawal signs and negative emotional symptoms reflected by anxiety-like responses and elevated brain reward thresholds (Schulteis et al., 1995; Roberts et al., 2000; Valdez et al., 2002; Rimondini et al., 2003; O'Dell et al., 2004; Sommer et al., 2007; Zhao et al., 2007; Edwards et al., 2012; Vendruscolo and Roberts, 2014). For the electrophysiology experiments, the rats were kept in the vapor chambers until they were killed.
Operant self-administration during CIE vapor exposure.
Behavioral testing occurred three times per week. The rats were tested for 10% ethanol (and water) self-administration on an FR1 schedule of reinforcement in 30 min sessions. Operant self-administration on an FR1 schedule requires minimal effort by the animal to obtain the reinforcement and herein was considered a measure of intake. Ethanol self-administration data were analyzed by two-way repeated-measures ANOVA with group (Tlr4 KO vs WT) as the between-subjects factor and session as the within-subjects factor. Because the same rats were used to measure predependent versus dependent ethanol self-administration, the number of lever presses for ethanol (last six sessions before ethanol vapor exposure) were averaged and compared with the average lever presses across six self-administration sessions during ethanol vapor exposure. Data were analyzed using two-way mixed models ANOVA with group as the between-subjects factor and time (predependent vs dependent) as the within-subjects factor.
Ethanol intake tests in mice
Drinking-in-the-dark (DID).
The DID procedure is a binge-like drinking model, which capitalizes on the circadian rhythm in drinking and uses a discrete time of exposure to ethanol to optimize pharmacologically significant ethanol drinking (Rhodes et al., 2005; Rhodes et al., 2007; Thiele et al., 2014). Three factors are important in this model: (1) providing access to ethanol a few hours into the dark cycle, (2) not allowing access to water when ethanol is offered, and (3) using genetically predisposed mice. BECs in C57BL/6J mice in this model are reliably >100 mg% after the final drinking period and motor impairments are detected using the accelerating rotarod and balance beam tests (Rhodes et al., 2005, 2007). C57BL/6J mice were individually housed 1 week before testing. On day 1, starting 3 h after lights off (11:00 A.M.), water bottles were replaced with drinking tubes containing 20% ethanol in tap water for 2 h. On day 4, the ethanol bottles remained for 4 h, with intakes recorded after both 2 and 4 h. Immediately after removal of the ethanol bottles, tail blood was sampled to measure BEC. On day 4, mice were injected with (+)-naloxone (0, 30, or 60 mg/kg; n = 8 per group) 30 min before the drinking session began (10:30 A.M.) to investigate its acute effects. The following week, saline or 60 mg/kg (+)-naloxone (n = 8 per group) was injected on all 4 d of DID testing 30 min before the drinking sessions to examine subchronic effects. (+)-Naloxone was synthesized by E.R. and freshly dissolved in saline and administered intraperitoneally at 0.01 ml/g body weight. The μ-opioid inactive stereoisomer, (+)-naloxone, is a selective TLR4 inhibitor (Hutchinson et al., 2008; Wang et al., 2016). Data were analyzed separately at the 2 and 4 h time points using one-way ANOVA with (+)-naloxone dose as the between-subjects factor.
CIE-2BC.
In the CIE-2BC model, excessive ethanol consumption is observed after 2BC limited-access periods are cycled with chronic passive exposure to ethanol vapor in rats (Vendruscolo and Roberts, 2014) or C57BL/6J mice (Becker and Lopez, 2004; Finn et al., 2007; Griffin et al., 2009). This has been used to model the motivational aspects of alcohol dependence and the excessive drinking associated with the addicted state. For 15 d (5 d per week for 3 weeks), 30 min before the lights turn off (7:30 A.M.), C57BL/6J mice were individually housed for 2 h with access to 2 drinking tubes containing either 15% ethanol or water. Ethanol and water consumption during these 2 h periods were recorded. After this baseline period, mice were divided, based on equal ethanol and water consumptions, into two balanced groups to be exposed to CIE or air in identical vapor chambers. After baseline 2BC drinking, the CIE group was injected with 1.75 g/kg ethanol plus 68 mg/kg pyrazole (alcohol dehydrogenase inhibitor) and placed in the chambers to receive intermittent vapor for 4 d (vapor on for 16 h and off for 8 h). After each 16 h period of vapor, mice were removed and, on the second and fourth days, tail blood was sampled to determine BEC. Target BECs were 175–250 mg%. After the fourth day of exposure, mice were allowed 72 h of undisturbed time and were then given 5 d of 2 h access to bottles containing 15% ethanol and water to measure ethanol drinking and preference after vapor exposure. The control group was injected with 68 mg/kg pyrazole in saline and placed in chambers delivering air for the same periods as the CIE group and received 2BC testing at the same time as the ethanol vapor group. The vapor/air exposure and 5 d of 2BC testing were repeated for a total of 4 rounds of vapor and 2BC testing before (+)-naloxone testing. For the first study, 30 mice (n = 15 per group) were administered (+)-naloxone (0, 3, 10, 30, 60 mg/kg) in a within-subjects manner 30 min before 2BC testing (7:00 A.M.). Drug injections were given every 3–4 d. For the second study, 20 mice were used in a between-subject design (n = 4–6 in 4 groups: control-vehicle, control-60 mg/kg (+)-naloxone, CIE-vehicle, CIE-60 mg/kg (+)-naloxone). Mice were injected 30 min before the 2BC procedure across 4 d of testing. Data from the first study were analyzed by two-way repeated-measures ANOVA (group as the between factor; dose as the within factor) and data from the second study were analyzed by three-way repeated-measures ANOVA (group and dose as the between factors; day as the within factor). Significant effects were further investigated using Fisher's protected (P)LSD tests.
2BC (24 h continuous access).
Four weeks after lentiviral Cre-recombinase injections in the NAc to knock down Tlr4 selectively (see below), a 2BC protocol was performed as described previously (Blednov et al., 2003). Tlr4F/F male mice were allowed to acclimate for 1 week to individual housing. Two drinking bottles (containing water and ethanol) were available continuously to each mouse and bottles were weighed daily. Bottle positions were changed daily to control for position preferences. Mice were weighed every 4 d. After 4 d of water consumption (both bottles contained water), mice were offered 3% ethanol (v/v) versus water for 4 d. The amount of ethanol consumed (g/kg body weight per 24 h) was calculated for each mouse and these values were averaged for every concentration of ethanol. Immediately after 3% ethanol, a choice between 6% ethanol and water was offered for 2 d, followed by 8%, 10%, 12%, 14%, and finally 16% (v/v) ethanol (each concentration was offered for 4 d). Throughout the experiment, evaporation/spillage estimates were calculated daily using two bottles (containing water or the appropriate ethanol solution) placed in an empty cage. Data were analyzed by two-way repeated-measures ANOVA followed by Bonferroni post hoc tests.
2BC (24 h intermittent access).
Intermittent (every other day) access to ethanol increases voluntary ethanol consumption in mice (Melendez, 2011). This drinking paradigm was tested in a different group of Tlr4F/F male mice 4 weeks after lentivirus injections in the NAc. Mice were given access to a bottle of 15% (v/v) ethanol and a bottle of water during 24 h sessions every other day. The placement of the ethanol bottles was alternated with each drinking session to control for side preferences. The quantity of ethanol consumed was calculated as grams per kilogram body weight per 24 h. Evaporation/spillage estimates were calculated daily from two bottles (containing water or 15% ethanol solution) placed in an empty cage. Data were analyzed by two-way repeated-measures ANOVA followed by Bonferroni post hoc tests.
Acute behavioral effects
Ethanol-induced loss of righting reflex (LORR).
Adult male Tlr4 KO and WT rats (n = 10 per genotype) weighing 350–400 g were housed in groups of two per cage. Each rat was handled 5 min/d for 1 week before beginning the experiment. On test day, the rats were injected with 4 g/kg ethanol (20% v/v in saline, i.p.). After injection, the rat was placed in a supine position on a V-shaped platform. The time to LORR (time between the injection and the moment in which the rat is not able to right himself) and the time of LORR (interval between the loss of ability to flip over onto all four limbs when placed in a supine position and the time when this reflex was successfully demonstrated three consecutive times within 60 s) were scored. Data were analyzed using an unpaired t test.
Selective knockdown of TLR4 in mouse NAc
Lentivirus-mediated knockdown of Tlr4.
Tlr4F/F male mice received bilateral injections into the NAc with either a vesicular stomatitis virus (VSV-G) pseudotyped lentivirus expressing Cre recombinase fused to an enhanced green fluorescent protein (EGFP) under the control of a cytomegalovirus (CMV) promoter (LV-Cre-EGFP) or an “empty” VSV-G pseudotyped lentivirus vector expressing only the EGFP transgene under a CMV promoter (LV-EGFP-Empty). Virus was produced as described previously (Lasek et al., 2007). Mice were anesthetized by isoflurane inhalation, placed in a model 1900 stereotaxic apparatus (Kopf Instruments), and administered preoperative analgesic (Rimadyl, 5 mg/kg). The skull was exposed and bregma and lambda visualized with a dissecting microscope. A digitizer attached to the micromanipulator of the stereotaxic apparatus was used to locate coordinates relative to bregma. Burr holes were drilled bilaterally above the injection sites in the skull using a drill equipped with a #75 carbide bit (Kopf Instruments). The injection sites targeted the NAc using the following coordinates relative to bregma: anteroposterior (AP) +1.49 mm, mediolateral (ML) ±0.9 mm, and dorsoventral (DV) −4.8 mm. Injections were performed using a Hamilton 10 μl microsyringe (model 1701) and a 30-gauge needle. The needle tip was lowered to the DV coordinate and retracted 0.2 mm. The viral solution (1.0 μl with titer of ∼3 × 10⁷ pg gag antigen/ml in PBS, PBS) was injected into each site at a rate of 200 nl per min. After each injection, the syringe was left in place for 5 min before being retracted over a period of 3 min. Incisions were closed with tissue adhesive (Vetbond; 3M). Mice were housed individually after surgery and given a 4-week recovery period before starting the ethanol drinking tests. Separate groups of mice were used for each 2BC test.
RNA isolation.
Approximately half of the treated Tlr4F/F mice were killed within 24 h of completing the drinking tests. The brains were quickly removed, flash frozen in liquid nitrogen, and later frozen in optimal cutting temperature medium (VWR) in isopentane on dry ice and stored at −80°C. Brains were transferred to a cryostat set at −6°C for at least 1 h before sectioning. Sections (300 μm) were collected from +1.80 to +0.60 mm (AP) relative to bregma and transferred to glass slides that had been precooled on dry ice. Micropunch sampling was performed on a frozen stage (−25°C) using a dual fluorescent protein flashlight (Nightsea) and the stereotaxic atlas of Paxinos and Franklin (2004) to confirm EGFP expression and the anatomical location of the injection site, respectively. Microdissection punches (Stoelting) with an inner diameter of 0.75 mm were used to obtain samples of NAc core and shell. This inner diameter corresponded to the viral spread around the injection site and minimized contamination from other tissue. Punches were taken bilaterally from four 300 μm sections and stored at −80°C until RNA extraction. All equipment and surfaces involved in the collection of tissue were treated with 100% ethanol and RNaseZap (Life Technologies) to prevent RNA degradation. Total RNA was extracted using the MagMAX-96 for Microarrays Total RNA Isolation Kit (Life Technologies) according to the manufacturer's instructions. Yields and purity were assessed using a NanoDrop 8000 (Thermo Fisher Scientific), and quality of the total RNA preparation was determined using the Agilent 2200 TapeStation.
Quantitative real-time PCR.
To verify Tlr4 mRNA knockdown, single-stranded cDNA was synthesized from total RNA using the TaqMan High Capacity RNA-to-cDNA kit (Life Technologies). After reverse transcription, quantitative real-time PCR (qPCR) was performed in triplicate using TaqMan Gene Expression Assays together with the TaqMan Gene Expression Master Mix (Life Technologies) per the manufacturer's instructions. The TaqMan Gene Expression assays used were Tlr4 (Mm00445273_m1) and enhanced GFP (Mr04097229_mr). Gapdh (Mm99999915_g1) was used as a reference gene and relative mRNA levels were determined using the 2−ΔΔCT method (Schmittgen and Livak, 2008). Gapdh was used as the endogenous control because of its stable expression across samples. Reactions were performed in a CFX384 Real-Time PCR Detection System (Bio-Rad) and data collected using Bio-Rad CFX Manager.
Target site verification.
The other half of the Tlr4F/F-treated mice were killed within 24 h of completing the drinking tests and transcardially perfused with PBS, pH 7.4, followed by 4% paraformaldehyde (PFA). Brains were harvested, postfixed for 24 h in 4% PFA at 4°C, and cryoprotected for 24 h in 20% sucrose in PBS at 4°C. Brains were placed in molds containing optimal cutting temperature compound (VWR) and frozen in isopentane on dry ice. The brains were equilibrated in a −12 to −14°C cryostat (Thermo Fisher Scientific) for at least 1 h and coronal 40 μm sections of the NAc were placed in sterile PBS. Serial sections (40 μm) of NAc (AP +2.00 to 0.00 mm) were mounted on slides with DAPI mounting medium (Vector Laboratories) and visualized using a Zeiss Axiovert 200M Fluorescent Microscope equipped with a 10× objective to assess the location of the injection site. Quality of injection was scored quantitatively based on the strength of EGFP viral expression, injection location relative to target, and the spread of the virus. The injection was considered on target if the virus covered at least one-third of the NAc.
Whole-cell voltage-clamp electrophysiology
Slice preparation.
Male WT and Tlr4 KO rats (used previously for operant self-administration testing) were made ethanol dependent by CIE vapor exposure as described earlier and kept in the vapor chambers until time for electrophysiological studies. BECs were measured once or twice per week by tail bleeding and again before euthanasia. The mean BEC of all ethanol-exposed animals was 173.0 ± 21 mg/dl. Slices were prepared from 14 naive control, CIE WT, and Tlr4 KO rats (425–595 g) as described previously (Gilpin et al., 2011; Cruz et al., 2012). Briefly, rats were anesthetized using 3–5% isoflurane, rapidly decapitated, and the brains placed in ice-cold high-sucrose solution, pH 7.3–7.4, containing the following (in mm): sucrose (206), KCl (2.5), CaCl2 (0.5), MgCl2 (7), NaH2PO4 (1.2), NaHCO3 (26), glucose (5), and HEPES (5). Coronal brain slices (300 μm) were cut on a vibrating microtome (Leica VT1000S) and transferred to an oxygenated (95% O2/5% CO2) artificial CSF (aCSF) solution containing the following (in mm): NaCl (130), KCl (3.5), CaCl2 (2), NaH2PO4 (1.25), MgSO4 (1.5), NaHCO3 (24), and glucose (10). Slices were incubated (30 min; 35–37°C) and then equilibrated at room temperature for 30 min. For each recording, a slice was placed in a recording chamber mounted on the stage of an upright microscope (Olympus BX50WI) and perfused (2–5 ml/min) with continuously oxygenated aCSF at room temperature.
Electrophysiological recording.
Medial subdivision CeA neurons (n = 84) were visualized using infrared differential interference contrast (IR-DIC) optics, a CCD camera (EXi Aqua and ROLERA-XR; QImaging; Gilpin et al., 2011; Cruz et al., 2012) and a w60 or w40 water-immersion objective (Olympus Scientific Solutions). Recordings were performed in a gap-free acquisition mode with a sampling rate per signal of 10 kHz and low-pass filtered at 10 kHz using a Multiclamp 700B amplifier and Digidata 1440A and pClamp 10 software (Molecular Devices). Borosilicate glass patch pipettes (3–6 MΩ) (Warner Instruments) were filled with an internal solution containing the following (in mm): KCl (145), EGTA (5), MgCl2 (5), HEPES (10), Na-ATP (2), and Na-GTP (0.2). Spontaneous IPSCs (sIPSCs) mediated by GABAA receptors were isolated by adding glutamate receptor blockers 6,7-dinitroquinoxaline-2,3-dione (DNQX, 20 μm; Tocris Bioscience) and DL-2-amino-5-phosphonovalerate (AP-5, 30 μm; Tocris Bioscience) and the GABAB receptor antagonist CGP55845A (1 μm; Sigma-Aldrich) directly to the aCSF. GABAergic miniature IPSCs (mIPSCs) were isolated using glutamatergic and GABAB receptor blockers and 0.5 μm tetrodotoxin (Biotum). All drugs were applied by bath superfusion.
Cells were clamped at −60 mV and recordings showing a series resistance >15 MΩ or a >20% change in series resistance, as monitored with a 10 mV pulse, were excluded. s/mIPSC frequency, amplitude, and kinetics were analyzed using semiautomated threshold-based mini detection software (Mini Analysis; Synaptosoft) and inspected visually. Only s/mIPSCs with amplitude >5 pA were accepted for analysis and final averages of s/mIPSC characteristics were derived from a minimum time interval of 2–5 min. GraphPad Prism 5.0 software was used for all statistical analyses. The s/mIPSC data were evaluated with cumulative probability analysis and statistical significance was determined using the Kolmogorov–Smirnov nonparametric two-sample test (Van der Kloot, 1991), with p < 0.05 considered significant. To assess whether differences in ethanol's effects on s/mIPSCs result from the treatment (naive, ethanol-dependent, and LPS-injected) and/or genotype (WT and Tlr4 KO rats), two-way ANOVAs of the normalized values were performed (mean values of s/mIPSC characteristics during ethanol application divided by the baseline values). When appropriate, Bonferroni post hoc tests were used to assess significance between treatments. All data are presented as mean ± SEM and n refers to the number of neurons. One to five neurons were recorded per animal and all electrophysiological measures were obtained by pooling data from at least three animals per experimental group.
Results
Lack of LPS effects in Tlr4 KO rats
Tlr4 KO ethanol-naive rats are resistant to LPS-induced toxicity
We monitored reductions in food intake (anorexia), water intake (adipsia), and body weight as signs of LPS-induced “sickness-like” behavior (McCarthy et al., 1984; Cross-Mellor et al., 2000; van Heesch et al., 2013) in naive and ethanol self-administering Tlr4 KO and WT rats. Baseline measures of body weight or food and water consumption did not differ in KO and WT rats. In naive rats, LPS (1 mg/kg, i.p.) caused a transient reduction of food intake in WT, but not Tlr4 KO rats (Fig. 1A). There were significant main effects of LPS (F(7,42) = 60.7, p < 0.0001) and genotype (F(1,42) = 13.7, p < 0.01) on food intake and an interaction between the factors (F(7,42) = 30.2, p < 0.001). Profound anorexia occurred within 24 h after injection in WT rats, which persisted for at least 48 h (28.1 ± 2.0 g consumed 24 h before LPS vs 1.2 ± 0.8 g after LPS). WT rats gradually increased their food intake, reaching pre-LPS consumption levels by the sixth postinjection day (25.8 ± 3.4 g). In Tlr4 KO rats, LPS caused a transient reduction in food intake (from 27.6 ± 3.7 g to 22.9 ± 3.2 g) after 24 h, followed by increased food intake on the fourth postinjection day (34.2 ± 1.5 g).

Tlr4 KO rats are resistant to LPS-induced toxicity. LPS produced transient reduction of food (A) and water (B) intake in male WT but not Tlr4 KO rats. The data are presented as mean ± SEM food and water intake (in grams) in 24 h periods. Day 0 represents intake measured during the 24 h before LPS (1 mg/kg, i.p.) injection. C, LPS induced a robust weight loss in WT but not Tlr4 KO rats. The data are presented as percentage change relative to preinjection baseline weight (error bars are obscured by the symbols). Data were analyzed by two-way repeated-measures ANOVA followed by Bonferroni post hoc tests; *p < 0.05, **p < 0.01, ***p < 0.001 compared with baseline; n = 4 per genotype. Arrows indicate injection of LPS (1 mg/kg, i.p.).
LPS reduced water intake in WT rats only (Fig. 1B); this effect peaked on the second postinjection day, with drinking levels returning to baseline by the fourth postinjection day. There were main effects of LPS on water intake (F(7,42) = 7.1, p < 0.001) and a significant interaction between LPS and genotype (F(7,42) = 4.8, p < 0.001), but the main effect of genotype did not reach significance (p = 0.05). Reductions in food and water intake in WT rats were accompanied by significant weight loss, a pattern not observed in KO rats. LPS produced weight loss in WT rats during the first 3 postinjection days, reaching a peak loss of 10% body weight (Fig. 1C) (main effects of LPS (F(7,42) = 88.2, p < 0.001) and genotype (F(7,42) = 79.6, p < 0.001) and an interaction between the factors (F(7,42) = 73.6, p < 0.001). Body weight then stabilized and the resumption of food intake was associated with the reappearance of normal diurnal fluctuations in body weight when measured every 12 h, similar to Tlr4 KO rats (data not shown). Although a slight reduction in body weight was also observed in the 24–48 h after LPS injection in Tlr4 KO rats, its magnitude was <25% of that observed in WT (∼2.5% absolute weight loss). The resistance of Tlr4 KO rats to LPS-induced “sickness-like behavior” provides behavioral and functional validation that the Tlr4 gene had been deleted.
Tlr4 KO rats trained to self-administer ethanol are resistant to LPS-induced toxicity
Similar to naive rats, there were no significant differences in baseline body weight or water and food intake in the WT and Tlr4 KO rats trained to self-administer 10% ethanol. LPS injections (14 d apart) significantly (p < 0.001) reduced food intake in WT but not KO ethanol-trained rats (Fig. 2A). Two-way repeated-measures ANOVA showed main effects of LPS (F(4,32) 63.9, p < 0.001) and genotype (F(1,32) = 8.4, p < 0.05) on food intake, as well as an interaction between the factors (F(4,32) = 43.8, p < 0.001). Although water intake was reduced after both LPS injections in WT rats, the intake over the 4 d period after LPS was reduced significantly only after the first injection (Fig. 2B), suggesting the development of tolerance to its effects. There were no effects of LPS injections on water intake in Tlr4 KO rats. There were main effects of LPS on water consumption (F(4,32) = 5.1, p < 0.001) and an interaction between LPS and genotype (F(4,32) = 4.0, p < 0.001) without a main effect of genotype.

Tlr4 KO rats trained to self-administer ethanol (10%) are resistant to LPS-induced toxicity. The data are presented as mean ± SEM of food (A) and water (B) intake in 24 h in male WT (n = 5) and Tlr4 KO (n = 5) rats. Day 0 corresponds to intake for the 24 h before LPS (1 mg/kg, i.p.) injection. C, Time course of the change in body weight over 24 h in male rats. The data are presented as the percentage change relative to the preinjection baseline weight measured before the first LPS injection. D, Time course of the change in body weight of LPS-treated WT and KO rats after the first and second LPS injections. LPS-induced changes in body weight are expressed as the percentage change relative to the most recent preinjection weight. In WT rats, paired Student's t test (t(4) = 6.0, p < 0.01) showed a significant decrease in loss of body weight 1–4 d after the second LPS injection (−3.4 ± 0.5%) compared with the weight loss after the first LPS injection (−7.1 ± 0.7%). There was no significant difference in the LPS effects between the first and second LPS injections in the Tlr4 KO rats. Arrows indicate injection of LPS (1 mg/kg, i.p.).
In WT rats, two LPS injections induced a significant loss in body weight measured over a 4 d period after each injection (Fig. 2C). Two-way repeated-measures ANOVA showed main effects of LPS (F(4,32) = 35.8, p < 0.001) and genotype (F(1,32) = 68.4, p < 0.001) and an interaction between the factors (F(4,36) = 17.1, p < 0.001). LPS injections had no effect on the body weight of Tlr4 KO rats (Fig. 2C). Because there was not a full recovery in body weight after the first LPS injection in WT rats, we calculated LPS-induced loss in body weight by comparing the weight during days 1–4 after injection to the weight at the time of the most recent injection. The second LPS injection induced a significantly (p < 0.05) less pronounced reduction of body weight (−3.4 ± 0.5% after the second LPS injection vs −7.1 ± 0.7% after the first injection) and faster recovery in WT rats (Fig. 2D), suggesting the development of tolerance to its effects.
LPS induces a transient reduction in ethanol self-administration in WT, but not Tlr4 KO rats
At the end of self-administration training, the baseline lever presses for 10% ethanol were 19.8 ± 6.6 for WT and 13.3 ± 4.1 for KO rats. LPS (1 mg/kg, i.p.) was injected 30 min before the next session and rats were tested for ethanol and water self-administration in 30 min sessions for 14 consecutive days, followed by a second LPS injection and 14 more days of testing. Data after both LPS injections were averaged. A mixed-factorial ANOVA with genotype (Tlr4 KO vs WT) as the between-subjects factor and time point (baseline, 1–4 d post-LPS, and 5–14 d post-LPS) as the within-subjects factor showed a significant effect of time point (F(1,8) = 7.5; p < 0.01) and genotype × time point interaction (F(2,8) = 5.6; p < 0.05). A Newman–Keuls post hoc test showed that LPS treatment reduced operant responding for ethanol in the WT group (p < 0.05) for 4 consecutive days after the injections (Fig. 3A). No genotype differences were found 5–14 d after LPS injections. A mixed-factorial ANOVA of the water self-administration data showed a significant effect of time point (F(1,8) = 7.5; p < 0.01), but no difference in the genotype × time point interaction (Fig. 3B).

LPS induces transient reduction in ethanol (10%) self-administration in WT but not Tlr4 KO rats. Effect of LPS injections on ethanol (A) and water (B) self-administration in male WT and Tlr4 KO rats. The data are presented as mean ± SEM lever presses during 30 min sessions. Baseline (BL) was calculated as the average of the last 4 sessions before each LPS injection. Rats were given two LPS (1 mg/kg, i.p.) injections 14 d apart and the data from both injections were averaged. The average lever presses 1–4 d and 5–12 d after LPS are shown. Data were analyzed by mixed-factorial ANOVA followed by Newman–Keuls post hoc test; *p < 0.05 compared with KO; n = 5 per genotype.
Lack of evidence for a role of TLR4 in ethanol consumption
No genotype differences in ethanol self-administration by WT or Tlr4 KO rats before or after dependence
Although there was no significant genotype effect on baseline responses in the ethanol self-administration test above, we compared operant responding before and after ethanol dependence specifically in both genotypes. Figure 4A shows ethanol self-administration in WT and Tlr4 KO rats before ethanol vapor exposure (predependence). Operant self-administration of 10% ethanol varied over time (session effect: F(11,143) = 3.3, p < 0.0005), but there were no genotype or genotype × time differences. After CIE vapor exposure (after dependence), there were also no differences in self-administration, with both WT and Tlr4 KO rats showing similar increases in intake (F(1,13) = 12.3, p < 0.005; Fig. 4B).
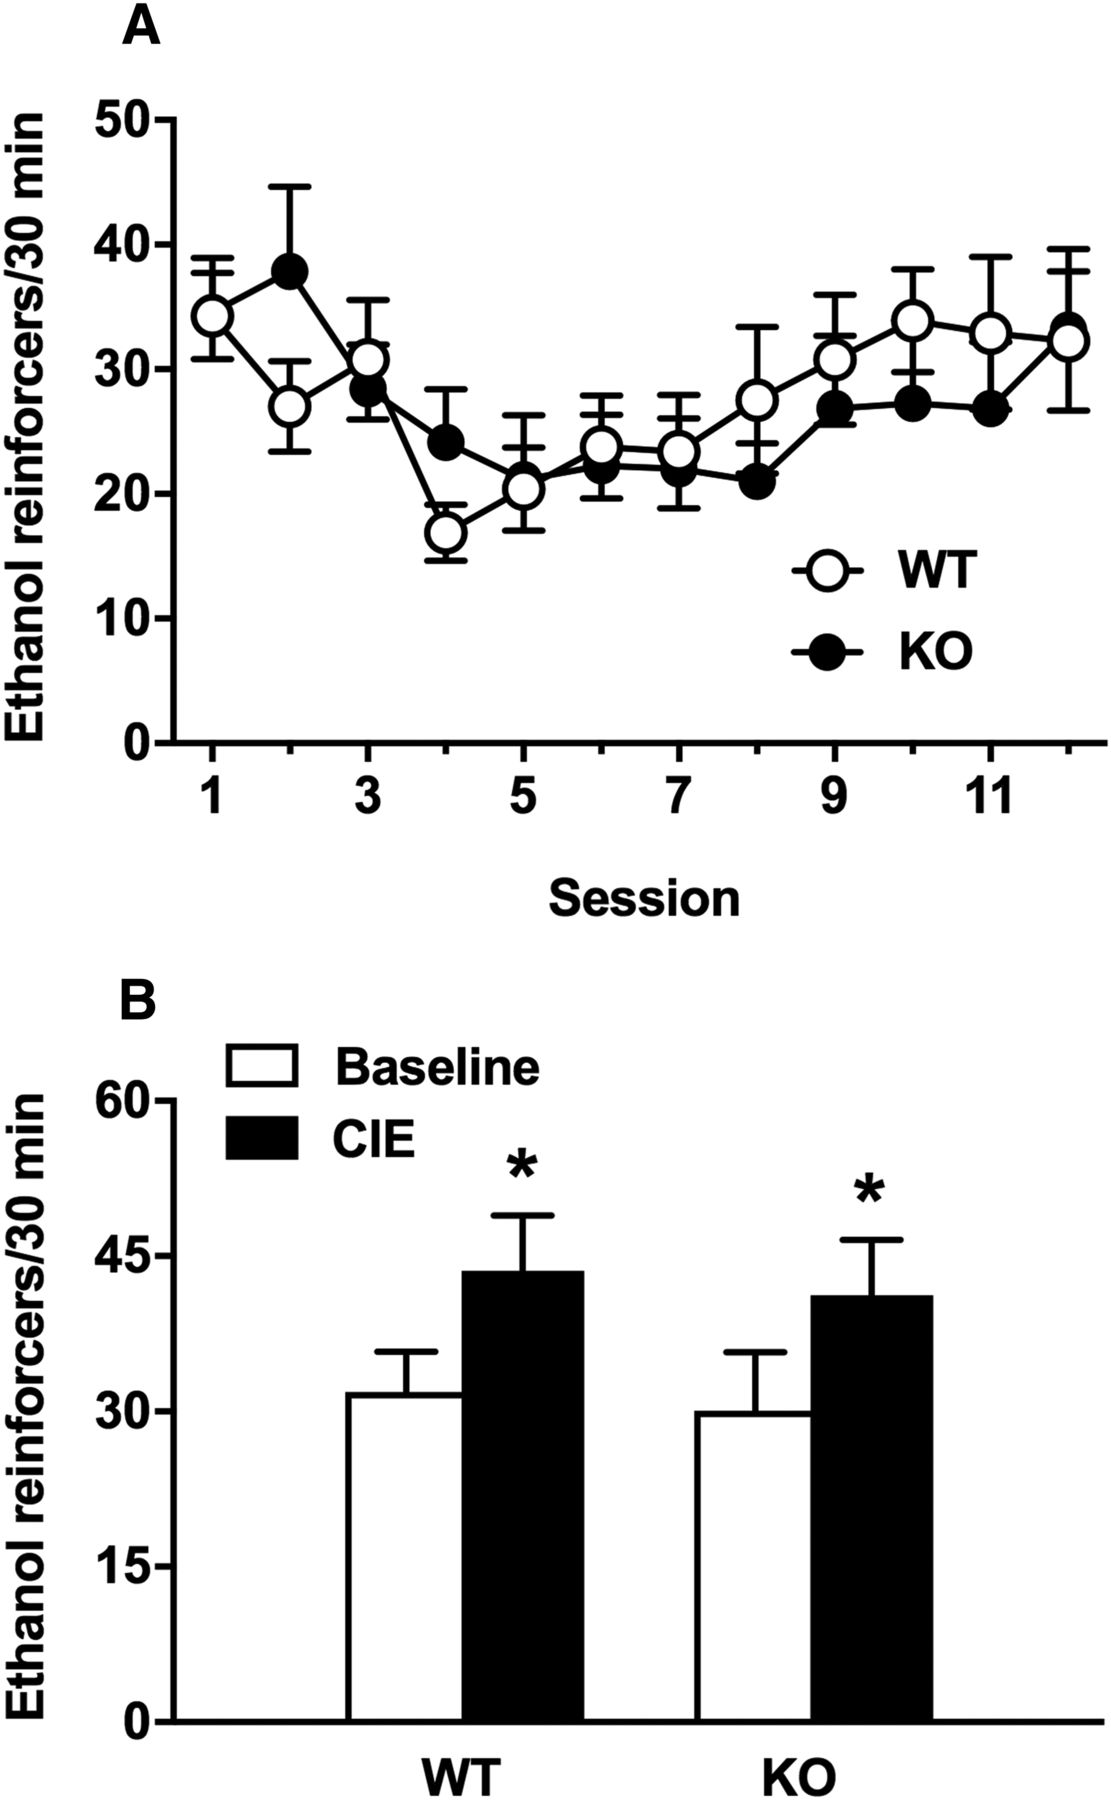
There was no effect of genotype on ethanol self-administration in WT or Tlr4 KO rats before or after dependence. A, Male WT and Tlr4 KO rats do not differ in ethanol (10%) self-administration before ethanol vapor exposure. The data are presented as mean ± SEM lever presses during 30 min sessions. Data were analyzed by two-way repeated-measures ANOVA with group as the between-subjects factor and session as the within-subjects factor. B, Male WT and Tlr4 KO rats do not differ in ethanol (10%) self-administration after CIE exposure. Ethanol-dependent rats underwent cycles of 14 h on (BEC: 146.8 ± 3.6 mg%) and 10 h off. The same rats were used to measure predependent versus postdependent ethanol self-administration. For baseline, the number of lever presses for ethanol (last six sessions before ethanol vapor exposure) was averaged and compared with the average number of lever presses over six self-administration sessions during CIE exposure. The data are presented as mean ± SEM lever presses during 30 min sessions. Data were analyzed using two-way ANOVA with group as the between-subjects factor and time (predependent vs dependent) as the within-subjects factor (n = 8 for WT and n = 7 for KO, *p < 0.05 compared with baseline).
2BC ethanol intake in male and female WT vs Tlr4 KO rats
We then compared sexes and genotypes in a 2BC chronic drinking paradigm (WT: males, n = 23; females, n = 16; Tlr4 KO: males, n = 15; females, n = 11). The omnibus mixed ANOVA of the ethanol-drinking data revealed a marginally significant 3-way (genotype × sex × week) interaction for 10% ethanol (v/v) intake (F(4,244) = 2.4, p = 0.05). There was a significant two-way (sex × week) interaction (F(4,244) = 3.3, p = 0.01) and a marginally significant main effect of sex (F(1,61) = 4.0, p = 0.05). As seen in Figure 5A, female rats drank more ethanol initially than male rats. This effect was observed for the Tlr4 KO rats only during the first week of ethanol access (F(1,25) = 11.7, p < 0.01), whereas the WT rats displayed this effect across the first 3 weeks of ethanol access (F(1,38) > 4.5, p < 0.05). There were also changes in ethanol intake across weeks; specifically, WT male rats displayed significant (p < 0.05) increases between week 1 versus week 4 and week 1 versus week 5, whereas Tlr4 KO male rats displayed significant (p < 0.05) increases between week 1 versus week 2 and week 1 versus week 5. There was a significant decrease in ethanol intake by female Tlr4 KO rats between weeks 1 and 2. The omnibus mixed ANOVA of the water-drinking data revealed a significant two-way (sex × week) interaction (F(4,244) = 8.5, p < 0.001) and a significant main effect of week (F(4,244) = 6.7, p < 0.001). As shown in Figure 5B, male rats initially drank more water than females, with the effect reaching significance (p < 0.05) in the WT, but not Tlr4 KO, rats during week 1. In addition, a modest but significant (p < 0.05) increase across weeks was observed in both the female Tlr4 KO (week 1 vs week 4 and week 1 vs week 5) and WT (week 1 vs week 3, week 1 vs week 4, and week 1 vs week 5) rats. The omnibus mixed ANOVA of the ethanol preference data revealed a significant two-way (sex × week) interaction (F(4,244) = 12.6, p < 0.001) and significant main effects of week (F(4,244) = 2.9, p < 0.05) and sex (F(1,61) = 22.4, p < 0.001). However, the main effect of genotype regarding ethanol preference did not reach significance (p = 0.06). Female WT and KO rats displayed decreased ethanol preference across weeks 4–5 and 3–5, respectively, compared with the first week (Fig. 5C). The omnibus mixed ANOVA of the body weight data revealed a significant two-way (sex × week) interaction (F(4,244) = 8.5, p < 0.001), along with significant main effects of week (F(4,244) = 6.7, p < 0.001) and sex (F(1,61) = 505.5, p < 0.001). As seen in Figure 5D, female rats weighed significantly less than male rats, with no differences observed for genotype.

2BC ethanol intake in male and female WT and Tlr4 KO rats. A, Ethanol (10%) intake (g/kg/24 h), (B) water intake (ml/kg/24 h), (C) ethanol preference, and (D) body weight (g) in male and female WT and Tlr4 KO rats during 2BC drinking sessions measured over 5 weeks. The data are presented as mean ± SEM. Data were analyzed using 2 × 2 × 5 (genotype by sex × week) mixed ANOVAs (WT male, n = 23; WT female, n = 16; KO male, n = 15; KO female, n = 11). *Significant (p < 0.05) difference between male and female rats within genotype; #significant (p < 0.05) difference between week 1 and a subsequent week for the respective sex within genotype.
No significant effect of (+)-naloxone on DID in C57BL/6J mice
We examined the effect of pharmacological inhibition of TLR4 signaling in mice using a binge-like drinking model. (+)-Naloxone treatment did not alter ethanol (20%) intake (Fig. 6A) or BEC measured on drinking day 4 of the DID test. There was no overall effect of (+)-naloxone at 2 h (F(2,21) = 1.4, p = 0.3) or 4 h (F(2,21) = 0.1, p = 0.9), nor was there an effect on BEC measured at 4 h (F(2,21) = 0.4, p = 0.7). BECs for vehicle-treated, 30 mg/kg (+)-naloxone-treated, and 60 mg/kg (+)-naloxone-treated mice were 73.6 ± 13.7, 80.8 ± 19.8, and 58.2 ± 19.7 mg/dl, respectively. Administration of 60 mg/kg (+)-naloxone over 4 d also had no significant effect on DID (Fig. 6B) or on BEC. There was a trend toward reduction of drinking by (+)-naloxone at 2 h (F(1,14) = 3.1, p = 0.1), but not at 4 h (F(1,14) = 1.5, p = 0.2). BECs measured at 4 h for vehicle- and 60 mg/kg (+)-naloxone-treated mice were 71.9 ± 21.2 and 41.9 ± 5.6 mg/dl, respectively, but the effect was not significant (F(1,14) = 1.9, p = 0.2).

Effect of (+)-naloxone on ethanol intake in the DID test in C57BL/6J mice. A, Male C57BL/6J mice were injected with (+)-naloxone (0, 30, or 60 mg/kg; n = 8 per group) 30 min before the start of the drinking session (20% ethanol) on day 4 of the DID protocol and intake was measured after 2 or 4 h. B, Male mice were injected with saline (vehicle) or 60 mg/kg (+)-naloxone 30 min before the start of the DID (20% ethanol) session for 4 d (n = 8 per group). The data are presented as mean ± SEM. Data were analyzed separately at the 2 and 4 h time points using one-way ANOVA with (+)-naloxone dose as the between-subjects factor.
Effect of (+)-naloxone on 2BC and CIE-2BC drinking in C57BL/6J mice
We then tested the effect of individual injections of (+)-naloxone (3–60 mg/kg) in mice under conditions of 2BC excessive drinking after CIE exposure. BECs were 186.6 ± 7.2, 149.6 ± 10.7, 174.8 ± 9.8, and 176.6 ± 9.0 mg/dl across the four cycles of vapor exposure. Increased ethanol (15%) drinking over 2 h was observed in the CIE-2BC group compared with the control 2BC group (Fig. 7A). An overall within-subjects ANOVA revealed a significant effect of group (F(1,28) = 30.5, p < 0.0001) and a group × dose interaction (F(4,112) = 3.2, p < 0.05). Further analysis revealed that this interaction was due to the decrease in ethanol intake by 60 mg/kg (+)-naloxone compared with vehicle (p < 0.01) and compared with 3 mg/kg (p < 0.05), 10 mg/kg (p < 0.01), and 30 mg/kg (p < 0.01) (+)-naloxone in the CIE group. There was no effect of (+)-naloxone in the control 2BC group. To further explore the high dose, we treated separate groups of control 2BC and CIE-2BC mice with 60 mg/kg (+)-naloxone for 4 d (Fig. 7B). There was a significant difference between 2BC and CIE-2BC mice in baseline drinking (F(1,16) = 23.2, p < 0.001) after vapor exposure. These groups were each divided into two subgroups to receive (+)-naloxone or vehicle based on equal drinking averages and equal BECs in the CIE-2BC groups. Vapor chamber BECs for the vehicle-treated mice were 165.7 ± 12.5, 176.6 ± 3.2, 176.6 ± 16.8, and 214.9 ± 20.0 mg/dl and BECs for the 60 mg/kg (+)-naloxone-treated mice were 170.7 ± 14.1, 187.9 ± 9.6, 191.3 ± 9.1, and 214.1 ± 14.4 mg/dl across the 4 cycles of exposure. Although the CIE effect was significant (F(1,16) = 30.2, p < 0.001), there was no significant treatment effect (F(1,16) = 0.0005, p = 1.0) or group × treatment interaction (F(1,16) = 0.2, p = 0.6). Within-dose comparisons across injections also revealed no overall significant effects, but if each treatment day is compared with baseline, there was a significant effect of 60 mg/kg (+)-naloxone on day 3 (p = 0.03). However, drinking did not differ from vehicle-treated mice on this (or any other) day. These results support a modest but inconsistent effect of 60 mg/kg (+)-naloxone on ethanol drinking in dependent mice.

Effect of (+)-naloxone on ethanol intake in the 2BC and CIE-2BC tests in C57BL/6J mice. A, Effect of individual doses of (+)-naloxone on 2BC intake (g/kg/2 h). Increased ethanol (15%) consumption was observed in the CIE-2BC group compared with the control 2BC group (t(28) = 5.8, p < 0.0001). Male C57BL/6J mice (n = 15 per group) were administered (+)-naloxone (0, 3, 10, 30, 60 mg/kg) in a within-subject manner (every 3–4 d) 30 min before 2BC testing. The data are presented as mean ± SEM. Data were analyzed by two-way repeated-measures ANOVA (group as the between factor; dose as the within factor). B, Effect of 4 d of 60 mg/kg (+)-naloxone treatment on 2BC drinking (g/kg/2 h). The mice were then divided into two groups to receive (+)-naloxone or vehicle based on equal drinking averages. Male mice in a between-subject design (n = 4–6 per group: control-vehicle, control-60 mg/kg (+)-naloxone, CIE-vehicle, CIE-60 mg/kg (+)-naloxone) were injected 30 min before 2BC testing across 4 d. The data are presented as mean ± SEM. Data were analyzed by three-way repeated-measures ANOVA (group and dose as the between factors; day as the within factor). **p < 0.01 compared with baseline.
Effect of Tlr4 mRNA knockdown in mouse NAc on 2BC drinking
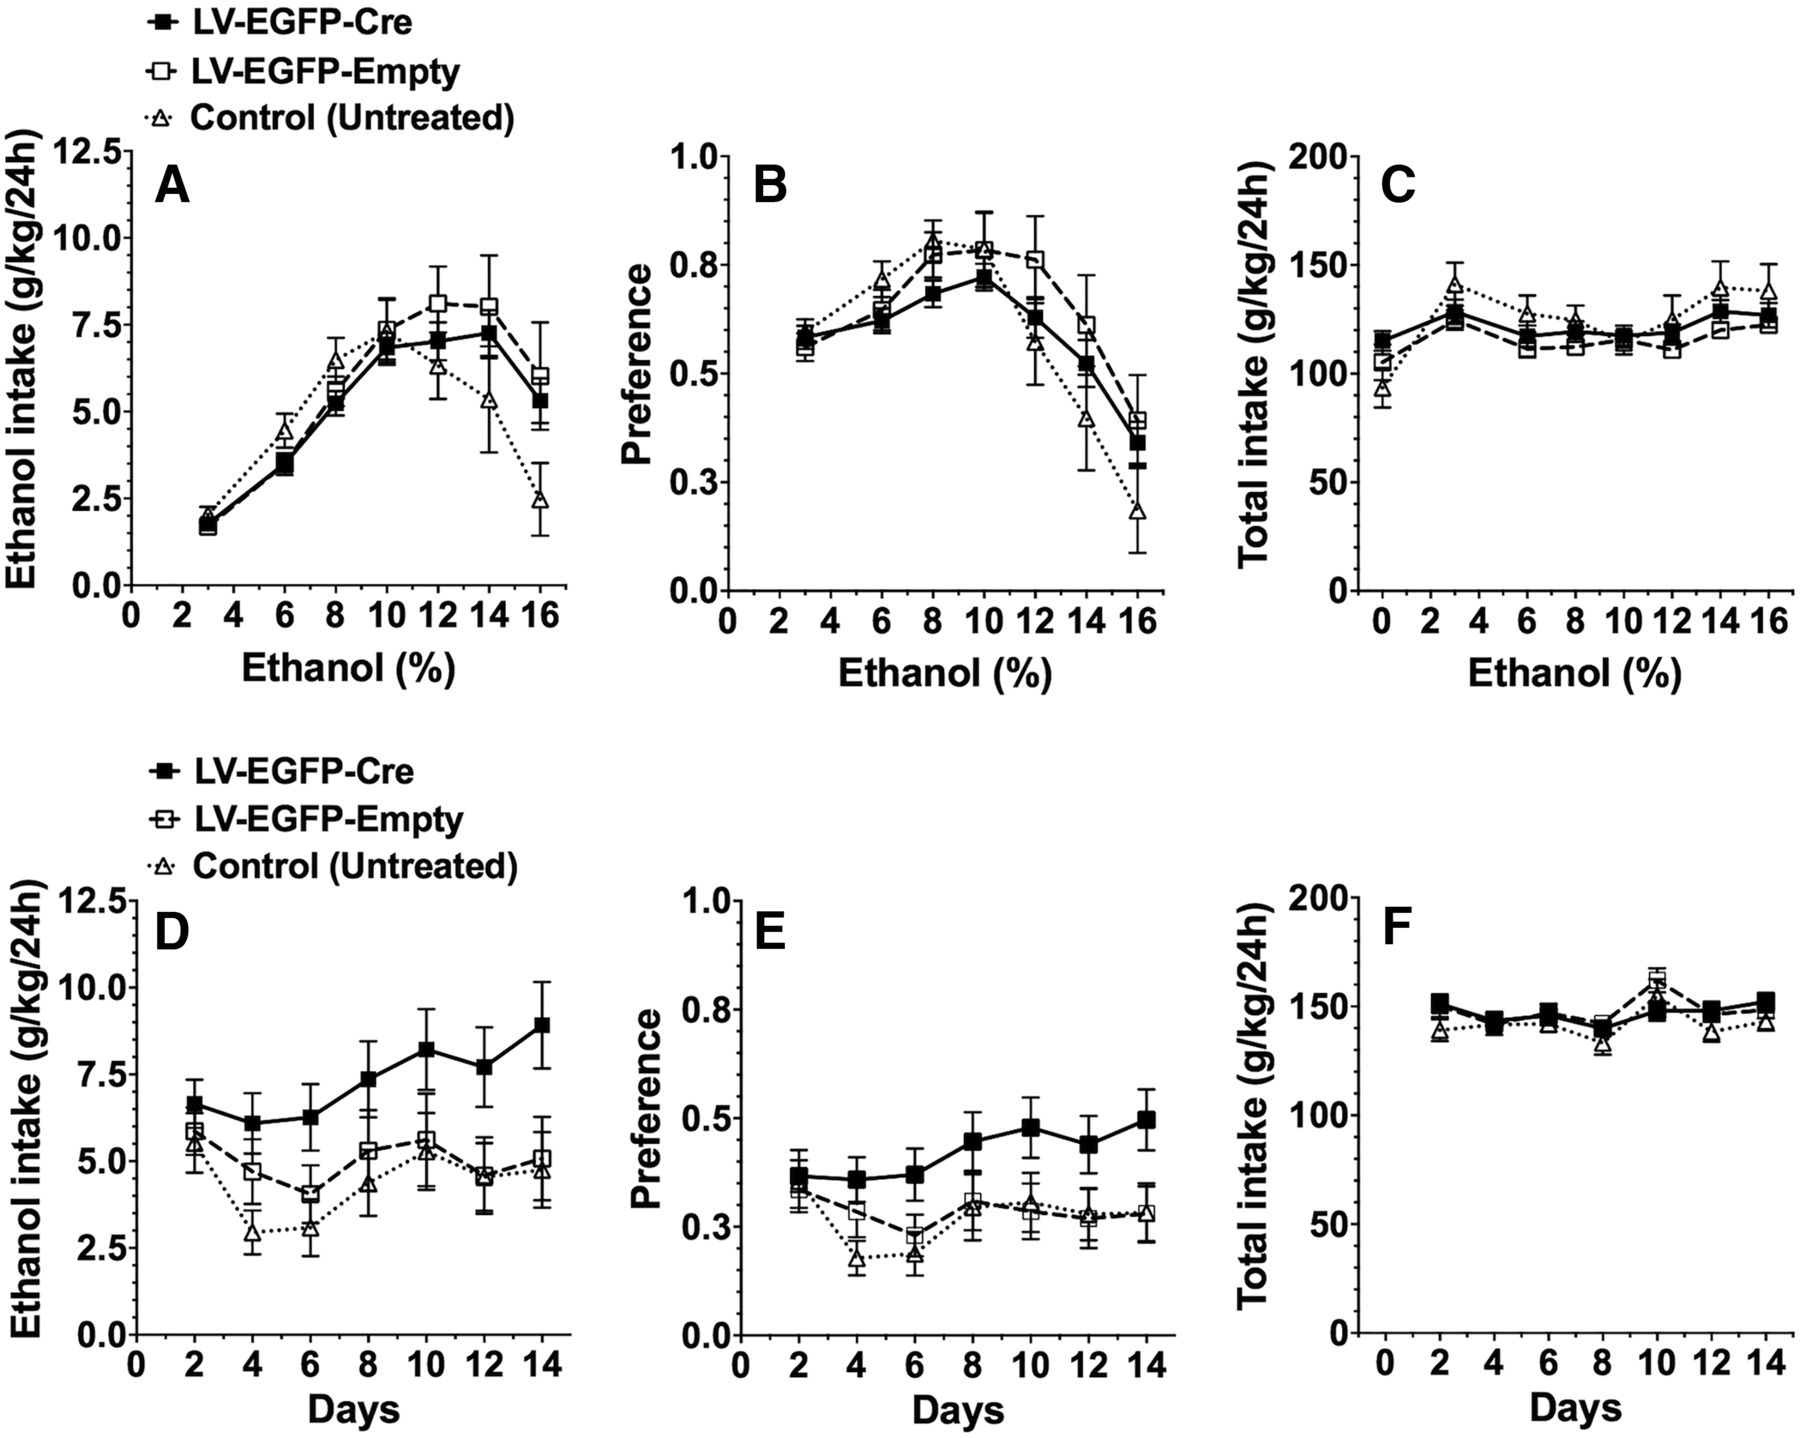
Selective knockdown of TLR4 signaling in the CeA or VTA (but not the VP) decreased binge-like drinking in P rats (Liu et al., 2011; June et al., 2015). In the current study, we examined Tlr4 knockdown in mouse NAc, another important brain region in binge drinking. However, knockdown in the NAc did not alter ethanol intake, preference for ethanol, or total fluid intake in the 24 h continuous access 2BC test in which Tlr4F/F treated and untreated mice could drink either water or a series of increasing ethanol (3–16%) concentrations (Fig. 8A–C).

Effect of Tlr4 knockdown in NAc on ethanol intake in the continuous and intermittent access 2BC tests in Tlr4F/F male mice. A–C, Ethanol intake (g/kg/24 h) (A), preference for ethanol (B), and total fluid intake (g/kg/24 h) (C) in the 2BC continuous access test in untreated control Tlr4F/F mice (n = 10) and Tlr4F/F mice injected with LV-Cre-EGFP (n = 20) or LV-Cre-Empty (n = 10). D–F, Ethanol (15%) intake (g/kg/24 h) (D), preference for ethanol (E), and total fluid intake (g/kg/24 h) (F) in the 2BC intermittent access test in untreated control Tlr4F/F mice (n = 10) and Tlr4F/F mice injected with LV-Cre-EGFP (n = 20) or LV-Cre-Empty (n = 11). Each point is the average of 2 d of drinking. The data are presented as mean ± SEM. Data were analyzed by two-way repeated-measures ANOVA.
In the 2BC test with intermittent access to 15% ethanol, comparison of Tlr4F/F treated (LV-EGFP-Cre; LV-EGFP-Empty) and control (untreated) mice revealed a significant treatment × day interaction for ethanol consumption (F(6,174)= 2.3; p < 0.05), but not for ethanol preference or total fluid intake (Fig. 8D–F). Two-way repeated-measures ANOVA showed no main effect of treatment in any test. Post hoc analyses for each day when corrected for multiple comparisons also showed no significant differences between LV-EGFP-Cre versus LV-EGFP-Empty treated mice or between LV-EGFP-Cre treated versus control untreated mice. Although there was a trend toward increased alcohol consumption in the intermittent test after Tlr4 mRNA knockdown in NAc, this was not statistically significant.
Verification of Tlr4 knockdown in NAc
Verification of successful knockdown of Tlr4 mRNA in the NAc involved a two-step process: (1) confirmation of needle placement and (2) quantitation of Tlr4 mRNA. Half of the treated (LV-EGFP-Cre, LV-EGFP-Empty) Tlr4F/F mice were used to verify injection coordinates. Figure 9A is a representative image of a coronal section of the NAc (AP +1.49 mm) from a lentivirus-treated Tlr4F/F mouse. The left side is a fluorescent image that shows the EGFP signal (surrogate marker for lentivirus transduction) in green and DAPI (a stain that visualizes the nuclei of all cells) in blue. The right side of the image is a bright-field image used to better visualize the neuroanatomical landmarks. Figure 9B is a brain atlas image of a coronal section (AP +1.49 mm) showing the desired target coordinates, with the blue circles highlighting the NAc and the green ovals demonstrating the location of the LV-EGFP-Cre and LV-EGFP-Empty infection. All samples obtained from mice in both drinking experiments were on target and demonstrated an EGFP signal that covered at least one-third of the NAc.
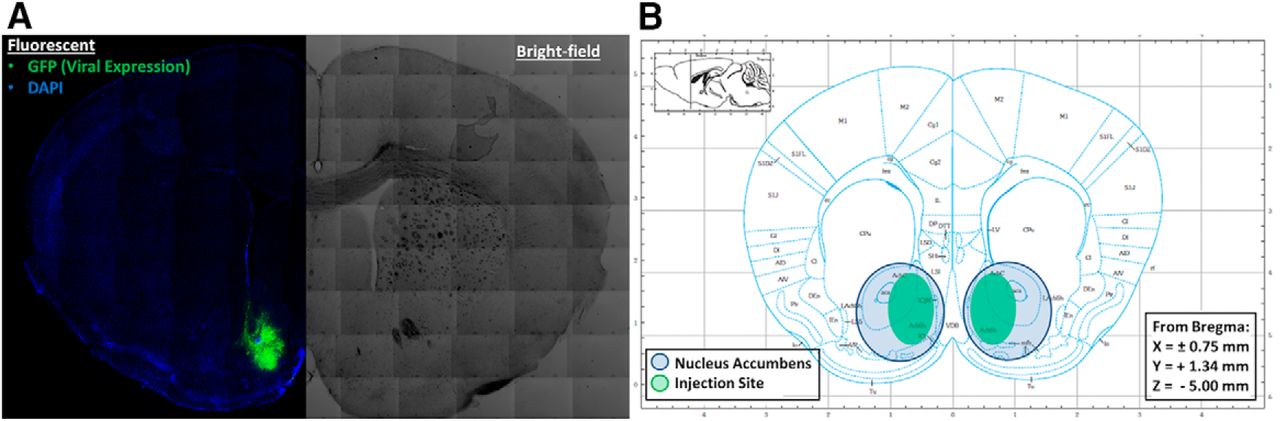
Verification of injection site after Tlr4 mRNA knockdown in NAc. A, Composite microscope image of a coronal section of the NAc after lentivirus injection using fluorescent microscopy (left) to show EGFP marker signal (green) and bright-field (right) to demonstrate neuroanatomy. B, Coronal brain atlas diagram of the NAc injection site with blue circles showing the NAc and green ovals illustrating the typical lentivirus location and spread.
Micropunches of the injection site were obtained from the other half of the treated (LV-EGFP-Cre, LV-EGFP-Empty) Tlr4F/F mice. The extracted RNA had excellent yields, purity, and quality; RNA integrity numbers averaged >8.0, indicating little or no degradation, and the 260/230 and 260/280 ratios were >2.0. We observed >60% knockdown (p < 0.001) of Tlr4 mRNA relative to the endogenous control 8 weeks after injection in mice exposed to 2BC continuous and intermittent access drinking tests (Fig. 10).

Verification of Tlr4 mRNA knockdown after lentivirus injections in NAc. Tlr4 mRNA levels in the NAc target site were assessed by qPCR and normalized relative to Gadph mRNA levels after the 2BC continuous access (n = 12, LV-EGFP-Cre; n = 7, LV-EGFP-Empty) and 2BC intermittent access tests (n = 11, LV-EGFP-Cre; n = 7, LV-EGFP-Empty). Values (mean ± SEM) are shown relative to LV-EGFP-Empty treated mice; ***p < 0.001 determined by Student's t test.
Role of TLR4 in the acute behavioral actions of ethanol
Reduced duration of ethanol-induced LORR in Tlr4 KO rats
Previous work in mice showed that lack of Tlr4 or administration of (+)-naloxone reduced the duration of LORR induced by a single high dose of ethanol (4.5 g/kg) (Corrigan et al., 2015). We tested a single high dose of ethanol (4.0 g/kg) in rats and also found that the latency to induction of ethanol-induced LORR was significantly increased (Fig. 11A) and the duration of LORR was significantly reduced (Fig. 11B) in Tlr4 KO rats compared with WT rats.

The sedative effects of ethanol are reduced in Tlr4 KO male rats. Left panel, Time to LORR in male WT and Tlr4 KO rats (n = 10 per group, df = 18, t = 2.3, p < 0.05). Right panel, Time of LORR in WT and Tlr4 KO rats (n = 10 per group, df = 18, t = 3.9, p < 0.01). The data are presented as mean ± SEM in minutes. *p < 0.05 and **p < 0.01 determined by unpaired Student's t test.
Role of TLR4 in GABAergic transmission in CeA neurons
Spontaneous GABAergic transmission
We examined GABAergic transmission in CeA neurons from Tlr4 KO and WT rats based on the evidence for TLR4 pathway signaling in GABAergic synapses in mouse CeA (Bajo et al., 2014). The effect of an acute application of ethanol (44 mm) on GABAergic transmission was tested in CeA neurons of naive WT and Tlr4 KO rats and after CIE or a single LPS challenge (experiments performed 7–10 d after LPS injection). We found no significant differences in the baseline s/mIPSC frequencies, amplitudes, or decay times in CeA neurons from WT and Tlr4 KO mice (Table 1). However, we observed a significant (p < 0.05) difference in baseline mIPSC rise times between the genotypes (Table 1). In addition, whereas LPS and CIE treatments had no effect on s/mIPSC parameters across genotypes, both treatments significantly (p < 0.05) altered s/mIPSC rise times in WT and Tlr4 KO mice (Table 1).
Baseline spontaneous and miniature IPSCs in CeA neurons from naive, CIE-treated, and LPS-treated WT and Tlr4 KO rats
Acute ethanol application
We also compared the effects of acute ethanol application on GABAergic transmission in CeA neurons from naive WT and Tlr4 KO rats. Ethanol (44 mm) significantly (p < 0.01–0.05) increased s/mIPSC frequencies in CeA neurons from both genotypes; ethanol increased the mean sIPSC frequency by 37.6 ± 11.4% in WT and 45.7 ± 14.2% in Tlr4 KO rats (Fig. 12A,B) and increased the mIPSC frequency by 26.4 ± 7.1% in WT and 43.6 ± 13.5% in Tlr4 KO rats (Fig. 13C,D). Acute ethanol did not alter s/mIPSC amplitudes or kinetics in CeA neurons from either genotype (Fig. 12). There was no significant difference in the acute ethanol-induced increases of CeA GABA release in neurons from naive WT and Tlr4 KO rats.

Acute ethanol potentiates spontaneous and miniature GABA release in CeA neurons from ethanol-naive WT and Tlr4 KO rats. A, Traces of representative sIPSC recordings of CeA neurons from naive WT (left) and Tlr4 KO (right) male rats before and after acute bath application of ethanol (44 mm). B, Acute ethanol increased the mean sIPSC frequency in CeA neurons by 37.6 ± 11.4% in WT (from 1.4 ± 0.5 to 1.6 ± 0.6 Hz, n = 9) and by 45.7 ± 14.2% in KO (from 0.9 ± 0.2 to 1.2 ± 0.3 Hz, n = 10) rats. There was a significant main effect of ethanol (F(1,17)) = 11.0, p < 0.01), but no main effect of genotype or interaction between ethanol and genotype. Acute ethanol did not have significant effects on sIPSC amplitudes (WT: 111.3 ± 9.4% of control; KO: 115.8 ± 5.1% of control) or kinetics (rise time: WT, 97.0 ± 3.3% of control; KO, 106.6 ± 3.7% of control; decay time: WT, 112.5 ± 7.5% of control; KO, 117.6 ± 9.7 of control). C, Representative mIPSCs recorded from CeA neurons of naive WT and Tlr4 KO rats showing an increase in mIPSC frequencies after acute ethanol application. D, Acute ethanol increased mIPSC frequencies in CeA WT and Tlr4 KO neurons. There was a significant main effect of ethanol (F(1,12) = 11.8, p < 0.05) on mIPSC frequencies in WT (26.4 ± 7.1%; from 0.5 ± 0.1 to 0.6 ± 0.1 Hz, n = 5) and KO neurons (43.6 ± 13.5%; from 0.3 ± 0.1 to 0.4 ± 0.1 Hz, n = 9), but no significant main effects of genotype or the interaction between ethanol and genotype. Ethanol had no effects on mIPSC amplitudes (WT: 100.3 ± 2.0% of control; KO: 93.6 ± 3.6% of control) or kinetics (rise time: WT, 90.9 ± 2.8% of control; KO, 99.9 ± 4.9% of control; decay time: WT, 102.9 ± 2.3% of control; KO, 96.7 ± 11.6% of control) in neurons from WT and Tlr4 KO rats. Statistical significance was calculated by two-way repeated-measures ANOVA (#p < 0.05). The data are presented as mean ± SEM.

Acute ethanol enhances GABA release in CeA neurons from WT and Tlr4 KO rats differentially after CIE exposure. A, Traces of sIPSC recordings in CeA neurons from WT and Tlr4 KO male rats exposed to CIE vapor. B, Bath application of 44 mm ethanol facilitated sIPSC frequencies in WT neurons significantly by 57.2 ± 4.3% (from 1.0 ± 0.4 to 1.5 ± 0.6 Hz, n = 8), but enhanced frequencies in only 6 of 10 KO neurons (46.5 ± 23.1% of control; from 1.2 ± 0.7 to 1.7 ± 0.8 Hz, n = 6) and decreased (< 85% of control, n = 3) or had no effect (85–115% of control, n = 1) on sIPSC frequencies in the remainder (85.5 ± 9.3% of control; from 0.7 ± 0.1 to 0.5 ± 0.04 Hz) of KO neurons. Two-way repeated-measures ANOVA of the peak ethanol effects from all of the tested cells showed a significant main effect of ethanol (F(1,16) = 9.3, p < 0.05), but no effect of genotype or interaction between ethanol and genotype. The acute ethanol effects on sIPSC frequencies were transient in the neurons from KO compared with WT rats. C, Representative mIPSCs in CeA neurons from WT and Tlr4 KO rats chronically exposed to ethanol. D, Acute ethanol (44 mm) application increased mIPSC frequencies in WT and Tlr4 KO neurons by 55.1 ± 19.9% (from 0.3 ± 0.1 to 0.4 ± 0.1 Hz, n = 5) and 58.6 ± 22.6% (from 0.4 ± 0.1 to 0.5 ± 0.8 Hz, n = 6), respectively. Two-way repeated-measures ANOVA showed a significant main effect of ethanol (F(1,9) = 19.8, p < 0.05), but not genotype or the interaction between ethanol and genotype. Acute ethanol had no significant effects on the mean mIPSC amplitudes (WT: 104.8 ± 6.9% of control; KO: 109.9 ± 11.3% of control) or kinetics (rise time: WT, 105.4 ± 5.8% of control; KO, 112.0 ± 6.2% of control; decay time: WT, 115.1 ± 13.3% of control; KO, 101.4 ± 4.3% of control) in WT and Tlr4 KO rats. The data are presented as mean ± SEM (#p < 0.05).
CIE vapor exposure
In CeA neurons from CIE-treated WT and Tlr4 KO rats, acute ethanol (44 mm) application also increased s/mIPSC frequencies (Fig. 13). Two-way repeated-measures ANOVA of the peak ethanol effects from all of the tested cells showed a significant main effect of ethanol (F(1,16) = 9.3, p < 0.05), but no effect of genotype or interaction between ethanol and genotype. Ethanol significantly facilitated sIPSC frequencies in WT neurons by 57.2 ± 4.3%, but had mixed effects in the CeA neurons from Tlr4 KO rats. For example, ethanol enhanced sIPSC frequencies in only 6 of 10 Tlr4 KO neurons (47% of control) and either decreased (< 85% of control, n = 3) or had no effect (85–115% of control, n = 1) in the remaining neurons. Although the magnitude of the acute ethanol effect on s/mIPSC frequencies was similar in CIE-treated and naive WT and Tlr4 KO rats, the ethanol-induced facilitation of sIPSC frequency was transient (5–6 min) in the CIE-treated Tlr4 KO rats compared with the other 3 groups (12–15 min; data not shown). Consistent, sustained ethanol-induced increases in mIPSC frequencies were observed in both WT and Tlr4 KO neurons. Two-way repeated-measures ANOVA showed a significant main effect of ethanol (F(1,9) = 19.8, p < 0.05), but not genotype or the interaction between ethanol and genotype. There were no significant acute ethanol-induced changes in the amplitude and kinetics of s/mIPSCs in CIE-treated WT and Tlr4 KO rats.
LPS exposure
We investigated the effects of acute ethanol application on CeA neurons from WT and Tlr4 KO rats 7–10 d after a single LPS injection (1 mg/kg, i.p.). There was a significant main effect of ethanol treatment (F(1,13) = 5.9, p < 0.05), but not genotype, and no significant interaction between genotype and ethanol. Ethanol (44 mm) had opposite effects on sIPSC frequency in WT versus Tlr4 KO rats, represented by a significant reduction of 41.4 ± 4.0% in the LPS-treated WT neurons (Fig. 14). Although there was an overall significant increase of 29.9 ± 21.6% in sIPSC frequency by acute ethanol in neurons from LPS-treated Tlr4 KO rats (Fig. 14), ethanol produced mixed, cell-specific effects; ethanol increased the frequencies in 3 of 7 cells (> 115% of control, n = 3), but had no effect (85–115% of control, n = 4) in the others. There were no significant ethanol-induced changes in the sIPSC amplitude and kinetics between the two groups.

LPS injection alters GABA responses to acute ethanol in CeA neurons from WT but not Tlr4 KO rats. A, Representative recordings of sIPSCs from LPS-treated WT and Tlr4 KO male rats. B, Seven to 10 d after a single LPS injection (1 mg/kg, i.p.), acute 44 mm ethanol application reduced sIPSC frequencies by 41.4 ± 4.0% (from 1.3 ± 0.3 to 0.7 ± 0.2 Hz, n = 8) in CeA neurons from LPS-treated WT rats. Ethanol's effects on sIPSC frequencies in LPS-treated KO rats (an overall increase of 29.9 ± 21.6%, n = 7) were more varied, with ethanol-induced potentiation (> 115% of control, n = 3) or no effect (85–115% of control, n = 4) occurring in a cell-specific manner. There was a significant main effect of ethanol treatment (F(1,13) = 5.9, p < 0.05), but not genotype, and no interaction between genotype and ethanol. There were no significant effects of acute ethanol on the amplitudes (WT: 93.6 ± 12.9%; KO: 112.3 ± 11.1% of control) or kinetics (rise time: WT, 109.9 ± 4.4%; KO, 97.8 ± 2.2%; decay time: WT, 90.2 ± 14.7%; KO, 115.2 ± 10.1% of control) in LPS-treated WT and Tlr4 KO rats. The data are presented as mean ± SEM. Statistical significance was calculated by two-way repeated-measures ANOVA (#p < 0.05).
Finally, we compared the normalized effects of acute ethanol on s/mIPSC frequencies across the different treatment groups using two-way ANOVA. There was a significant main effect of treatment (F(2,46) = 6.7, p < 0.01), but not genotype (F(2,46) = 1.3, p > 0.05), on sIPSC frequencies and a significant interaction between treatment and genotype (F(2,46) = 7.3, p < 0.01). Bonferroni post hoc tests showed significant differences in ethanol effects in the LPS-treated rats compared with naive and CIE-treated WT rats, whereas there were no significant differences among the individual treatment groups of Tlr4 KO rats. There were no main effects of treatment or genotype on acute ethanol-induced potentiation of mIPSC frequencies between naive and CIE-treated rats.
Discussion
INIA-Neuroimmune investigators used extensive behavioral and electrophysiological tests to examine the role of TLR4 in acute and chronic ethanol responses in rats and mice (summarized in Table 2). Different genetic and pharmacologic approaches were used to inhibit TLR4-mediated signaling and different models of voluntary ethanol intake were studied in male and female rodents.
Summary of tests performed in rats and mice
In addition to genotyping, rats were injected with LPS to verify that TLR4, a primary target, was nonfunctional in the KO animals. LPS produced “sickness-like” behavior in naive and ethanol-treated WT rats, represented by decreased food/water intake and body weight; however, Tlr4 KO rats were resistant to these effects as reported previously in Tlr4 KO mice (Qureshi et al., 1999; Kalis et al., 2003; von Meyenburg et al., 2004; Yang et al., 2014). We further demonstrated that WT ethanol-trained rats developed tolerance to LPS-induced toxicity in agreement with studies in ethanol-naive rats (McCarthy et al., 1984; Cross-Mellor et al., 2000). Female B6 mice also showed evidence of tolerance to decreased body weight after a second LPS injection (Blednov et al., 2011).
LPS increased ethanol consumption in mice (Blednov et al., 2011) and elevated serum levels of LPS were positively correlated with alcohol craving in humans (Leclercq et al., 2012; Leclercq et al., 2014). In WT rats, LPS transiently reduced ethanol self-administration, but had no long-term effects on drinking in either genotype. The initial reduction in ethanol responding (1–4 d after LPS) may be due to induction of “sickness-like” behavior that affects the motivation for ethanol similar to effects on food/water intake. We found no differences in ethanol self-administration in WT and Tlr4 KO rats before or after dependence and no consistent genotype differences in 2BC drinking over 5 weeks. The inconsistent decrease in dependence-driven drinking by 60 mg/kg (+)-naloxone may be due to nonspecific/aversive effects of this high dose, as reported in rats (Tanda et al., 2016).
TLR4 knockdown in the CeA or VTA decreased binge drinking in P rats (Liu et al., 2011; June et al., 2015). Given the prominent role of the NAc within the mesocorticolimbic reward circuit in alcohol abuse and dependence, we further studied the effects of TLR4 in this brain region. However, Tlr4 mRNA knockdown in mouse NAc did not reduce 2BC continuous or limited access drinking. In addition to brain region, there are other key differences between the studies. We examined male C57BL/6J mice using the 2BC continuous and intermittent models, whereas the previous work was in P rats (the sex was not reported) using a binge-drinking model. The P rats had increased levels of GABAA receptor α2 subunits and TLR4 in the CeA and VTA, and α2 subunit-specific knockdown in the CeA inhibited TLR4 function and decreased drinking (Liu et al., 2011). Furthermore, Tlr4 knockdown in the CeA decreased α2 subunit expression and also reduced drinking (Liu et al., 2011). Therefore, the TLR4-related effects on binge drinking in P rats may be due to altered GABAergic (α2 subunit-specific) responses.
Although TLR4 signaling did not regulate ethanol consumption consistently in our rodent models or in other studies (Alfonso-Loeches et al., 2010; Pascual et al., 2011; Bajo et al., 2016; Blednov et al., 2017a), Tlr4 KO rats displayed lower sensitivity than WT to the acute sedative effects of ethanol. This is consistent with results in mice lacking Tlr4 or WT mice treated with (+)-naloxone (Wu et al., 2012b; Corrigan et al., 2015; Blednov et al., 2017b). A complex interaction between TLR2 and TLR4 in ethanol-induced LORR was reported (Corrigan et al., 2015) and ethanol also promoted physical TLR2/TLR4 interactions in lipid rafts, which may facilitate immune activation (Fernandez-Lizarbe et al., 2013). Therefore, a role for TLR signaling in ethanol-induced sedation is emerging across species and TLRs and associated pathways may regulate some of ethanol's acute responses synergistically.
We examined GABAergic transmission in CeA neurons because TLR4 pathway components were involved in ethanol's acute effects on GABAergic IPSPs in these synapses (Bajo et al., 2014) and because Tlr4 knockdown in the CeA of P rats potentially reduced drinking via a GABAergic mechanism (Liu et al., 2011). Deletion of Tlr4 did not affect baseline spontaneous GABA release in CeA neurons, but altered the kinetics of GABAA receptor-mediated IPSCs, indicating a role for TLR4 in GABAA receptor function (Otis et al., 1994). Generally, the kinetic properties of GABAA-mediated currents are determined by subunit composition, posttranslational modifications, trafficking, synaptic localization, and clustering (Jacob et al., 2008; Wu et al., 2012a; Dixon et al., 2014) and we cannot exclude potential contributions from these factors.
Deletion of CD14, an accessory protein for LPS-mediated activation of TLR4, had no effects on CeA GABAergic transmission (Bajo et al., 2014), indicating different synaptic effects for different TLR4 pathway components. However, frequencies of sIPSCs and tonic currents were altered in Il1rn KO mice (Bajo et al., 2015). Collectively, our findings support distinct roles for neuroimmune regulators in basal GABAergic transmission.
Acute ethanol increased action potential-dependent and -independent GABA release in CeA neurons from naive and CIE-treated WT and Tlr4 KO rats in agreement with previous studies (Roberto et al., 2003; Roberto et al., 2004; Gilpin et al., 2011; Cruz et al., 2013; Herman et al., 2013). The lack of differences in acute ethanol effects on spontaneous GABAergic transmission, especially in naive rats, agrees with our study suggesting that CD14 (rather than TLR4) is critical for ethanol effects in CeA neurons (Bajo et al., 2014). After LPS exposure, acute ethanol reduced CeA GABAergic transmission in WT but not Tlr4 KO neurons. Previous work in mice showed that LPS reduced firing of VTA neurons and increased ethanol drinking (Blednov et al., 2011). Despite the synaptic changes in WT neurons observed 7–10 d after LPS exposure, LPS did not alter ethanol self-administration in WT or Tlr4 KO rats at this time point. Although our results support the involvement of the TLR4 pathway in regulating CeA GABA transmission, it is likely that other immune mediators released during LPS-induced peripheral and central immune activation contribute to the altered ethanol effects in WT synapses.
In Tlr4 KO rats after CIE or LPS treatment, we observed cell-specific responses to acute ethanol similar to the variable ethanol effects in naive Cd14 or Il1rn KO mice (Bajo et al., 2014; Bajo et al., 2015). Activation of peripheral immune responses is known to stimulate discrete CeA neurons (Day et al., 1999; Serrats et al., 2006). Overall, these findings point to distinct neuronal populations and circuits in the CeA whose basal activities or ethanol responses are regulated differentially by proinflammatory/neuroimmune molecules.
We used different methods to target TLR4 and different models of ethanol intake, but there was little evidence that TLR4 regulates drinking directly. In microglia, (+)-naloxone and (+)-naltrexone may block TLR4 downstream signaling preferentially via the TRIF-IRF3 pathway (Wang et al., 2016), indicating that they may not block all arms of TLR4 signaling. Given that there were no consistent differences in 2BC drinking and operant self-administration of ethanol between WT and Tlr4 KO rats, it is unlikely that the lack of (DID and 2BC) or inconsistent (CIE-2BC) effect of (+)-naloxone is due to incomplete TLR4 inhibition, particularly at the 60 mg/kg dose. Collectively, our results in mice and rats are in agreement with studies showing that Tlr4 KO and WT mice did not differ in ethanol consumption (Alfonso-Loeches et al., 2010; Pascual et al., 2011; Blednov et al., 2017a). Our (+)-naloxone results in mice are consistent with another TLR4 inhibitor that also decreased ethanol consumption nonspecifically in mice (Bajo et al., 2016). To date, only knockdown of Tlr4 mRNA in the CeA or VTA of P rats decreased binge drinking and this was associated with α2 subunit-specific GABAergic signaling. However, there is now consistent evidence across species for a role of TLR4 in mediating the acute sedative effects of alcohol, which could be an indicator of overall sensitivity to alcohol and susceptibility to develop dependence.
TLR4 mediates ethanol-induced increases in brain cytokines/chemokines and neurodegeneration and inhibition of TLR4 prevents or reverses ethanol-induced neuroimmune responses (Fernandez-Lizarbe et al., 2009; Alfonso-Loeches et al., 2010; Zou and Crews, 2014; Bajo et al., 2016). Chronic ethanol exposure may also disrupt the integrity of the blood–brain barrier via TLR4-dependent signaling (Rubio-Araiz et al., 2016). TLR4 was associated with cognitive impairment and anxiety-related behavior during ethanol withdrawal (Pascual et al., 2011; Pascual et al., 2015) and with synaptic remodeling and anxiety induced by binge drinking in adolescent mice (Montesinos et al., 2016). However, our comprehensive study using different species and sexes, different methods to inhibit TLR4, and different tests of chronic, dependence-driven, and binge-like consumption indicates that Tlr4 is not a critical gene for regulating ethanol drinking and inhibition of TLR4 signaling alone would not be an effective therapeutic strategy. Ethanol promotes physical interactions between TLR4 and TLR2 (Fernandez-Lizarbe et al., 2013) and TLR4/TLR2 interactions were implicated in ethanol-induced sedation (Corrigan et al., 2015), which warrants consideration that TLR4 and other neuroimmune mediators may regulate ethanol responses synergistically. Analyses of the conserved cross-species gene networks in alcoholics and animal models exposed to chronic alcohol will help to prioritize immune/inflammatory pathways (and candidate drugs) with improved therapeutic potential for alcohol use disorders.
Footnotes
- Received June 20, 2016.
- Revision received October 7, 2016.
- Accepted December 1, 2016.
This work was supported by the National Institutes of Health (Integrative Neuroscience Initiative on Alcoholism and the National Institute on Alcohol Abuse and Alcoholism Grants U01 AA013517 and AA013498 to M.R., Grants U24 AA015512 and U01 AA013522 to R.L.B., Grant U01 AA013520 to Y.A.B. and R.A.H., Grants U01 AA020926 and P0 AA020683 to R.D.M., Grants U01 AA013523 and AA020893 to A.J.R., Grant AA016654 to A.W.L., and Grant U01 AA020889 to G.E.H.). (GFK). We thank Jillian Benavidez, Mendy Black, Molly Brennan, Carolyn Ferguson, Tali Nadav, Lindsay Cates, and Donghong He for expert technical assistance and Brigitte Kieffer and Jahan Dadgar for providing the EGFP-Cre construct.
The authors declare no competing financial interests.
- Correspondence should be addressed to R. Adron Harris, Ph.D., Waggoner Center for Alcohol and Addiction Research, The University of Texas at Austin, 2500 Speedway, Austin, TX 78712. harris{at}austin.utexas.edu
- Copyright © 2017 the authors 0270-6474/17/371140-17$15.00/0