

Abstract
As neuronal dendrites develop, they acquire cell-type-specific features including characteristic size, shape, arborization, location and synaptic patterns. These features, in turn, are major determinants of type-specific neuronal function. Because neuronal diversity complicates the task of relating developmental programs to adult structure and function, we analyzed dendritic morphogenesis in a single retinal ganglion cell (RGC) type in mouse called J-RGC. We documented the emergence of five dendritic features that underlie J-RGC physiology: (1) dendritic field size, which approximate receptive field size; (2) dendritic complexity, which affects how J-RGCs sample space; (3) asymmetry, which contributes to direction-selectivity; (4) restricted lamination within the inner plexiform layer (IPL), which renders J-RGCs responsive to light decrements; and (5) distribution of synaptic inputs, which generate a color-opponent receptive field. We found dendritic growth in J-RGCs is accompanied by a refinement in dendritic self-crossing. Asymmetry arises by a combination of selective pruning and elaboration, whereas laminar restriction results from biased outgrowth toward the outermost IPL. Interestingly, asymmetry develops in a protracted dorsoventral wave, whereas lamination does so in a rapid centrifugal wave. As arbors mature, they acquire excitatory and inhibitory synapses, with the latter forming first and being concentrated in proximal dendrites. Thus, distinct mechanisms operate in different spatiotemporal dimensions of J-RGC dendritic patterning to generate the substrate for specific patterns of synaptogenesis. Finally, we asked whether the defining molecular signature of J-RGCs, the adhesion molecule JAM-B, regulates morphogenesis, and showed that it promotes dendro-dendritic interactions. Our results reveal multiple mechanisms that shape a dendritic arbor.
SIGNIFICANCE STATEMENT Visual perception begins in the retina, where distinct types of retinal ganglion cells (RGCs) are tuned to specific visual features such as direction of motion. The features to which each RGC type responds are determined largely by the number and type of synaptic inputs it receives, and these, in turn, are greatly influenced by the size, shape, arborization pattern, and location of its dendrites. We analyzed dendritic morphogenesis in a functionally characterized RGC type, the J-RGC, demonstrating distinct mechanisms that operate in different dimensions to generate the dendritic scaffold and synaptic patterns for feature detection. Our work elucidates cellular and molecular mechanisms that shape dendritic arbors and synaptic distribution, enabling J-RGC connectivity and thus, function.
Introduction
Dendrite architecture is a key determinant of neuronal function. The immense diversity in dendritic patterns reflects structural requirements for specialized tasks. For example, the size and position of the dendritic arbor strongly influence the number and types of inputs a neuron receives, and the arrangement of synapses on its branches affects the way in which it integrates signals (London and Häusser, 2005; Lefebvre et al., 2015). Mechanisms that regulate dendritic morphogenesis are therefore important for assembly of functional neural circuits.
The murine retina is well suited for the elucidation of these programs. It contains >40 types of retinal ganglion cells (RGCs), each of which responds to distinct visual features (Sun et al., 2002; Kong et al., 2005; Coombs et al., 2006; Völgyi et al., 2009; Baden et al., 2016). The diverse messages conveyed by these channels to the rest of the brain are a consequence of the synaptic inputs that each RGC type receives and these, in turn, result from the dendritic shape, size, arborization pattern, and location that RGCs acquire during postnatal development. For instance, the size of each dendritic arbor determines its receptive field size, its position within the inner plexiform layer (IPL) restricts the choices of synaptic partners, and its arborization pattern affects how the field is sampled (Lefebvre et al., 2015).
Over the past decade, much has been learned about molecular, structural and functional distinctions among RGC types (Sanes and Masland, 2015). Less is known, however, about the developmental mechanisms that make one type different from another. A major impediment is that most studies on RGC development involve a heterogeneous mix of RGC types. Indeed, in the few studies that analyzed specific RGC types, it was clear that different types exhibited distinct patterns of refinement as their dendrites became restricted to specific IPL sublaminae (Mumm et al., 2006; Kim et al., 2010; Antinucci et al., 2013). To obtain a more comprehensive view of type-specific dendritic development, we therefore focused on a single, genetically accessible RGC type called J-RGC. Previous studies have analyzed J-RGC function, demonstrating that they are direction-selective, color-opponent, OFF-center RGCs (Kim et al., 2008; Joesch and Meister, 2016). Here, we analyzed the development of five dendritic features that can be related to these adult functions. (1) Dendritic field size: as is the case for RGCs generally, the size and patterning of the J-RGC dendritic arbor determine the size of its receptive field. (2) Dendritic complexity: the pattern of branches within an arbor determines how it samples interneuronal inputs and, thus, the visual field. (3) Dendritic shape: most J-RGCs have asymmetric dendrites that “point” ventrally from the cell body and respond preferentially to upward motion in the visual scene. J-RGCs at the dorsal- and ventral-most poles exhibit symmetric arbors, and are not direction-selective (Kim et al., 2008). This correlation suggests that the ventral asymmetry contributes to the directional preference. (4) IPL lamination: J-RGCs send dendrites to the outermost sublamina of the IPL, where they receive inputs from OFF bipolar cells (Kim et al., 2008). Thus, their laminar restriction renders them OFF-center cells. (5) Synaptic distribution: along with excitatory input from bipolar cells, physiological studies suggest that J-RGCs receive inhibitory synapses from at least one ON amacrine cell type (Joesch and Meister, 2016). The distribution of excitatory and inhibitory synapses is a main determinant of the J-RGC color-opponent receptive field.
We describe cellular mechanisms that lead to ventral asymmetry and IPL lamination, and show that they occur in spatiotemporally distinct patterns. We also show that both excitatory and inhibitory synapses are distributed asymmetrically across the arbor, with formation of inhibitory synapses lagging behind that of excitatory synapses. Finally, we asked whether dendritic form is shaped by the defining molecular feature of J-RGCs, junctional adhesion molecule B (JAM-B; gene name jam2), a transmembrane adhesion and signaling protein. We show that JAM-B is dispensable for many aspects of dendritic morphogenesis, but promotes dendro-dendritic interactions that affect arbor patterning.
Materials and Methods
Mice.
The JAM-B CreER transgenic line has been described previously (Kim et al., 2008). Briefly, the JAM-B CreER transgene was generated from a bacterial artificial chromosome by replacing the translational start site of jam2 with cDNA encoding a ligand-activated Cre recombinase, thereby placing the expression of CreER under regulatory elements of the jam2 gene. Thy1-STOP-YFP line 15 has also been described previously (Buffelli et al., 2003). In animals carrying both transgenes, the administration of tamoxifen results in nuclear localization of CreER, initiating Cre-mediated excision of STOP sequences that terminate transcription and translation, hence driving expression of YFP in J-RGCs. Tamoxifen (150 μg; Sigma-Aldrich) was injected subcutaneously at postnatal day (P)0–P1 except where noted. Bax mice (Knudson et al., 1995) were obtained from Jackson Laboratories.
To provide a second method for accessing and analyzing J-RGCs, we generated a JAM-B Cre knock-in mouse in which the first exon of the endogenous jam2 gene was replaced with the gene encoding Cre recombinase using homologous recombination (Fig. 1A), thereby generating a null allele. A neo cassette was included to allow selection of recombinants. Following transmission of the vector through the germ-line, mice were crossed to a Flpe deletor to remove the frt-flanked neo cassette (Rodriguez et al., 2000). Cre immunostaining and mosaic analysis confirmed that Cre is selectively expressed by J-RGCs in the postnatal retina (Fig. 1B,D).

Design of JAM-B Cre knock-in and Cre-dependent fluorescence AAV with inefficient recombination. A, Design of JAM-B Cre knock-in vector. The gene encoding Cre recombinase replaces the first exon of the jam2 gene. B, Density recovery profile (DRP) of Cre+ soma in JAM-B Cre retinas. Black line indicates mean density; gray shades indicate SEM. Dotted line represents DRP of a random distribution. n = 4 animals, 9 images total. C, AAV construct encoding Cre-dependent YFP flanked by lox sites that recombine inefficiently. D, Cre immunostaining in JAM-B Cre retina, showing sparse labeling indicative of a single type. E, J-RGCs in field shown in D, labeled by AAV shown in C. Scale bar in D and E, 50 μm.
Animals were killed with intraperitoneal injections of sodium pentobarbital followed by cervical dislocation. Animals younger than P10 were killed by cervical dislocation. Animals of either sex were analyzed. All mice were maintained on C57BL/6 and CD1 mixed background. Animals were used in accordance with NIH guidelines and protocols approved by Institutional Animal Use and Care Committee at Harvard University.
Viral design and injections.
A Cre-dependent EYFP adeno-associated virus (AAV) with reduced recombination efficiency was generated using a modification of the strategy introduced by Klinger et al., 2010. The ChR2 sequence was removed from hEf1a-DIO-ChR2 (H134R)-YFP-WPRE plasmid (provided by Karl Deisseroth, Stanford University) by restriction digest. Then the loxP and lox2722 sites were replaced by PCR with lox5172 and lox3373, which recombine inefficiently (Klinger et al., 2010; Fig. 1C). Expression of EYFP is thus restricted to cells with the highest Cre expression, i.e., J-RGCs for JAM-B Cre (Fig. 1D,E).
Histology.
Retinas were fixed in cold 4% PFA in PBS for 1.5 h. Retinas to be sectioned were incubated with 30% sucrose in PBS for at least 2 h, frozen, and cryosectioned at 20 μm thickness. Retinas were oriented dorsoventrally or nasal-temporally using the posterior ciliary artery as an anatomical landmark, allowing us to assess retinal position during analysis. Sections were blocked with 5% normal donkey serum/0.3% Triton X-100/PBS for 30 min, and incubated with primary antibodies in 3% normal donkey serum/0.3% Triton X-100/PBS overnight. After two PBS washes, the sections were incubated with secondary antibodies for 2 h, washed, and mounted in Fluoromount. For whole mounts, retinas were dissected free of sclera, blocked for at least 1 h, incubated in primary antibodies for 5–7 d, and then re-incubated in secondary antibodies overnight. The retinas were then washed with PBS for at least 3–4 h and mounted in Vectashield.
Antibodies used were as follows: chicken anti-GFP (1:1000; Abcam, ab13970), rabbit anti-mCherry (1:5000; Cai et al., 2013), goat anti-choline acetyltransferase (ChAT; 1:400; Millipore, AB144P), guinea pig anti-vesicular acetylcholine transporter (vAchT; 1:500; Millipore, AB1588), mouse anti-PSD95 (ThermoFisher Scientific, MA1-046), mouse anti-gephyrin (1:100; Synaptic Systems, 147-011) and mouse anti-Cre (1:500; Millipore, MAB3120).
RGC ablations.
P0 pups were anesthetized on ice. P10 animals were anesthetized by intraperitoneal injection of ketamine/xylazine, followed by anti-sedan postsurgery. A slit was made in the eyelid and a glass needle was used to mechanically severe RGC axons near the optic disc, without perturbing overall retinal integrity. A fine glass needle was inserted into the eyeball as done for subretinal delivery of DNA for neonatal electroporations (Matsuda et al., 2004). The needle was inserted at an acute angle, bypassing the lens, until pressure was felt on the tip. Once felt, pressure was applied on the needle for 3 s to crush traversing axons. It was then withdrawn. The trajectory of the needle within the eyeball was monitored by a steady stream of blue dye dispensed from the needle. Only lesions confined within each hemi-retina (dorsal or ventral) were considered. Animals were killed at P10–P14 or P20 for ablations at P0 and P10, respectively, and retinas prepared for whole-mount immunostaining. For each ablation site, we analyzed three animals per ablation age.
Biolistic labeling.
Gold particles were coated with plasmids expressing one or combinations of the following: JAM-B-YFP and mCherry under a ubiquitin promoter, or Cre-dependent forms of PSD95-YFP and mCherry-gephyrin under a CMV or CAG promoter. The insertion site for YFP in the JAM-B sequence was selected based on a published scheme in which a fusion of RFP with JAM-C, which is homologous to JAM-B, was shown to be functional (Famulski et al., 2010). Live retinas were dissected free of lens and sclera in Hanks balanced saline solution, flat-mounted on nitrocellulose membranes with ganglion cell side up, and shot with DNA-coated gold particles as previously described (Morgan and Kerschensteiner, 2011). Retinas were cultured in RGC growth medium (Winzeler and Wang, 2013) overnight, fixed in 4% PFA in PBS supplemented with sucrose (Stradleigh et al., 2015), and prepared for whole-mount immunostaining as described above.
Image acquisition and analysis.
Images were obtained with a Olympus FV1000 confocal microscope using 488, 568, and 647 nm lasers. All images were analyzed on ImageJ or Imaris. Gamma and contrast settings of the images were adjusted to make dim features visible, without eliminating background signal. For synaptic tracing, images were acquired at a x-y-z resolution of 0.132 × 0.132 × 0.3 μm. Synapses were traced and analyzed using Imaris software. For some ≥P16 J-RGCs, images were acquired at 0.31 × 0.31 × 0.3 μm. All other images were acquired at a x-y-z resolution of 0.31 × 0.31 × 0.5–2 μm. Single cells were traced and their dendrite lengths obtained using Simple Neurite Tracer on ImageJ or the Filaments function on Imaris. Dendritic field area was calculated by taking convex hull around dendritic arbor. Dendro-dendritic crossovers were determined as dendritic branch overlaps detected in single confocal planes as described by Lefebvre et al. (2012) at an x-y-z resolution of 0.31 × 0.31 × 0.5 μm.
Experimental design and statistical analyses.
All data are presented as mean ± SE unless otherwise stated. Density recovery profiles were generated using winDRP software (Rockhill et al., 2000; Kay et al., 2012). For quantification of proportion of ventral asymmetric J-RGCs, retinas from at least three animals were used for each time point. Only retinas with at least 100 labeled J-RGCs distributed evenly throughout the retina (excluding the dorsal pole) were used for analysis. For quantification at P0, tamoxifen was delivered embryonically to label J-RGCs (n = 3 animals per age, >30 J-RGCs per retina). An asymmetry index (AI) was computed as previously described (Trenholm et al., 2011; Rousso et al., 2016). Magnitudes of AI range from 0 for perfect symmetry to 1 for complete asymmetry (all dendrites pointing in one direction). J-RGCs with majority of dendrites terminating on the ventral side of the soma were considered ventrally asymmetric, regardless of their AI. DV positions of the asymmetry wavefronts were quantified by drawing a boundary between ventrally asymmetric and symmetric J-RGCs, and measuring the distance from the boundary to the dorsal pole relative to that from the dorsal to ventral pole.
To quantify the location of J-RGC dendrites within the IPL, line scans were drawn across the entire depth of the IPL and YFP intensity values across IPL depth obtained using the ImageJ/Analyze/Plot Profile function. Depth values were normalized such that 0% indicates the INL-IPL border and 100%, the IPL-ganglion cell layer (GCL) border. Intensity values were normalized to the maximum intensity within each line scan, yielding arbitrary units. Intensity values were binned for every 5% IPL depth and averaged across samples. J-RGCs within the central third of the retina were classified as central, whereas those outside of this region were classified as peripheral. Data from dorsal, ventral, temporal, and nasal poles were similar to one another and were therefore pooled and classified as peripheral.
Results
Functionally diverse RGC types have dendritic structures that differ in their shape, size, IPL lamination, and arborization patterns (Fig. 2A). These differences obscure developmental programs when RGCs are analyzed as a class. We therefore focused on the development of J-RGCs, choosing this type because its structure, function, molecular composition, and projections have been analyzed in detail (Kim et al., 2008, 2010; Hong et al., 2011; Joesch and Meister, 2016; J. Liu and J.R. Sanes, unpublished observations), enabling us to connect developmental mechanisms to adult features. We visualized J-RGCs in retinal whole mounts from JAM-B CreER × Thy1-STOP-YFP mice that have been treated with tamoxifen at P0, focusing on the period between P2 and P20, over which dendrites mature. Figure 2B–E shows J-RGCs from dorso-central retina and F–I show J-RGCs from the corresponding ventral halves of the same retinas. It was apparent that dendritic morphology differed between these regions during the first postnatal week; we explore the source of these differences below.

Developing J-RGCs in the postnatal retina. A, Diversity of RGC morphologies in lamination and planar arborization. Cell in the middle is a J-RGC. It is flanked by a large ON α RGC to the left and a W3B RGC to the right (Sanes and Masland, 2015). B–E, Individual J-RGCs from the dorsal half of the retinas at P2, P8, P14, and P20. F–I, Individual J-RGCs from the corresponding ventral halves of the retinas shown in B–E. Insets, Retinal outlines with position of each J-RGC indicated by asterisk. All retinas are oriented dorsal-up (D), ventral-down (V). Scale bars, 50 μm.
J-RGC dendritic growth is accompanied by refinements in the arborization pattern
We began by examining overall dendritic arbor size, which determines the size of the J-RGC receptive field center. The area of the J-RGC dendritic arbor increased from 5220 ± 785 μm2 at P2 (the earliest time analyzed) to 27050 ± 1199 μm2 at P14, the age of eye-opening (one-way ANOVA, p = 4.46 × 10⁻⁷, F(4,10) = 63.7; Tukey-Kramer test, p = 5.32 × 10⁻³ and 3.08 × 10⁻⁴ for P2 vs P8 and P8 vs P14, respectively), after which minimal change occurred (Tukey-Kramer test, p = 0.311 and 0.0625 for P14 vs P20 and P20 vs P50, respectively; Fig. 3A). Likewise, the total dendrite length increased from 577 ± 83 μm at P2 to 3780 ± 316 μm at P14 (one-way ANOVA, p = 2.33 × 10⁻⁶, F(4,10) = 44.9; Tukey-Kramer test, p = 8.28 × 10⁻³ and 1.51 × 10⁻⁴ for P2 vs P8 and P8 vs P14, respectively), and changed minimally thereafter (Tukey-Kramer test, p = 0.273 and 0.532 for P14 vs P20 and P20 vs P50, respectively; Fig. 3B).

Changes in J-RGC dendritic properties with age. A, J-RGC dendritic field area. One-way ANOVA, p = 4.46 × 10⁻⁷, F(4,10) = 63.7; Tukey-Kramer test, p = 0.00532, 0.000308, 0.311, and 0.0625 for P2 vs P8, P8 vs P14, P14 vs P20, and P20 vs P50, respectively. B, Total dendrite length. One-way ANOVA, p = 2.33 × 10⁻⁶, F(4,10) = 45.0; Tukey-Kramer test, p = 0.00828, 0.000151, 0.273, and 0.532 for P2 vs P8, P8 vs P14, P14 vs P20, and P20 vs P50, respectively. C, Dendrite length per 100 μm2 of dendritic field area. One-way ANOVA, p = 0.145, F(4,10) = 2.17. D, Number of dendritic branchpoints. One-way ANOVA, p = 0.435, F(3,10) = 0.993. E, Number of dendro-dendritic crossovers within individual J-RGCs. One-way ANOVA, p = 8.50 × 10⁻⁷, F(3,10) = 63.0; Tukey-Kramer test, p = 0.00978, 0.000107, and 0.999 for P8 vs P14, P14 vs P20, and P20 vs P50, respectively. A–E, n = 3–5 animals per age, 2–4 cells per animal. Open circles represent individual cells, bar represents mean, and bracket represents SEM.
We then asked how dendrites fill the area they encompass. Total dendritic length increased in parallel with arbor area; thus dendrite length per unit area did not change significantly from P2 to P50 (one-way ANOVA, p = 0.145, F(4,10) = 2.17; Fig. 3C). The number of dendritic branch points remained stable between P8 (43.2 ± 1.3) and P50 (42.7 ± 2.89; one-way ANOVA, p = 0.435, F(3,10) = 0.993; Fig. 3D; we were unable to count branch points accurately at P2). On the other hand, dendro-dendritic crossovers, a commonly used measure for dendritic self-avoidance and space-filling (Lefebvre et al., 2012), decreased ∼60% between P8 (98.1 ± 2.20) and P20 (42.6 ± 3.05; one-way ANOVA, p = 8.50 × 10⁻⁷, F(3,10) = 63.0; Tukey-Kramer test, p = 9.78 × 10⁻³ and 1.07 × 10⁻⁴ for P8 vs P14 and P14 vs P20, respectively; Fig. 3E). No further changes occur thereafter (Tukey-Kramer test, p = 0.999 for P20 vs P50). Thus, J-RGC dendrites increase in size and refine their form with age.
J-RGCs become ventrally asymmetric in a dorsoventral wave
Approximately 85% of J-RGCs have dendrites that are strikingly asymmetrical in two respects (Fig. 4A). First, their arbors cover only a narrow sector, in contrast to most RGCs, which have radially symmetrical arbors. Second, J-RGC arbors extend ventrally. This structural asymmetry is correlated with their selective responsiveness to stimuli that move along the retina in a dorsal-to-ventral direction, which corresponds to upward motion in the world. The remaining 15% comprises symmetric J-RGCs located at the dorsal and ventral poles (Fig. 4B; Kim et al., 2008).

J-RGC dendrites become ventrally asymmetric in a dorsoventral wave. A, A typical J-RGC from central retina with ventrally asymmetric dendrites. B, A symmetric J-RGC from ventral retina. C, A J-RGC with a dominant ventral component and a minor dorsal component to its dendritic arbor. A–C, J-RGCs are between ages P6 and P10 and oriented dorsal-side up, ventral-side down. D, Mean AI of J-RGCs across postnatal development. n = 3 animals per age; 64–124 J-RGCs per retina. E, Proportion of ventrally asymmetric J-RGCs across postnatal ages. n = 3 animals per age; >30 J-RGCs per retina from P0 to P1, >100 J-RGCs per retina from P2 onward. F–H, Polar plot representing AIs of individual J-RGCs across a representative retina at P2, P8, and P14. Each red line represents AI of a single J-RGC. Length and orientation of each line represent degree (0 = symmetric, 1 = completely asymmetric) and direction of asymmetry respectively. I–K, Dendritic orientations of J-RGCs across the whole retina at P2, P8, and P14. Green arrows mark ventrally asymmetric J-RGCs and their dendritic direction. Purple asterisks mark J-RGCs with symmetric or radial dendrites. Yellow dotted lines represent boundaries between asymmetric J-RGCs and symmetric J-RGCs at the dorsal pole (line a) or the ventral pole (line b). L, Dorsoventral positions of boundaries segregating symmetric and asymmetric J-RGCs at the dorsal (top trace, line a) and ventral pole (bottom trace, line b). n = 3 animals per time point. Scale bars: A–C, 50 μm.
To find out whether J-RGC dendrites become restricted to a narrow sector via biased initial outgrowth or by a later process of dendritic remodeling, we analyzed J-RGCs over early postnatal development. We found that dendrites of some J-RGCs initially radiated in various directions, spanning a broad angle about their soma (Figs. 4C, 2F). They then became fully asymmetric over the following 2 weeks (Figure 2G–I). Accordingly, their degree of asymmetry (AI) increased with age (one-way ANOVA, p = 2.33 × 10⁻³, F(2,6) = 19.6; Fig. 4D).
Direct inspection of whole-mount retinas indicated that the majority of J-RGCs, regardless of their degree of asymmetry pointed ventrally (Fig. 4A,C). Accordingly, the proportion of ventrally asymmetric J-RGCs increased over the first two postnatal weeks, until it plateaued at ∼85% (Fig. 4E). Polar plots of AI for individual J-RGCs across a retina at each age show the coordinated change in both the degree (length of lines) and direction (orientation of lines) of asymmetry (Fig. 4F–H). At P2, J-RGCs across the retina were highly variable in both the degree and direction of asymmetry, as illustrated by the varying magnitudes and orientations of AI for isolated J-RGCs across the retina (Fig. 4F). This variability decreased with age, with more J-RGCs pointing ventrally, and to a greater degree (Fig. 4G,H). By P14, most J-RGCs were highly asymmetric in the ventral direction (Fig. 4H). Thus, J-RGCs initially construct radial dendritic arbors that are later sculpted into ventrally asymmetric ones.
As noted above, symmetric J-RGCs are confined to the dorsal and ventral margins in the adult retina. To determine how this topography is generated, we mapped the positions of symmetric and asymmetric J-RGCs across the whole retina at various ages. We found that dorso-central J-RGCs were the first to become ventrally asymmetric (Fig. 4I). The boundary segregating asymmetric J-RGCs from the symmetric ones in ventral retina then moved ventrally over the following 2 weeks until the mature proportion was attained at P14 (Fig. 4J–L). In contrast, the border between symmetric and asymmetric J-RGCs at the dorsal pole changed little in latitude (Fig. 4I–L). Hence, J-RGC asymmetry develops in a protracted dorsoventral wave. Because retinal development generally proceeds in a center-to-periphery wave (Young, 1985; Rapaport et al., 2004; Hufnagel et al., 2010), the dorsoventral wave is likely a type-specific trait of J-RGCs.
Asymmetric growth and pruning generate ventrally asymmetric J-RGC arbors
How do radial dendritic arbors become ventrally asymmetric? Likely possibilities include selective growth of ventrally directed dendrites and selective pruning of dendrites pointing in other directions. Indeed, we observed intermediate forms with predominantly ventral dendrites and a minor dorsal component in 1-week-old retinas, suggestive of selective pruning and elaboration (Figs. 2G, 4C). We therefore quantified the dorsal and ventral contributions to total dendritic length at two ages: P6, when the dorsoventral wave in asymmetry is still in progress, and P14, after mature topography had been established. During this interval, the asymmetry wave traverses the centro-ventral region of the retina, so we focused on J-RGCs within this zone. From P6 to P14, dorsal dendritic length decreased by more than threefold, whereas ventral dendritic length increased by more than twofold (one-way ANOVA, p = 3.36 × 10⁻⁶, F(3,10) = 47.0; Fig. 5A). Thus, dendrites pointing in the ventral direction are preferentially extended, whereas those pointing in other directions are selectively pruned.
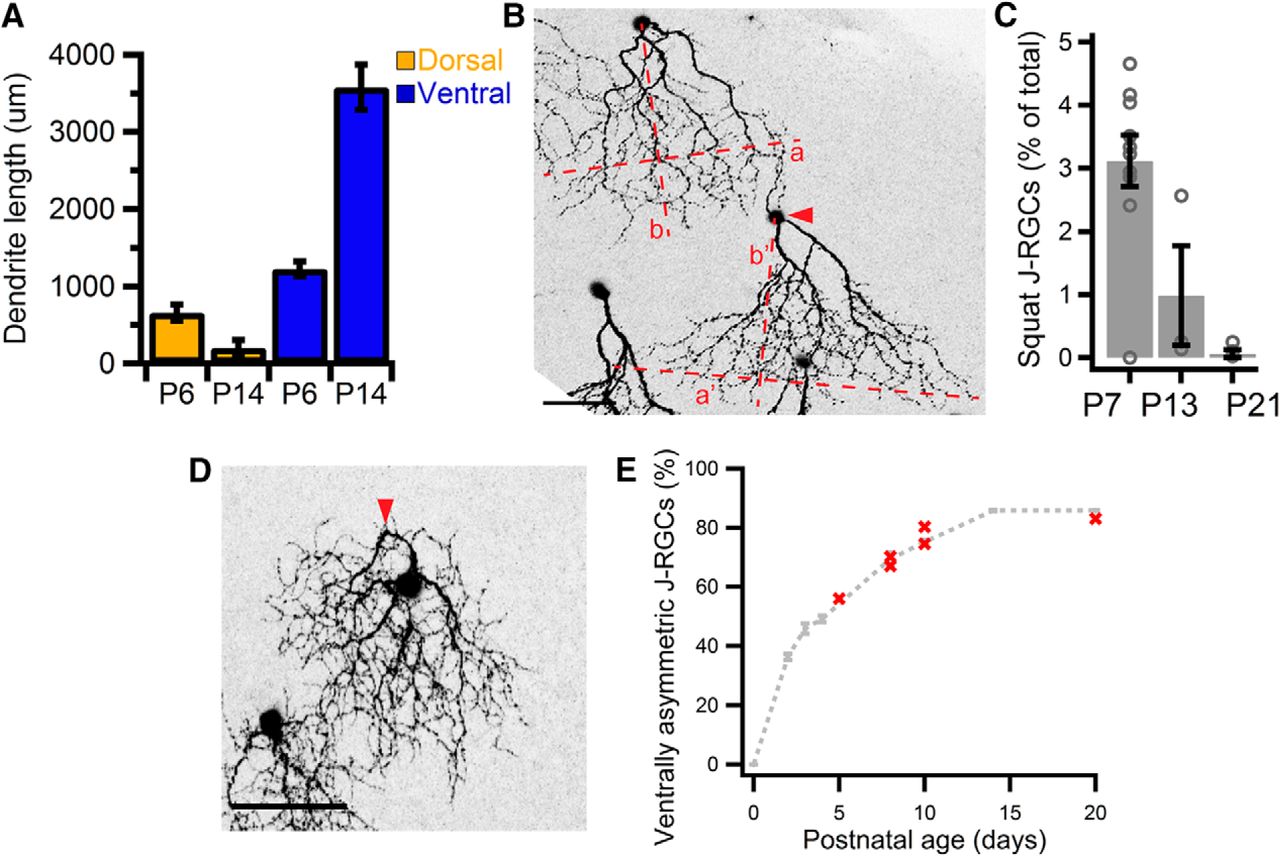
Mechanisms underlying development of ventral asymmetry in J-RGCs. A, Dorsal and ventral components of dendritic length of J-RGCs in centro-ventral retina at P6 versus P14. One-way ANOVA, p = 3.37 × 10⁻⁷, F(3,10) = 47.0. P6, n = 7 animals, 15 cells; P14, n = 3 animals, 9 cells. B, A squat J-RGC (arrowhead) with a wider and shorter dendritic arbor next to a canonical J-RGC at P11. a or a′ indicate dendritic width, whereas b or b′ indicate height perpendicular to width in canonical or squat J-RGC respectively. a/b = ∼1, a′/b′ = ∼2. C, Frequency of squat J-RGCs with age. One-way ANOVA, p = 0.00212, F(2,13) = 10.3. n = 9, 3, and 4 animals for P7, P13, and P12, respectively. Open circles represent individual retinas, bar represents mean, and bracket represents SEM. D, P7 J-RGC displaying a kink (arrowhead) in its primary dendrites. E, Proportion of ventrally asymmetric J-RGCs in JAM-B CreER × Thy1-STOP-YFP × bax−/− retinas at various ages. Each red point represents a single animal. Dashed line, showing development of asymmetry in controls, is replotted from Figure 1J. Scale bars: B, D, 50 μm.
A related mechanism is the selective pruning of lateral extensions, suggested by the increase in asymmetry with age as documented in Figure 4D. In line with this idea, a small fraction of J-RGCs in young retinas had a “squat” morphology characterized by an unusually high aspect ratio (width–height: ∼2, compared to ∼1 in canonical J-RGCs; Fig. 5B); the frequency of these cells decreased with age (one-way ANOVA, p = 2.12 × 10⁻³, F(2,13) = 10.3; Fig. 5C).
Some cells at the boundary between symmetric and asymmetric J-RGCs bore kinks in their primary dendrites (Fig. 5D). Reorientation of primary dendrites and/or soma translocation could generate such a morphology. The latter is unlikely for two reasons. First, tangential dispersion of RGCs happen around day of birth, whereas the asymmetry wave occurs over 2 weeks (Reese et al., 1999). Second, most RGCs migrate <30 μm (Reese et al., 1999), which is insufficient to shift dendrites to the ventral side of the soma. Therefore, reorientation of primary dendrites is the more likely contributor to the emergence of ventral asymmetry.
The development of ventral asymmetry coincides with the period of programmed cell death among RGCs in the postnatal retina (Young, 1985). To find out whether J-RGCs that fail to remodel appropriately are eliminated, we examined the proportions of ventrally asymmetric J-RGCs in retinas where programmed cell death has been genetically blocked by deletion of the proapoptotic gene, bax (Knudson et al., 1995). In each of six animals, the proportion of ventrally asymmetric J-RGCs in bax mutants was similar to that in age-matched controls (Fig. 5E). Thus, ventral asymmetry for J-RGCs is achieved via apoptosis-independent mechanisms.
In summary, selective ventral growth, selective pruning, and reorientation of dendrites pointing in other directions (dorsal or lateral) all contribute toward generating a ventrally directed arbor, whereas soma translocation and elimination of symmetric cells are less likely to be involved.
Orientation of J-RGC dendrite arbors are influenced by non-cell autonomous mechanisms
To test the role of interactions among RGCs on the development of ventral asymmetry in J-RGCs, we locally ablated axons of RGCs at P0, leading to the death of the injured cells (Perry and Linden, 1982). We then examined the dendrites of J-RGCs adjacent to the lesion ∼10 d later. If asymmetry is largely an intrinsic program, surrounding J-RGCs should retain their characteristic ventral asymmetry. Conversely, if ventral asymmetry is affected by neighboring RGCs, the ablations should perturb the topography of ventrally asymmetric versus symmetric J-RGCs.
We mapped the ablation site by staining for the pan-RGC marker RBPMS (Fig. 6A), and established normal retinal integrity by the presence of a mosaic organization of starburst amacrine cells within the ganglion cell layer (Fig. 6B,C). Thus, axotomy led to death of RGCs without a global perturbation of retinal architecture. Remarkably, ablation of RGCs in the ventral half of P0 retinas induced reorientation of dendrites from J-RGCs at the ventral edge of the ablation (Fig. 6D,E). The effect was position-dependent, however, dorso-central ablations failed to induce dendritic remodeling from J-RGCs ventral to the lesion and J-RGCs on the dorsal edge of both ventral and dorsal ablations pointed ventrally (Fig. 6D,E). One interpretation is that ventral J-RGCs, which become ventrally asymmetric last, retain the capacity to undergo dramatic dendritic remodeling, whereas dorsal J-RGCs, which are the first to attain ventral asymmetry, lose the ability to do so. Consistent with this idea, ablations performed at P10 did not alter the asymmetry of J-RGC dendrites regardless of their location (Fig. 6D,E), indicating that J-RGCs are amenable to large-scale dendritic remodeling only within a restricted temporal window.

Non-cell autonomous mechanisms in shaping ventral asymmetry of J-RGCs. A, En face view of GCL showing immunostaining of RBPMS, a pan-RGC marker. Absence of RBPMS+ cells demonstrates specific and local ablation of RGCs. B, ChAT immunostaining showing regular arrangement of starburst amacrine cells in ganglion cell layer within ablation site. b.v. indicates space occupied by blood vessels. C, J-RGC dendrites in boxed region in A and B. Top, Composite image. Bottom, GFP channel alone showing J-RGC dendrites. J-RGCs at the dorsal edge of the ablation site always retain ventral-pointing dendrites regardless of the location of ablation. Scale bars, 25 μm. D, Whole-mount view of J-RGCs surrounding local RGC ablations within ventral or dorsal retina at P0 or P10, analyzed 10 d post-ablation. Yellow boxes mark J-RGCs on the ventral edge of the ablation, shown to the right as close-up images. n = 3 animals per location per time point. Scale bars, 50 μm. C, D, Orange lines indicate edge of ablation. E, Proportion of J-RGCs that reoriented their dendrites toward ablation site. D, Dorsal ablation; V, Ventral ablation. P0 and P10 refer to age at which ablations were performed. Only ventral ablations done at P0 induce reorientation.
J-RGC dendritic lamination within the IPL develops in a centrifugal wave
The IPL can be divided into multiple sublaminae; we follow the convention of distinguishing five divisions, s1–s5. Dendrites of each RGC type are confined to one or a few sublaminae, restricting the types of interneurons from which they receive synapses and thereby shaping their function (Roska and Werblin, 2001). Most notably, ON and OFF bipolar cell axons arborize in the inner and outer sublaminae, respectively, generating predominantly ON responses in RGCs with dendrites in s4–s5 and OFF responses in RGCs with dendrites in s1–s2; many RGCs with dendrites in s3 have both ON and OFF responses (Famiglietti and Kolb, 1976; Euler et al., 2014). J-RGC dendrites arborize within the outermost sublamina, s1, and are therefore OFF cells (Kim et al., 2008).
To ask how J-RGC dendrites become restricted to s1, we immunostained retinal cross-sections in which J-RGCs had been genetically labeled with GFP, using calbindin (CALB) or ChAT as s2 and s4 laminar markers. J-RGC dendrites extended toward the outer half of the IPL from the onset of dendritic outgrowth. As early as P2, dendritic tips were concentrated in the outer half of the IPL, in which the prospective s1 would be located. By P6, J-RGC dendrites had become restricted to s1 (Fig. 7A). Thus, dendritic outgrowth in J-RGCs is biased toward the OFF half of the IPL from the outset but becomes restricted to the outermost stratum during the first postnatal week.

J-RGC dendritic lamination develops in a rapid center-to-periphery wave. A, Lamination of J-RGCs in central retina from P2 to P14 and J-RGCs in peripheral retina at P4 and P6. Scale bar, 25 μm. J-RGCs are in green, CALB or ChAT in magenta. B, Normalized GFP intensities across IPL depth of central versus peripheral J-RGCs at P4. χ2 test, p = 4.47 × 10⁻⁵. n = 3 animals, 9 sections. C, Normalized GFP intensities across IPL depth of central versus peripheral J-RGCs at P6. χ2 test, p = 0.0212. n = 3 animals, 27 sections. B, C, Bold lines represent mean values. Faded shades indicate SEM. D, Model showing alternate developmental pathways toward the mature dendritic structure of a J-RGC.
We also asked whether laminar restriction occurs simultaneously across the retina. Contrary to the dorsoventral wave of asymmetry development, laminar specification occurred in a centrifugal wave that paralleled the wave of differentiation for most retinal cells (Young, 1985; Rapaport et al., 2004; Hufnagel et al., 2010). At P4, dendrites of J-RGCs located within the central retina became restricted to the outermost IPL sublamina, whereas those at the periphery remained diffuse (χ2 test, p = 4.47 × 10⁻⁵; Fig. 7A,B). Within 2 days, dendrites of J-RGCs within the peripheral retina had become lamina-restricted (χ2 test, p = 0.0212; Fig. 7A,C).
Together, these results imply that J-RGCs undergo different sequences of dendritic development depending on their location within the retina. Dorsal J-RGCs attain ventral asymmetry before becoming lamina-restricted, whereas ventral J-RGCs attain s1 lamination before ventral asymmetry (Fig. 7D). Thus, distinct mechanisms operate within different dimensions of dendritic morphogenesis in J-RGCs.
Inhibitory synapses are asymmetrically distributed across the J-RGC dendritic arbor
Before analyzing when synapses form on J-RGC dendrites, we first established the pattern of synapses on mature J-RGCs. We used a biolistic method to transfect J-RGCs with Cre-dependent plasmids encoding fluorescently tagged PSD95 and gephyrin, which mark excitatory and inhibitory synapses, respectively. This method has been verified by electron microscopy and electrophysiology (Morgan et al., 2008; Bleckert et al., 2014).
For these studies, we generated a JAM-B Cre knock-in mouse line in which J-RGCs express Cre rather than CreER, allowing selective labeling of J-RGCs without the use of tamoxifen (see Materials and Methods; Fig. 1A). We used the fluorescent tags on each synaptic marker as a proxy for the locations of each type of synapse. We found that excitatory and inhibitory synapses are differentially distributed across the J-RGC arbor (Fig. 8A,D). Excitatory synapses were largely excluded from dendrites ascending through the IPL but were otherwise distributed evenly throughout the arbor within s1 (Fig. 8B,E). In contrast, inhibitory synapses are denser on proximal dendrites, including portions that ascend through the IPL, compared with distal dendrites (Fig. 8C,F). Together, these distributions result in an I–E ratio that was higher on proximal dendrites than on distal dendrites (Mann–Whitney test, p = 5.83 × 10⁻⁴; Fig. 8G–I).

Synapses are non-uniformly distributed along J-RGC dendrites. A, En face view of synapse distributions in a P21 J-RGC. B, C, Distribution of excitatory and inhibitory synapses, respectively, throughout dendritic arbor of a J-RGC in A. Highlighted regions represent proximal (top) and distal (bottom) thirds of the dendritic arbor. Brackets indicate portions of dendrites that are ascending through the IPL. Scale bars, 20 μm. D–F, Side views of A–C, respectively. G, Number of synaptic puncta on proximal third of P14 J-RGC dendritic arbors. Mann–Whitney test, p = 0.00233. H, Number of synaptic puncta on distal third of P14 J-RGC dendritic arbors. Mann–Whitney test, p = 0.0262. I, I–E ratio on proximal versus distal dendrites. Mann–Whitney test, p = 0.000583. G–I, Each line represents data from a single J-RGC. n = 6 cells from 3 retinas.
Inhibitory synaptogenesis preferentially occurs on proximal dendrites
The asymmetry in synaptic distribution may be the result of preferential inhibitory synaptogenesis on proximal dendrites or selective synaptic pruning on distal dendrites. To distinguish between these alternatives, we mapped synaptic sites on dendrites of ventrally asymmetric J-RGCs from P7, when excitatory synaptogenesis has just commenced (Morgan et al., 2008; Hoon et al., 2014), until P14, when eye opening occurs.
At P7, most inhibitory synapses were present on proximal dendrites, whereas excitatory synapses were distributed throughout the arbor (Fig. 9A,B). This asymmetric distribution persisted with age (Fig. 9A,C). The I–E ratio on the proximal third of the dendritic arbor showed a greater increase with age compared with that on the distal dendrites (one-way ANOVA, p = 8 × 10⁻¹⁵, F(5,36) = 40.6; Tukey-Kramer test, p = 1.20 × 10⁻⁷ and 0.140 for P7 vs P10 on proximal and distal dendrites, respectively; p = 0.0555 and 0.876 for P10 vs P14 on proximal and distal dendrites, respectively), consistent with preferential inhibitory synaptogenesis on proximal dendrites (Fig. 9D). Overall, I–E ratio increased with age (one-way ANOVA, p = 2.62 × 10⁻⁸, F(2,18) = 53.6; Fig. 9E). Thus, inhibitory synaptogenesis preferentially occurs on proximal dendrites, generating the skewed inhibitory synapse distribution on the mature J-RGC dendritic arbor.

Inhibitory synaptogenesis lags behind excitatory synaptogenesis. A, Excitatory (green puncta) and inhibitory (magenta puncta) synaptic sites in P7, P10, and P14 J-RGCs. Scale bars: 30 μm; insets, 2 μm. B, Synapses on proximal and distal dendrites in P7 J-RGCs. Scale bars, 4 μm. C, Synapses on proximal and distal dendrites in P14 J-RGCs. Scale bars, 4 μm. D, Changes in I/E ratio on proximal versus distal dendrites from P7 to P14. One-way ANOVA, p = 8 × 10⁻¹⁴, F(5,36) = 40.6. E, Overall I/E ratio at each age. One-way ANOVA, p = 2.62 × 10⁻⁸, F(2,18) = 53.6. F, Total number of excitatory (green) and inhibitory (magenta) synapses on J-RGCs across age. G, Overall inhibitory and excitatory synapse densities at P7 versus P14. Mann–Whitney test, p = 0.284 and 0.00155 for excitatory and inhibitory synapses, respectively. n = 3 animals per age, 10, 12, 6, and 3 cells for P7, P10, P14, and >P16, respectively.
Inhibitory synaptogenesis lags behind excitatory synaptogenesis
Both excitatory and inhibitory synapse numbers increased with age and plateaued by P14, with similar numbers of both synaptic types at maturity (Fig. 9F). However, increases in the two synaptic types occurred with different kinetics. At P7, ∼50% of the final number of excitatory synapses is observed compared with ∼3% for inhibitory synapses (Fig. 9F). Parity resulted from a rapid increase in the number of inhibitory synapses over the following week. When normalized to dendritic length, the increase in the density of inhibitory synapses was striking between P7 and P14 (Mann–Whitney test, p = 0.00155), whereas excitatory synapse density changed modestly if at all (Mann–Whitney test, p = 0.284; Fig. 9G). Thus, unlike many other retinal neurons (for review, see Hoon et al., 2014), inhibitory synaptogenesis on J-RGCs lags behind excitatory synaptogenesis.
JAM-B promotes dendro-dendritic interactions within J-RGCs during development
The defining molecular marker of J-RGCs, JAM-B, is a member of the Ig superfamily (IgSF), whose members are known to function as cell adhesion molecules (Bazzoni, 2003). Because other members of the IgSF have been implicated in dendritic development (Yamagata and Sanes, 2008, 2012; Yamagata et al., 2002; Peng et al., 2017), we asked whether the same was true for JAM-B.
We first attempted to localize JAM-B immunohistochemically with commercially available and custom-generated antibodies, but none proved suitable due to poor signal-to-noise. We therefore generated a YFP-tagged JAM-B expression plasmid and introduced it into J-RGCs using biolistics. Punctate fluorescence was detected throughout the soma and dendrites but it was not uniformly distributed. Fewer than 10% of excitatory or inhibitory synaptic puncta but >80% of dendro-dendritic crossovers (Fig. 3E; see Materials and Methods) colocalized with JAM-B (Fig. 10A–D).

JAM-B promotes dendro-dendritic interactions within individual J-RGCs. A, J-RGC biolistically transfected with YFP-tagged JAM-B and mCherry as a cytosolic fill. JAM-B is distributed in a punctate manner along the dendrites. B, C, J-RGC biolistically transfected with fluorescently-tagged PSD95 or gephyrin, respectively. D, Frequency of colocalization of PSD95, gephyrin and dendro-dendritic crossovers with JAM-B puncta. E, F, Single-cell reconstruction of a control or JAM-B mutant J-RGC labeled by the Cre-dependent fluorescence AAV with inefficient recombination, or Brainbow. Scale bars, 30 μm. G, Number of dendritic crossovers in control versus JAM-B mutant J-RGCs between the ages of P36 and P55. n = 9–11 Het and 5–6 KO retinas, 22 and 13 J-RGCs, respectively. Open circles indicate single cells, error bars indicate SEM. Two-tailed Student's t test. ***p = 0.00155. H, I, Lamination of control and JAM-B mutant J-RGCs. Scale bars, 25 μm. J–L, Dendritic area, number of branchpoints and dendritic length in control versus JAM-B mutant J-RGCs. Measurements were made from the same set of J-RGCs as those in G. Two-tailed Student's t test; n.s. = not significant. p = 0.372, 0.956, and 0.287 for area, branchpoints, and length, respectively. M, Change in synapse number with age in JAM-B knock-out. Control points are redrawn from Figure 9F. χ2 test for trend, p = 0.187. n = 4–9 animals per age.
To test whether JAM-B is involved in dendritic morphogenesis, we analyzed J-RGCs in the JAM-B Cre line, which is a null allele (Fig. 1A). Although Cre is selectively expressed by J-RGCs in this line (Fig. 1D), multiple retinal types are labeled when JAM-B-Cre mice are crossed with Cre-dependent transgenic fluorescent reporters, presumably due to low levels of Cre in other cell types (data not shown). We therefore generated a Cre-dependent fluorescent AAV reporter that recombines inefficiently to restrict labeling to cells with the highest levels of Cre, i.e., J-RGCs (Fig. 1C,E). We complemented these data with J-RGCs labeled by a Brainbow AAV (Cai et al., 2013).
As reported previously for another strongly hypomorphic allele (Sakaguchi et al., 2006; Arcangeli et al., 2011), our JAM-B null mutants were viable and fertile. We detected no defects in overall retinal architecture, IPL organization, or mosaic spacing of retinal neurons. Guided by the subcellular localization of JAM-B, we then assessed dendro-dendritic crossovers. JAM-B mutant J-RGCs had fewer crossovers compared with age-matched control J-RGCs (p = 0.00155, two-tailed t test; Fig. 10E–G). In contrast, other dendritic features of J-RGCs such as ventral asymmetry, restricted lamination, area, length, and number of branchpoints were unaffected by deletion of jam2 (Fig. 10E,F,H–L). Synaptogenesis and the numbers of synapses were also unaffected (χ2 test for trend, p = 0.187; Fig. 10M). Thus, JAM-B plays a specific role in the arrangement of dendrites in J-RGCs.
Finally, we asked whether JAM-B is required during development to promote dendritic interactions. To label developing J-RGCs in the JAM-B Cre knock-in, we transfected J-RGCs biolistically with mCherry to reveal their dendrites. JAM-B mutant J-RGCs had fewer dendro-dendritic crossovers than control J-RGCs by P10 (two-tailed Student's t test, p = 0.0127), indicating that JAM-B is required early to promote dendro-dendritic interactions during postnatal development (Fig. 11A,B).

JAM-B promotes dendro-dendritic interactions during postnatal development. A, Developing J-RGCs from control and JAM-B mutant retinas that were biolistically transfected with mCherry and cultured overnight to reveal dendritic morphologies of J-RGCs. Scale bars, 25 μm B, Number of dendro-dendritic crossovers in J-RGCs from indicated ages. Two-tailed Student's t test, p = 0.0127, 0.0249, and 0.0115 for Het vs KO at P10, P14, and P20, respectively. C, Model illustrating the role of JAM-B in shaping dendritic arrangement within each J-RGC. D, Model proposing a role for JAM-B in mediating adhesion between dendrites from different J-RGCs.
Discussion
Neuronal types vary dramatically in their dendritic size, shape and patterning, as well as synaptic distributions. All of these features affect neural information processing, and are therefore crucial determinants of neuronal function. Thus, one main way that developmental programs lead to adult neuronal function is by regulating dendritic morphogenesis.
The aim of our study was to elucidate the cellular mechanisms that pattern functionally important features of the dendritic arbor. To this end, we focused on a single RGC type, the J-RGC. We chose it because its visual responses have been studied in detail (Kim et al., 2008, 2010; Joesch and Meister, 2016) and it is genetically accessible. We examined the development of five morphological features in J-RGCs that correlate with their physiological properties: dendritic arbor size, dendritic pattern, ventral asymmetry, lamination and synaptic distributions. We show that (1) dendritic growth is accompanied by refinement in dendritic form; (2) dendritic morphogenesis can be dissociated into independent spatiotemporal components; (3) J-RGCs vary by location in their capacity for dendritic remodeling; (4) inhibitory synaptogenesis occurs preferentially at proximal dendrites and, unusually, lags behind excitatory synaptogenesis; and (5) JAM-B affects dendritic arrangement by promoting dendro-dendritic interactions.
Developmental mechanisms
We found that ventral asymmetry is generated by directed outgrowth and selective pruning, whereas lamination results from the refinement of an initially diffuse arbor into a planar one that is restricted to the outermost IPL. Strikingly, the spatiotemporal patterns in these two dimensions differ. Whereas asymmetry develops in a protracted dorsoventral wave, lamination develops in a rapid center-to-periphery wave. These distinctions indicate that different developmental mechanisms are likely involved in the generation of asymmetry and lamination.
For ventral asymmetry, one attractive possibility is that dendritic growth is patterned by a dorsoventral gradient of a guidance molecule, akin to a morphogenetic gradient (Gurdon and Bourillot, 2001). The gradient could be a ventral-high to dorsal-low attractant or a repellent in the reverse gradient. A precedent for the former is the chemoattractant semaphorin 3A, which is produced near the cortical pia and attracts apical dendrites of cortical pyramidal neurons (Polleux et al., 2000). In either case, the symmetry of J-RGCs at the dorsal and ventral margins could result from their inability to respond when levels of the factors are too low or saturating (as would be the case for dorsal and ventral J-RGCs respectively in response to a ventral-high attractant). Similarly, J-RGCs in the central retina could become ventrally asymmetric in response to spatial shifts in gradients of the guidance factor as the retina expands in size with age, setting up a dorsoventral wave in the development of ventral asymmetry. Indeed, several candidate guidance molecules have been reported to be present in dorsoventral gradients across the developing retina. They include retinoic acid (Alfano et al., 2011), BMP (Liu et al., 2003), Ephs, ephrins (Mann et al., 2002), and thyroid hormone (Roberts et al., 2006).
An alternative mechanism for ventral asymmetry is an interaction among J-RGCs mediated by planar cell polarity mechanisms, which are known to operate in both neural and non-neural tissue (Butler and Wallingford, 2017). In this scenario, polarized distribution of proteins in one J-RGC would trigger reorganization of planar cell polarity proteins in J-RGCs ventral to it, stimulating asymmetric growth and pruning. The aberrant asymmetry of J-RGCs at the ventral edge of an early RGC lesion within the ventral retina (Fig. 6D) is consistent with this model, as these J-RGCs would receive contacts from dorsal but not ventral neighbors. However, similar ablations conducted in rats suggested that the reorientation of RGC dendrites toward an ablation site may not be cell-type-specific (Perry and Linden, 1982).
The laminar targeting of J-RGCs might also be instructed by a graded cue(s) along the depth of the retina. However, the initial bias of dendrites to the outer half of the IPL raised the possibility of molecular recognition between J-RGC dendrites and cues within a proto-IPL. Indeed, for several retinal neuronal types, cadherins, semaphorins, and members of the IgSF have been shown to mediate such intercellular interactions (Duan et al., 2014; Krishnaswamy et al., 2015; Matsuoka et al., 2011; Sun et al., 2013; Yamagata and Sanes, 2008; Peng et al., 2017; J. Liu and J.R. Sanes, unpublished observations).
The developmental mechanisms reported in this study are likely to be specific to J-RGCs. Another ventrally asymmetric RGC type, called Hb9-GFP, attain ventral asymmetry in a center-to-periphery gradient (data not shown) that is reminiscent of overall retinal development. Other RGC types also display type-specific developmental patterns of dendritic lamination as previously reported (Kim et al., 2010).
Role of JAM-B in dendritic patterning
JAM-B is an adhesion molecule of the IgSF that participates in cell–cell interactions throughout the body (Bazzoni, 2003). Within the retina, it is expressed in photoreceptors as well as J-RGCs. JAM-B has been implicated in tight junction formation, cell polarity and myocyte fusion (Aurrand-Lions et al., 2001; Ebnet et al., 2003; Powell and Wright, 2011). To date, however, the only known function of JAM-B in the nervous system is inhibition of myelination (Redmond et al., 2016).
The role of JAM-B in J-RGC dendritic morphogenesis is subtle but intriguing: in the absence of JAM-B, dendrites from a J-RGC undergo fewer dendro-dendritic crossovers (Fig. 10F). Self-crossing has been previously used as a measure of self-avoidance, a phenomenon in which sibling dendrites that arise from the same neuron repel one another (Lefebvre et al., 2012; Zipursky and Grueber, 2013). Mediators of self-avoidance in vertebrates include protocadherins, Dscam, and semaphorins (Fuerst et al., 2009; Lefebvre et al., 2012; Matsuoka et al., 2012). In J-RGCs, JAM-B appears to have the opposite effect, promoting self-crossing. It is therefore tempting to speculate that JAM-B mediates adhesive interactions, thereby counteracting self-avoidance to generate appropriate levels of dendritic complexity (Fig. 11C).
The binding partner of JAM-B may very well be JAM-B itself: it has been previously shown that JAM-B participates in homophilic interaction at cell–cell contacts and in in vitro assays (Cunningham et al., 2000; Aurrand-Lions et al., 2001). JAM-B is also capable of heterophilic interaction with other JAM family members, such as JAM-C as well as integrins (Arrate et al., 2001; Cunningham et al., 2002; Lamagna et al., 2005).
Although we were only able to assess dendritic self-crossing, it is likely that JAM-B also participates in dendritic interactions between neighboring J-RGCs. J-RGC dendrites overlap extensively, giving rise to a high “coverage factor,” meaning that dendrites of several J-RGCs overlap (Baden et al., 2016; Rousso et al., 2016). Indeed, we observed more JAM-B puncta than there are self-crossings within each J-RGC (Fig. 10A). Therefore, JAM-B may facilitate overlap between dendrites from neighbors, in addition to counterbalancing self-avoidance (Fig. 11D). This may, in turn, generate appropriate sampling of visual space.
Asymmetric synaptic distribution
We mapped the distribution of excitatory and inhibitory synapses on J-RGCs by biolistically introducing fluorescently tagged PSD95 and gephyrin respectively. This indirect method was necessary because neurites in the IPL are densely intermingled, hindering unambiguous assignment of immunohistochemical signals to individual cells without the use of super-resolution methods (Sigal et al., 2015). We found that excitatory and inhibitory sites are non-uniformly distributed along the J-RGC arbor. Excitatory synapses are markedly sparse on ascending dendrites but are otherwise evenly distributed within the laminated arbor. In contrast, inhibitory synapses are located preferentially on proximal dendrites.
Several RGC types have rather uniform distributions of both excitatory and inhibitory synapses (Morgan et al., 2008; Soto et al., 2011; Bleckert et al., 2013) though some also appear to have fewer excitatory synapses on ascending dendrites (Jakobs et al., 2008; Chen and Chiao, 2014). In one case, electron microscopy reconstruction revealed a distal preponderance of inhibitory synapses on a primate RGC (Lin et al., 2000), and it was previously speculated that distal enrichment of inhibitory synapses could explain the direction-selectivity of J-RGCs (Kim et al., 2008). A stimulus moving in the null direction will result in temporal coincidence of inhibitory and excitatory currents, and consequently, failure to reach firing threshold, whereas a stimulus moving in the preferred direction will result in effective summation of excitatory currents.
Our findings provide evidence that this is not the case, but does not explain direction-selectivity further. Rather, the synapse distributions reported in this study may be a substrate for another aspect of J-RGC function. Recent work reveals that J-RGCs receive input from ON amacrine cells despite having a dendritic arbor in the OFF region of the IPL (Joesch and Meister, 2016). The proximal dendrites that are rich in inhibitory postsynaptic sites extend through the ON region of the IPL en route to s1 and could receive these synapses.
Analysis of the time course of inhibitory synaptogenesis in J-RGCs gave additional clues. Inhibitory synaptogenesis typically leads excitatory synaptogenesis in the inner retina (for review, see Hoon et al., 2014). We found, in contrast, that inhibitory synaptogenesis on J-RGC dendrites lags excitatory synaptogenesis. We speculate that late-born amacrine types make up the presynaptic partners of J-RGCs. Identifying these partners will be a significant step toward dissecting the J-RGC circuitry.
Footnotes
This work was supported by NIH Grant NS29169, and an Agency for Science, Technology, and Research (A*STAR) fellowship from Singapore to J.L. We thank Mallory Laboulaye for mouse colony management, Masahito Yamagata for sharing PSD95 and gephyrin constructs, and In-Jung Kim for designing the JAM-B Cre knock-in construct.
The authors declare no competing financial interests.
- Correspondence should be addressed to Dr. Joshua R. Sanes, Center for Brain Science Harvard University, 52 Oxford Street, Cambridge, MA 02138. sanesj{at}mcb.harvard.edu


