

Article Figures & Data
Figures
- Figure 1.
Implant schematic. a, Top-down view of macaque brain showing the approximate position of each dual electrode with respect to midline and the central and arcuate sulci (gray circles). Expansion shows side view schematic of dual electrode leads with respect to cortical layers. b, Numbered electrode sites for each monkey relative to the central sulcus (dotted line), as determined by median nerve stimulation.
- Figure 2.
Experimental timeline. a, Session timeline with all possible time points for testing and conditioning stimulation (not all time points were measured for every session). b, Schematic of ramped test stimulation applied to sites A–C during each testing time point (e.g., “b” in a). The exact number and magnitude of current steps varied across sessions, but was consistent within a session. c, Schematic of conditioning stimulation applied at sites A and B during conditioning period (e.g., “c” in a).
- Figure 3.
Cortical connectivity from stimulus-evoked potentials. a, Example test stimulation (1.1 mA) applied to purple site and recorded at green site in monkey Q (orange site is control, C, site used in Fig. 6). StTA shows average EP in black, individual trials (n = 97) are shown in gray, and the light-blue shadow is the 95% confidence interval. Black arrowheads denote the max peak and trough used to calculate EP amplitude. b, Overlaid StTAs at each recording site for all current intensities of test stimuli delivered to R7. c, Stimulus–response curves for each recording site for stimulation at R7 (mean ± SEM). Blank panels indicate no response as judged from b.
- Figure 4.
Characterization and comparison of EP measures. a, Histogram of latency to first phase of EP for all responses in both monkeys. Dotted line denotes minimum cutoff due to electrical artifact (1.5 ms) and arrowhead denotes median (2.7 ms). b, Histogram of number of phases in each EP. Arrowhead denotes median (3.0). c, Percentage change in A→B EP amplitude after conditioning compared with percentage change in slope of the first A→B EP phase for responses in Monkey U, for which we could record at a higher sampling rate and separate the first EP phase reliably from recording artifact (see Materials and Methods). d, Percentage change in A→B EP amplitude after conditioning compared with percentage change in amplitude of first A→B EP phase. Dotted line denotes unity; filled black point shows result from a successful conditioning session (Fig. 8); filled gray point shows result from an unsuccessful conditioning session (Fig. 14).
- Figure 5.
Three-hour paired-stimulation conditioning session at 20 ms delay. a, Schematic of conditioning between site A and site B using the Neurochip while Monkey Q was in the home cage for 3 h. Sites A, B, and C were the same as in Figure 3a. b, Preconditioning (blue) and postconditioning (red) stimulus–response curves at time points relative to conditioning as denoted by timeline. c, Average EP from A→B at current denoted by black box in b; diamonds denote peak and trough used to measure amplitude in b. Blue EPs in top three panels are averaged into a composite baseline (gray trace) in subsequent panels. d, Circles and left axis showing EP amplitude at times relative to conditioning at current denoted by black box in b. Horizontal gray line is mean of three preconditioning points; dashed line is 95% confidence interval. Bars and right axis show percentage increase in EP amplitude above composite baseline. Conditioning occurred during gray bar. Delay between stimuli was 20 ms.
- Figure 6.
Comparison of conditioning effects with two different EP measures. Shown is the percentage change in A→B EP amplitude after conditioning compared with percentage change in A→B slope of stimulus–response curve after conditioning for all conditioning sessions in both monkeys. The stimulus–response curve was fit with a linear function to good approximation (r2 ≥ 0.82).
- Figure 7.
Network-wide effects of conditioning. Percentage change in EPs (color map shown to right) from A, B, and C to all other sites where there was a response. Panels show time points after conditioning (top to bottom). Data are from the same conditioning session shown in Figure 5.
- Figure 8.
One-hour paired-stimulation conditioning session at 20 ms delay. a, Schematic of conditioning session with 20 ms delay using rack-mounted equipment while Monkey U was in the booth for 1 h. Left,Cortical positions of A (purple), B (green), and C (orange) sites relative to the central sulcus (dotted line). b, StTA of A→B EP before (blue) and after (red) conditioning at current amplitude denoted by black box in c. Diamonds indicate peak and trough used to calculate amplitude plotted in c. Inset shows magnified view of the early part of the EP; black lines and arrows indicate the slope of the first response phase. c, Stimulus–response curve of A→B EP before (blue) and after (red) conditioning. Black box is current amplitude, 400 μA depicted in b. Inset, Stimulus–response curve for slope of the first phase with the same color scheme. d, Percentage change in EPs from A, B, and C to all other sites where there was a response, as in Figure 7. Fifteen EP sites showed statistically significant changes, either increases or decreases, although none was as large as for the A→B EP. Significant EPs were A→C, A→L6, A→L8, A→L9, A→L15, B→L1, B→C, B→A, B→L4, B→L10, B→L13, C→A, C→L6, C→B, and C→L11.
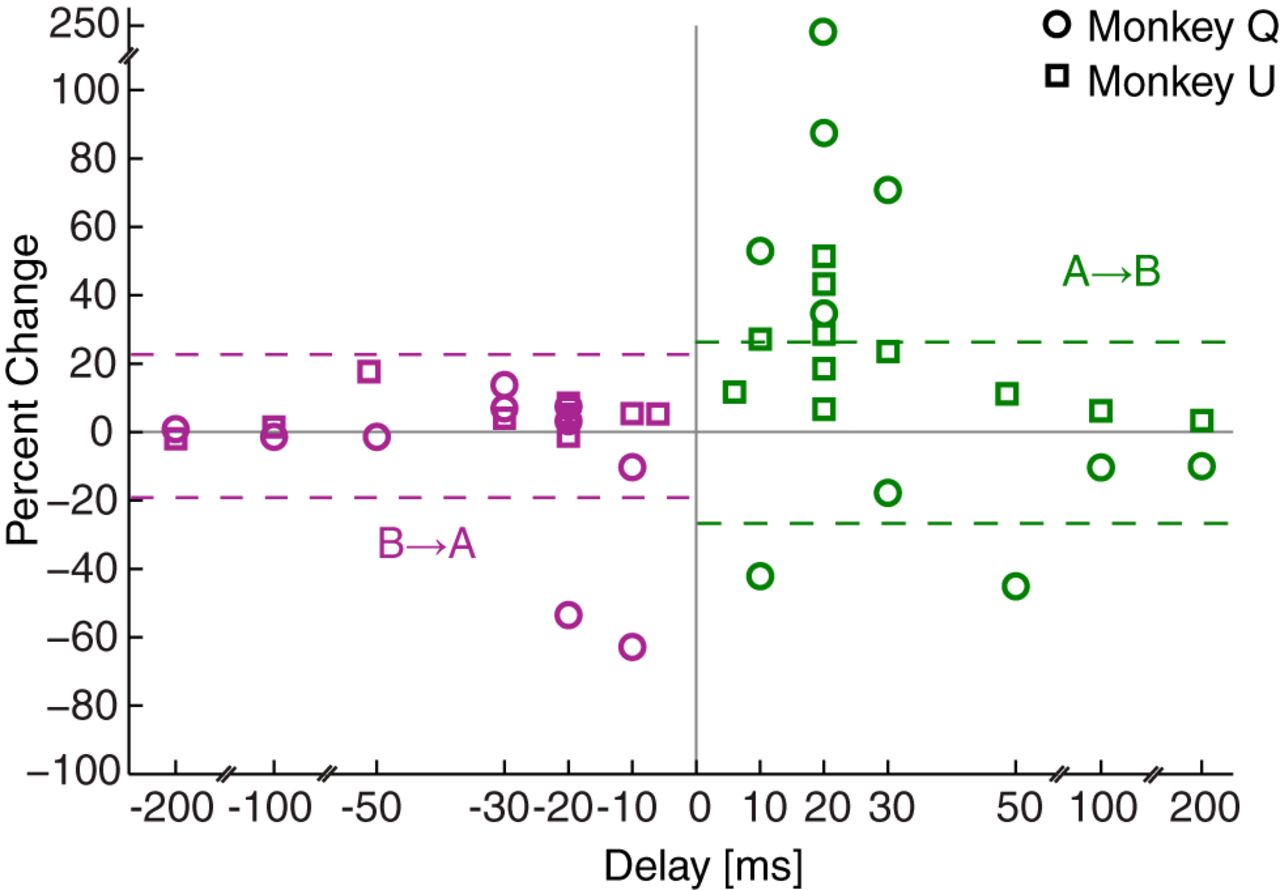
- Figure 9.
Conditioning effect as a function of paired-stimulation delay. Conditioning delay versus percentage change in EP amplitude immediately after paired stimulation ended between sites shown in Figure 5 (Monkey Q, circles) and Figure 8 (Monkey U, squares). Positive delays indicate pre→post (A→B) stimulation and negative delays indicate post→pre (B→A) stimulation. Dotted lines show 2.5th and 97.5th percentiles for the A distribution (green) or the B distribution (purple) from Figure 10a and c, respectively.
- Figure 10.
Cumulative density curves describe network-wide effects of conditioning. a, Acont distribution for all conditioning sessions for the two site pairs depicted in Figures 7 and 8 showing the percentage change in EP amplitude from all sites except B and C for which stimulation at site A evokes a response; arrowhead denotes mean (+4.0%, n = 146 EPs, p < 0.001) and dotted lines indicated the 2.5th and 97.5th percentiles, which are recapitulated in Figure 9. b, Acont distribution depicted as a cumulative density (purple) superimposed with the cumulative density of percentage change in A→B EPs (green) from all delays depicted in Figure 9. Light-colored shadows indicate the 95% confidence interval. c, Bcont distribution (mean = +1.3%, n = 143 EPs, p = 0.2), as in a. d, Bcont distribution cumulative density (green) compared with cumulative density of percentage change in B→A EPs (purple), as in b. Bottom right, Significance matrix for all effects: on-diagonal quadrants indicate p-value of Acont and Bcont means compared with zero (one-sample t test); off-diagonal quadrants indicate comparison of the directed connection with the control distribution in the same row (two-sample K–S test).
- Figure 11.
Schematic of all conditioning pairs. Top left, Top-down view of macaque brain; dashed boxes outline positions of implant area bilaterally. Top right, Left electrode grid in Monkey U with A→B pairs used for conditioning sessions indicated by arrows; arrow points from A to B. Only the left hemisphere was used in Monkey U, which performed a behavioral task using the right hand. Bottom, Bilateral electrode grids for Monkey Q with A→B pairs used for conditioning sessions indicated. Dashed lines in Monkeys U and Q mark the central sulcus.
- Figure 12.
Summary of conditioning results for all conditioning sessions. Shown is the percentage change in A→B, B→A, and A→C EPs after conditioning at 20 ms delay for all site pairs tested in Monkey Q (top) and Monkey U (bottom). For the far left pair in each panel (top, R7→R11; bottom, L3→L7), multiple sessions at a 20 ms delay were conducted and these data are representative examples depicted in Figures 5 and 8. *p < 0.05 as determined by control distributions in Figure 13.
- Figure 13.
Network-wide effects of paired stimulation across all sessions. a, Cumulative densities for the Acont distribution (purple) from all site pairs at a conditioning delay of 20 ms overlaid with the A→B (green) and A→C (orange) distributions. b, Cumulative densities for the Bcont (green curve), B→A (purple), and B→C (orange) distributions. c, Cumulative densities for the Ccont (orange curve), C→A (purple), and C→B (green) distributions. For all panels, light-colored shadow indicates 95% confidence interval; insets show histograms for the appropriate control distribution and arrowheads mark the mean. Cumulative densities were calculated similarly to those in Figure 10. Bottom right, Significance matrix for all combinations: on-diagonal quadrants indicate p-value of Acont, Bcont, and Ccont means compared with zero (one-sample t test); off-diagonal quadrants indicate comparison of the directed connection with the control distribution in the same row (two-sample K–S test).
- Figure 14.
Paired stimulation does not produce a conditioning effect at all sites. a, Schematic of recording grid with A (purple), B (green), and C (orange) sites denoted for a conditioning session at a 20 ms delay in Monkey U while in the recording booth for 1 h. b, StTA of A→B EP before (blue) and after (red) conditioning. Inset, Expansion of StTA showing the slope (black line and arrow) of the first EP phase. Black diamonds denote peak and trough used to calculate amplitude in c. c, A→B stimulus–response curve before (blue) and after (red) conditioning. Black box denotes current depicted in b. Inset, Stimulus–response curve before and after conditioning for slope of first EP phase. d, Percentage change in EP amplitude from A–C to all other recording sites after conditioning.
- Figure 15.
Proposed diagram of interareal connections and STDP effects. Four of many potential pathways connecting an A and B site in sensorimotor cortex are shown to illustrate differential STDP effects produced in these networks and how they may interact. Upper layer 2/3 and layer 5 are the likely targets of the dual electrodes for each site, so only these layers are shown. The green pathway from A→B highlights successful potentiation due to convergent excitatory input between layer 5 pyramidal cells, as well as collaterals within the B site. Similarly, the green pathway from B→A shows successful depression. The other three pathways do not promote STDP for various reasons. The red pathway results in inhibition between A and B via inhibitory interneurons (circles). In the purple pathway, whereas inputs to the proximal dendrites would promote potentiation, inputs on the distal dendrites would not. Similarly, depression in the blue pathway is unsuccessful because the primary connection from B→A is in the distal dendrites.


Tables
Experiment Session A site B site C site Pulses Current (uA) Frequency (Hz) Delay (ms) Duration (h) A→B (% change) B→A (% change) A→C (% change) C→B (% change) 1 20140917 R7 R11 R10 3 @330 Hz 330 2 20 3 87.41* 3.13 3.91 1.70 20141006 10 −42.13* −62.80* 2.43 −1.13 20141027 30 70.79* 13.78 14.30 9.59 20150119 20 34.70* −53.50* −25.0 −8.08 20150316 200 −20.96 2.21 −0.21 6.88 20150330 50 −45.07* −1.42 15.24 23.53* 20150403 20 250.65* 7.50 8.45 No EP 20150403† 20 −3.45 −10.66 9.37 No EP 20150406 100 −10.39 −1.45 22.6 23.0 20150422 30 −17.77 6.94 31.43* 15.35* 20150427 10 52.96* −10.30 19.74 31.48* 20150720 — — — −7.92 29.42* 9.10 −0.032 2 20150216 L7 L11 L10 3 @300 Hz 330 2 20 3 34.18* −34.70* −44.49* −24.76* 20150608 20 −1.93 52.24* −16.66 0.35 20150804 20 −19.18 28.47* −25.7 6.70 3 20150128 R11 R7 R10 3 @300 Hz 330 2 20 3 −14.14 19.97 6.68 −21.34 4 20150126 L3 L4 L8 3 @300 Hz 330 2 20 3 −17.82 −13.14 3.71 −20.49 5 20150615 L4 L3 L2 3 @300 Hz 330 2 20 3 5.22 −29.65* −10.61 −9.02 6 20150706 L8 L4 L6 3 @300 Hz 330 2 20 3 −17.51 8.86 12.77 −6.03 Experiments are grouped by sites and sessions and are listed chronologically. Percentage change in EP amplitude was measured immediately after paired stimulation ended. In session 20150403, two conditioning blocks were performed with a 3 h gap in between. The first entry is the result of the first conditioning block and 20150403† is the second conditioning block (see Results).
↵*p < 0.05 based on control distributions from Figure 13.
Experiment Session A site B site C site Pulses Current (uA) Frequency (Hz) Delay (ms) Duration (h) A→B (% change) B→A (% change) A→C (% change) C→B (% change) 1 20150528 L3 L7 L2 3 @330 Hz 80 2 20 1 51.37* 8.41 −12.41 −0.97 20150529 B only stim 17.65 157.22* 2.54 −3.18 20150603 20 43.27* 7.14 −16.05 −2.09 20150604 — — — 19.96 0.54 0.29 2.74 20150608 10 27.15* 5.41 −0.47 0.68 20150609 30 23.53 4.07 4.80 1.17 21050611 100 6.20 1.50 4.52 −1.59 20150612 200 7.46 −3.82 0.88 0.72 20150806 20 28.64* 5.19 12.24 6.04 20150807 20 6.70 −1.14 8.30 0.96 20150928 20 18.52 2.92 36.19* 4.27 20151001 1 200 6 11.70 5.28 13.85 −1.14 20160108 3 @300 Hz 80 50 11.11 17.25 29.10* 2.88 2 20150707 L13 L12 L9 3 @330 Hz 100 2 20 1 5.23 −1.07 0.23 4.33 20150708 200 20 −3.46 −0.45 −3.32 −3.75 3 20150922 L4 L8 L12 3 @330 Hz 80 2 20 1 5.04 3.30 −9.17 −3.38 20150924 20 6.46 8.97 11.07 2.40 4 20150521 L7 L3 L2 3 @330 Hz 80 2 20 1 5.57 53.75* −11.60 6.28 5 20150522 L8 L6 L12 3 @330 Hz 100 2 20 1 3.20 3.40 3.76 −5.91 6 20150527 L10 L15 L14 3 @330 Hz 120 2 20 1 17.16 −7.31 27.45* −40.74* 7 20150702 L8 L9 L3 3 @330 Hz 120 2 20 1 7.29 4.14 6.64 1.11 8 20150709 L6 L2 L7 3 @330 Hz 140 2 20 1 −4.10 2.90 4.70 3.46 9 20150710 L12 L8 L13 3 @330 Hz 140 2 20 1 1.16 4.82 −1.78 2.64 Experiments are grouped by sites and sessions and are listed chronologically. Percentage change in EP amplitude was measured immediately after paired stimulation ended.
↵*p < 0.05 based on control distributions from Figure 13.


