

Article Figures & Data
Figures
- Figure 1.
Task design. A–C, Sessions consisted of three trial types: reward (A), neutral (B), and shock (C), which could be identified by a unique auditory cue. A lever was introduced into the chamber at the start of each session and remained extended for the duration of the session. At the beginning of each trial, rats were presented with a light cue and trial-specific sound cue for 5 s and then had a maximum of 10 s to press the lever. If rats pressed the lever during this 10 s interval, then they could receive a sucrose pellet reward, avoid an impending foot shock (0.42 mA), or experience no consequence depending on the identity of the sound cue. If rats failed to press the lever within 10 s, they would alternatively receive no sucrose reward, receive a foot shock (0.42 mA; 2 s duration with automatic termination), or experience no consequence depending on the identity of the sound cue. After each consequence, the trial progressed into a 20 s ITI. Trial types were pseudorandomly interleaved within each session (∼45 min) and sound cue identity was counterbalanced across rats. During extinction sessions (∼30 min), cues produced no outcome regardless of previous association with reward, neutral, or shock. D, E, RT and %P computed across reinforced (D) and extinction (E) sessions (n = 84). RT was defined as the time between auditory cue offset and the lever press. Bars with asterisks represent significance (t test; p < 0.05). F, G, Analysis of behavior during the cue period of each trial type in reinforcement and extinction sessions. Percentage freezing (F) and orienting to the lever (G) are shown for press and no-press trials. Asterisks indicate p < 0.05 in χ2; n = 17 sessions from 5 rats, with 4 rats contributing 3 sessions and one rat contributing 2 sessions. Error bars indicate SEM.
- Figure 2.
Firing rates over trial time for individual neurons. A–C, Heat plots depicting normalized cell firing (spikes/s) across trial time (x-axis) for each recorded cell (y-axis; N = 289 cells) for reward press (A), neutral press (B), and shock press (C) trial types. Cells are sorted by firing during the cue epoch. Cue onset and offset are depicted with dashed black lines. D–F, Single-cell example of an increasing-type cell showing activity across each of the three trial types. Activity is aligned to cue onset (binned at 100 ms); cue onset and offset are depicted with gray lines. Each tick mark equals one action potential.
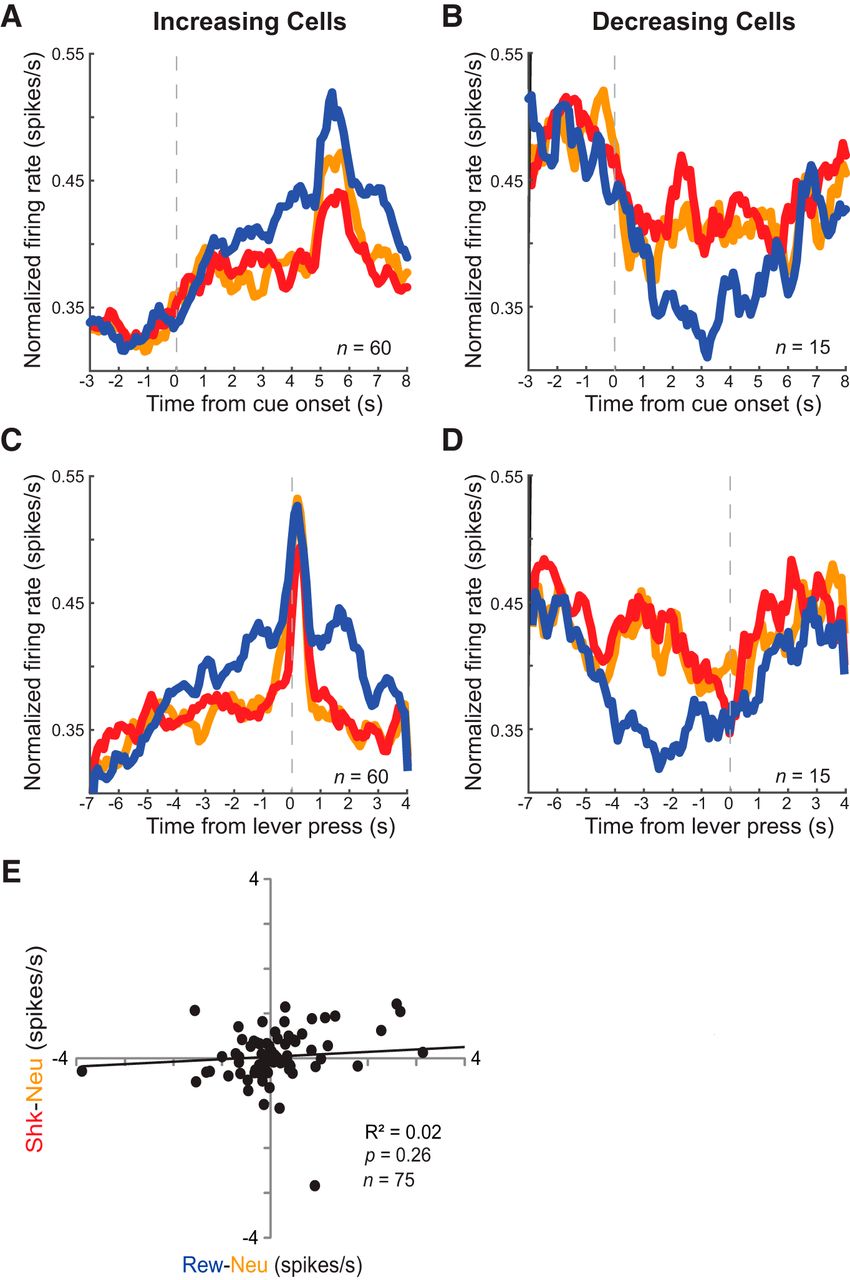
- Figure 3.
Increasing- and decreasing-type cells in vmPFC are modulated by cues that predict reward. A, B, Histograms depicting normalized average firing rate (spikes/s) for cells increasing (n = 60) or decreasing (n = 15) within the overall population (N = 289 cells) across trial time for reward (blue), neutral (orange), and shock (red) trial types. Cue onset is depicted with a gray dashed line aligned to time = 0. C, D, Histograms depicting normalized average firing rate (spikes/s) for the same cells pictured in A and B aligned to lever press, which is depicted with a gray dashed line at time = 0. E, Scatter plot depicting combined increasing and decreasing cells (n = 75) along computed reward (reward − neutral; x-axis) and shock (shock − neutral; y-axis) indices for each cell. Indices were calculated by subtracting average firing rates during the cue epoch on neutral press trials from reward press and shock press (i.e., avoid) trials.
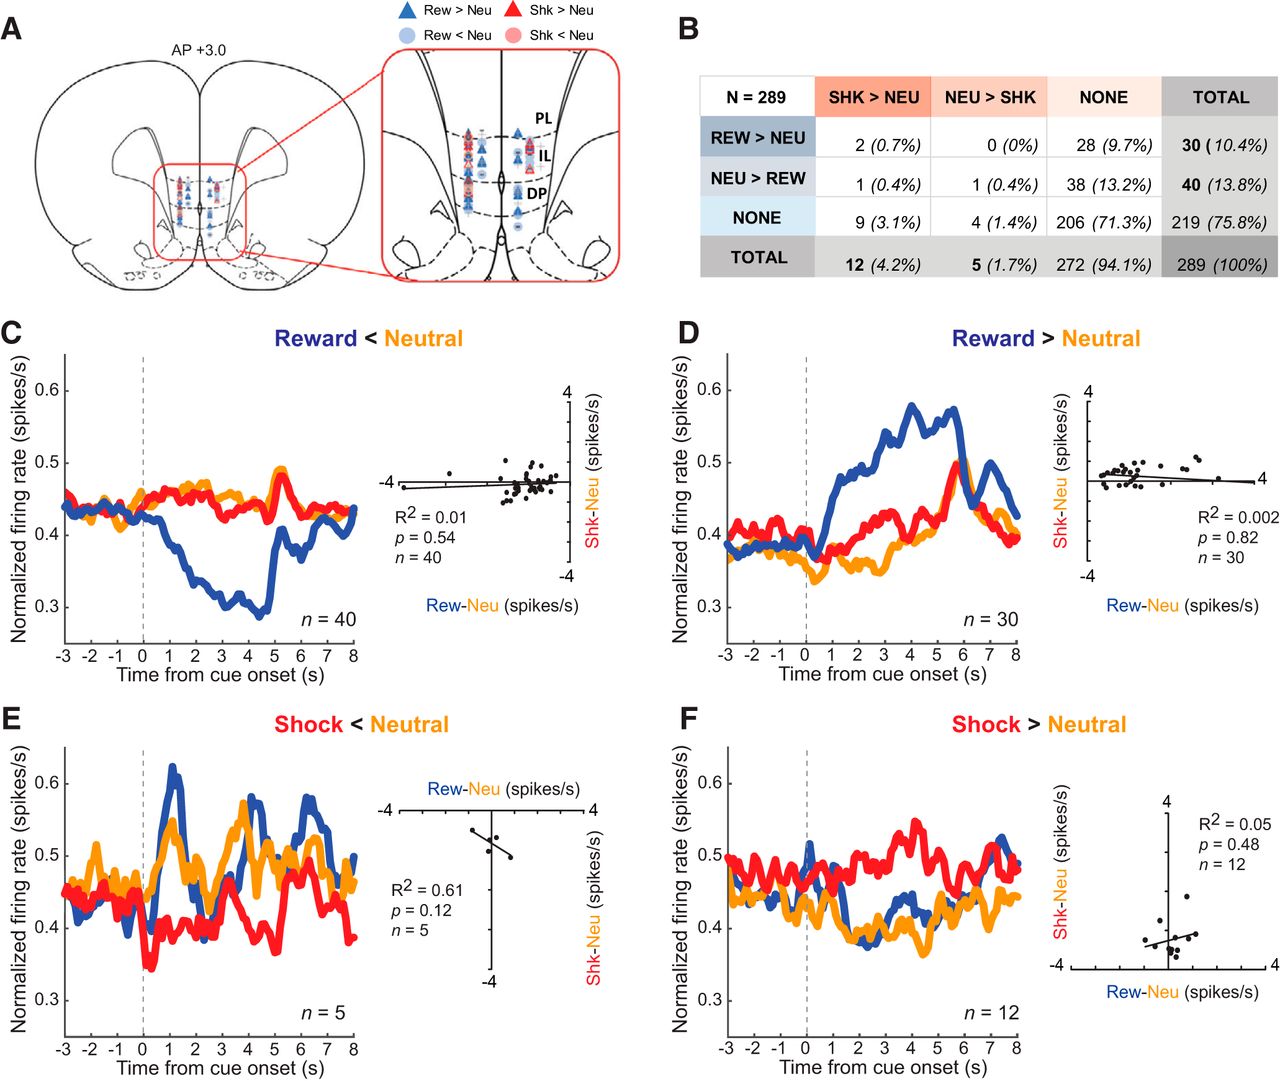
- Figure 4.
vmPFC neurons were strongly and weakly modulated during reward and shock cues, respectively, and very few are modulated by both. A, Location of recording sites based on histology (Paxinos and Watson, 2007); PL, Prelimbic cortex, DP, dorsopeduncular region. Each symbol represents the location of neurons that showed differential firing (Wilcoxon; p < 0.05) in the analyses described in the text (see Results) and shown in the table in B. Dark blue indicates reward > neutral; light blue, neutral > reward; dark red, shock > neutral; light red = neutral > shock; -, decreasing-type cells; +, increasing-type cells. B, Table quantifying numbers and percentages of cells that were reward > neutral, neutral > reward, shock > neutral, neutral > reward, or none of the above. C–F, Histograms depicting average normalized firing rate (spikes/s) for cells in which reward < neutral (n = 40; C), reward > neutral (n = 30; D), shock < neutral (n = 5; E), and shock > neutral (n = 12; F) within the overall population (N = 289 cells) across trial time for reward (blue), neutral (orange), and shock (red) trial types. Cue onset is depicted with a gray dashed line aligned to time = 0. Insets show scatter plots depicting each cell within each subpopulation (reward < neutral, reward > neutral, shock > neutral, shock > neutral) along computed reward (reward − neutral; x-axis) and shock (shock − neutral; y-axis) indices. Indices were calculated by subtracting average firing rates during the cue epoch on neutral press trials from reward press and shock press (i.e., avoid) trials.
- Figure 5.
Neurons were selective for outcome during either conditioning or extinction, but not during both contexts. A–D, Histograms depicting average normalized firing rate (spikes/s) for reward < neutral (n = 32; A, C) and reward > neutral (n = 25; B, D) cells that are modulated when rats press the lever after cues during reinforced trial blocks (A, B), but not after extinguished cues (C, D), for reward (blue), neutral (orange), and shock (red) trial types. E–H, Histograms depicting average normalized firing rate (spikes/s) for reward < neutral (n = 18; E, G) and reward > neutral (n = 6; F, H) cells that are modulated when rats press the lever during extinction trial blocks (E, F), but not for cues during reinforced trial blocks (G, H), for reward (blue), neutral (orange), and shock (red) trial types. Cue onset is depicted with a gray dashed line aligned to time = 0. Cells are drawn from the total population and were behaviorally matched across reinforced and extinction (N = 241).
- Figure 6.
Single-neuron example of a decreasing-type cell showing activity (spikes/s) during reinforced (A–C) and extinction (D–F) trial blocks for press trials for each trial type: reward (A, D), neutral (B, E), and shock avoidance (C, F). Activity is aligned to cue onset at time = 0 s, indicated by a gray line, and binned at 100 ms. Each tick mark equals one action potential.
- Figure 7.
Outcome selectivity differs for early and late trials in reinforced and extinction trial blocks. Early and late trials are defined as the first and last 10% of trials in a session, respectively. A–C, Bar graphs depicting differences in behavioral selectivity index (A; combined n = 81) and neural selectivity index (firing rate differences) between reward and neutral trials for neurons selective during reinforced trial blocks (B; n = 57) and extinction trial blocks (C; n = 24). For firing rate during the cue period, selectivity was computed by subtracting neutral from reward trials (reward − neutral) for increasing-type cells and by subtracting reward from neutral trials (neutral − reward) for decreasing-type cells, so that the positive values for both groups of cells reflect stronger neural selectivity. For RT, because rats were faster compared with neutral trials, we subtracted reward from neutral RTs (neutral − reward). Therefore, for both measures, higher values signify higher behavioral and reward selectivity. D–G, Scatter plots pitting behavioral selectivity (y-axis) and neural selectivity (x-axis) indices against each other during early and late phases of reinforced (D, E) and extinction (F, G) trial blocks, respectively.
- Figure 8.
Outcome selectivity during extinction was also response selective. A–D, Histograms depicting average normalized firing rate (spikes/s) for reward < neutral (n = 18; A, C) and reward > neutral (n = 6; B, D) cells that are modulated when rats press the lever during extinction (A, B), but not when they fail to press (C, D), for reward (blue), neutral (orange), and shock (red) trial types. E–H, Histograms depicting average normalized firing rate (spikes/s) for reward < neutral (n = 24; E, G) and reward > neutral (n = 2; F, H) cells that are modulated when rats fail to press the lever during extinction cues (E, F), but not when they press (G, H), for reward (blue), neutral (orange), and shock (red) trial types. Cue onset is depicted with a gray dashed line aligned to time = 0. Cells are drawn from the total population and were behaviorally matched across reinforced and extinction (N = 244).


