

Abstract
Eph receptors play pivotal roles in the axon guidance of retinal ganglion cells (RGCs) at the optic chiasm and the establishment of the topographic retinocollicular map. We previously demonstrated that protein tyrosine phosphatase receptor type O (PTPRO) is specifically involved in the control of retinotectal projections in chicks through the dephosphorylation of EphA and EphB receptors. We subsequently revealed that all the mouse R3 subfamily members (PTPRB, PTPRH, PTPRJ, and PTPRO) of the receptor protein tyrosine phosphatase (RPTP) family inhibited Eph receptors as their substrates in cultured mammalian cells. We herein investigated the functional roles of R3 RPTPs in the projection of mouse retinal axon of both sexes. Ptpro and Ptprj were expressed in mouse RGCs; however, Ptprj expression levels were markedly higher than those of Ptpro. Consistent with their expression levels, Eph receptor activity was significantly enhanced in Ptprj-knock-out (Ptprj-KO) retinas. In Ptprj-KO and Ptprj/Ptpro-double-KO (DKO) mice, the number of retinal axons that projected ipsilaterally or to the contralateral eye was significantly increased. Furthermore, retinal axons in Ptprj-KO and DKO mice formed anteriorly shifted ectopic terminal zones in the superior colliculus (SC). We found that c-Abl (Abelson tyrosine kinase) was downstream of ephrin–Eph signaling for the repulsion of retinal axons at the optic chiasm and in the SC. c-Abl was identified as a novel substrate for PTPRJ and PTPRO, and the phosphorylation of c-Abl was upregulated in Ptprj-KO and DKO retinas. Thus, PTPRJ regulates retinocollicular projections in mice by controlling the activity of Eph and c-Abl kinases.
SIGNIFICANCE STATEMENT Correct retinocollicular projection is a prerequisite for proper vision. Eph receptors have been implicated in retinal axon guidance at the optic chiasm and the establishment of the topographic retinocollicular map. We herein demonstrated that protein tyrosine phosphatase receptor type J (PTPRJ) regulated retinal axonal projections by controlling Eph activities. The retinas of Ptprj-knock-out (KO) and Ptpro/Ptprj double-KO mice exhibited significantly enhanced Eph activities over those in wild-type mice, and their axons showed defects in pathfinding at the chiasm and retinocollicular topographic map formation. We also revealed that c-Abl (Abelson tyrosine kinase) downstream of Eph receptors was regulated by PTPRJ. These results indicate that the regulation of the ephrin–Eph–c-Abl axis by PTPRJ plays pivotal roles in the proper central projection of retinal axons during development.
Introduction
The correct axonal projections of retinal ganglion cells (RGCs) are a prerequisite for proper vision and vision-guided behaviors (Simon and O'Leary, 1992). In mammals, the optic chiasm (OC) is the major midline choice point for retinal axons; some retinal axons avoid passing the midline and project ipsilaterally, which is considered to be necessary for acquiring high-quality binocular vision and stereopsis (Jeffery, 2001). In mice, only RGCs in the ventrotemporal (VT) crescent project ipsilaterally, while RGCs from all other retinal regions project contralaterally (Fig. 1A). A previous study (Williams et al., 2003) reported that retinal axons from the VT portion specifically expressed high levels of EphB1 receptors to sense ephrinB2 at the chiasm and turn ipsilaterally.
Retinal axons establish a topographic map in the superior colliculus (SC) to generate a spatially matched projection of visual images to the brain; nasal and temporal axons project to the posterior and anterior SC, respectively, while dorsal and ventral retinas are connected to the lateral and medial SC, respectively (Fig. 1B). The importance of ephrinA–EphA signaling in topographic map formation along the anterior–posterior (A–P) axis of the SC has already been established (Brown et al., 2000; Wilkinson, 2000; Takahashi et al., 2003, 2009; McLaughlin and O'Leary, 2005; Sakuta et al., 2006). In the mouse retina, EphAs are expressed in a decreasing gradient from temporal to nasal axons, and ephrinAs from the posterior to anterior SC (Connor et al., 1998; Fig. 1B). EphrinA–EphA repellent interactions between the SC and retinal axons control projections along the A–P axis: axons strongly expressing EphA are impeded from invading the ephrinA-rich posterior part of the SC, while those weakly expressing EphA are permitted to enter and terminate there (Marcus et al., 1996; Hornberger et al., 1999).
However, EphBs are expressed in a ventral high-dorsal low gradient, while ephrinBs are expressed in a dorsal high-ventral low gradient in the retinas of mice (McLaughlin et al., 2003a; Fig. 1B). In the SC, a medial high-lateral low gradient of ephrinB1 has been detected in mice (Hindges et al., 2002). Therefore, the interactions between EphBs on ventral retinal axons and ephrinBs in the medial SC are considered to be attractive, but not repulsive (McLaughlin et al., 2003b). Previous studies that analyzed retinocollicular projections in EphB-deficient mice indicated that EphBs are necessary for topographic map formation along the medial–lateral (M–L) axis (Hindges et al., 2002; Thakar et al., 2011).
Protein tyrosine phosphatases (PTPs) have also been implicated in the regulation of signal transduction by Eph receptor kinases. Classical tyrosine-specific PTPs comprise 20 receptor PTSs (RPTPs) and 18 intracellular PTPs (Alonso et al., 2004). RPTPs consist of an extracellular region, a single transmembrane segment, and a cytoplasmic region with one or two tyrosine phosphatase domains. RPTPs are classified into eight subfamilies (R1/R6, R2a, R2b, R3, R4, R5, R7, and R8) based on the sequence homologies of their extracellular and PTP domains (Andersen et al., 2001). We previously implicated protein tyrosine phosphatase receptor type O (PTPRO), a member of the R3 RPTP subfamily, in the projection of retinal axons to the tectum (avian homolog of the mammalian SC) through the dephosphorylation of Eph receptor activities in chicks (Shintani et al., 2006). However, Ptpro-knock-out (KO) mice have been reported to exhibit normal retinocollicular projections (Gatto et al., 2013). Accordingly, the RPTPs regulating Eph receptors in retinal axons in mammals have not yet been identified.
We previously reported that all murine R3 RPTP subfamily members dephosphorylated Eph receptors as substrates in cultured cells (Sakuraba et al., 2013). In the present study, we investigated the roles of murine R3 RPTPs in the formation of retinocollicular projections during development. We found that Ptprj and Ptpro were expressed in developing mouse RGCs; however, Ptprj expression levels were markedly higher than those of Ptpro. To clarify whether PTPRJ and/or PTPRO influence the projection of retinal axons, we examined retinocollicular projections in Ptprj-KO, Ptpro-KO, and double-KO (DKO) mice.
Materials and Methods
Mice.
In the present study, Ptprj-KO mice generated in Dr. A. Fusco's laboratory in Università Magna Graecia di Catanzaro (Catanzaro, Italy) (Trapasso et al., 2006) and Ptpro-KO mice generated in the laboratory of author T. Shirasawa were used in analyses. Ptpro-KO mice were obtained from the RIKEN Bio-Resource Center (catalog #01235; RRID:IMSR_RBRC01235). These mice were backcrossed with C57BL/6J mice and interbred to give littermates for analyses. Ptprj/Ptpro-double-deficient mice were generated by crossing these two lines in our laboratory (Ptprj+/−Ptpro−/− mice were interbred to obtain DKO mice). Mice of both sexes were used in this study. Noon on the day on which a plug was found was considered to be embryonic day 0.5 (E0.5). All procedures were approved by the Institutional Animal Care and Use Committee of the National Institutes of Natural Sciences, Japan, and were performed in accordance with the guidelines of the Institutional Committee for the Use of Animals for Research.
Conventional and real-time quantitative PCR.
Total RNA was extracted using TRIzol Reagent (Life Technologies) following the manufacturer's instructions, and was reverse transcribed using the PrimeScript RT Reagent Kit with the gDNA Eraser (Takara). cDNAs were amplified using Ex Taq (Takara) on the T-Professional Thermal Cycler (Biometra) and SYBR Premix Ex TaqII (Takara) on the StepOnePlus Real-Time PCR thermocycler (Applied Biosystems) for conventional and quantitative real-time PCR (qRT-PCR), respectively. The following primers were designed using the Perfect Real Time Support System (Takara): Epha4, 5′-ATTGCATTCTGACAGGGTGTATGG-3′ (forward) and 5′-GGCATCAATGCATAGGCACATC-3′ (reverse); Ephb2, 5′-TTTGCCTGGGTCTGAAGGTC-3′ (forward) and 5′-AATTCACTAACCGATTGTTCTGCTC-3′ (reverse); Ptprb, 5′-AAACCCAGCAACTGAACCTGTTATG-3′ (forward) and 5′-CAATGCAATCGTGTGGGTAGATG-3′ (reverse); Ptprh, 5′-CTGGGAACAGCAGAGCCACA-3′ (forward) and 5′-CTGAGCATCCAAGGGCCAGTA-3′ (reverse); Ptprj, 5′-CCAGGTGTGGAGTGAAGCTGA-3′ (forward) and 5′-GTGCACAGAACTATTGCCAGGAC-3′ (reverse); Ptpro, 5′-TGACCTTCATAAACGGTAAAGCACA-3′ (forward) and 5′-ACATCCTGCCATGCCCTTG-3′ (reverse); and Gapdh, 5′-ATGGCGTTTCAAAAGGCAGTGAAG-3′ (forward) and 5′-TCTGCCATCACTGGTTGCAGGATC-3′ (reverse). PCR settings were as follows: for conventional PCR, initial denaturation at 95°C for 30 s was followed by 28 cycles of amplification at 60°C for 30 s and at 72°C for 30 s; for qRT-PCR, initial denaturation at 95°C for 30 s was followed by 40 cycles of amplification at 95°C for 5 s and at 60°C for 30 s. In qRT-PCR, the relative quantification of gene expression was calculated relative to Gapdh.
In situ hybridization.
Section in situ hybridization was performed as described previously (Shintani et al., 2009). The templates used for the preparation of cRNA probes were as follows: mouse Ptprj, nucleotide residues 2576–3248 (GenBank accession no. NM_08982); and Ptpro, nucleotide residues 2451–3082 (GenBank accession no. NM_011216).
Antibodies.
The following primary antibodies were used: a mouse anti-phosphotyrosine (pTyr) antibody (monoclonal; 1:1000 dilution; catalog #05-321, Merck Millipore; RRID:AB_916370); rabbit anti-phosphorylated-Eph receptors (pEph) antibody (polyclonal; 1:1000 dilution; catalog #ab124881, Abcam; RRID:AB_10972696); rabbit anti-EphA4 antibody (polyclonal; 1:1000 dilution; catalog #sc-922, Santa Cruz Biotechnology; RRID:AB_2099366); rabbit anti-ephrinA2 antibody (polyclonal; 1:1000 dilution; catalog #sc-912, Santa Cruz Biotechnology; RRID:AB_631409) rabbit anti-EphB2 antibody (polyclonal; 1:1000 dilution; catalog #sc-28980, Santa Cruz Biotechnology; RRID:AB_2099961); rabbit anti-ephrinB2 antibody (polyclonal; 1:1000 dilution; catalog #sc-1010, Santa Cruz Biotechnology; RRID:AB_2095703); mouse anti-α-tubulin antibody (monoclonal; 1:1000 dilution; catalog #sc-5286, Santa Cruz Biotechnology; RRID:AB_628411); mouse anti-β-tubulin III antibody (monoclonal; 1:1000 dilution; catalog #T8660, Sigma-Aldrich; RRID:AB_477590); rabbit anti-c-Abl (Abelson tyrosine kinase) antibody (polyclonal; 1:1000 dilution; catalog #2862S, Cell Signaling Technology; RRID:AB_10695392); and rabbit anti-phosphorylated c-Abl (Tyr-412) antibody (rabbit monoclonal; 1:1000 dilution; catalog #2865S, Cell Signaling Technology; RRID:AB_331381). Peroxidase-conjugated secondary antibodies were from GE Healthcare.
Immunoprecipitation, pull-down, and Western blotting.
Immunoprecipitation experiments were performed as described previously (Shintani et al., 2006). In brief, the retinas of postnatal day 8 (P8) mice were lysed in lysis buffer, which consisted of 20 mm HEPES, pH 7.4, 120 mm NaCl, 1% Nonidet P-40, 50 mm NaF, 0.5 mm Na3VO4, and a protease inhibitor mixture (10 μg/ml leupeptin, 1 μg/ml pepstatin A, and 1 mm phenylmethylfonyl sulfate). Protein concentrations were measured with a BCA Microassay Kit (Life Technologies). Regarding immunoprecipitation, retinal lysates were incubated with the anti-pTyr antibody, and immunoprecipitates were collected with Protein G Magnetic Beads (Thermo Fisher Scientific). Pull-down experiments were performed as described previously (Himanen et al., 2004). In brief, 10 μg of ephrinA2-Fc or ephrinB2-Fc proteins was incubated with retinal lysates containing 2 mm MgCl2, and pull-down complexes were collected with Protein G Magnetic Beads. Proteins were subjected to SDS-PAGE and Western blotting (Shintani et al., 2006). Separated proteins were transferred onto Immobilon-P Membranes (Merck Millipore), incubated with specific primary antibodies and peroxidase-conjugated secondary antibodies (GE Healthcare), and then detected with chemiluminescence using ECL Reagent (PerkinElmer). The Lumino-Image Analyzer LAS-3000 mini (Fujifilm) was used for detection. Signal intensity was quantified by densitometry.
DNA constructs.
Myc-tagged mouse c-Abl cDNA was cloned by reverse transcription-PCR (RT-PCR) and subcloned into the expression vector pcDNA 3.1 (Thermo Fisher Scientific). RPTP constructs were described previously (Sakuraba et al., 2013).
Cell cultures and transfection.
HEK293T cells were grown in DMEM/F-12 medium supplemented with 10% fetal bovine serum (FBS) and antibiotics. Transfection was performed using Lipofectamine PLUS (Invitrogen) according to the protocol of the manufacturer. After being cultured for 24 h, cells were subjected to Western blotting as described above.
DiI labeling.
Optic tract DiI (1,1′-dioctadecyl-3,3,3′,3′-tetramethylindocarbocyanine perchlorate; Thermo Fisher Scientific) labeling experiments were performed as previously described (Andersen et al., 2001; Plump et al., 2002). In brief, the heads were removed at E17.5 or P1 and then fixed in 10% formaldehyde at room temperature overnight. The lens and retinas of the left eye were removed, and small crystals of DiI labeling were placed directly on the optic disc. The tissue was incubated in 10% formaldehyde at room temperature and kept in the dark for 10 d. After the incubation, the ventral diencephalon containing the optic nerve was dissected out, and images were acquired with an LSM 700 Laser Scanning Confocal Microscope (Carl Zeiss). The ipsilateral index was calculated by dividing the fluorescent intensity of the ipsilateral optic tract by the total fluorescent intensity of both tracts (Soskis et al., 2012; see Fig. 5A). The misrouting index was calculated by dividing the fluorescent intensity of the left optic nerve by that of the right optic nerve (see Fig. 5A).
In the analysis of retinocollicular projections, anterograde focal retinal DiI labeling was performed as previously described (Brown et al., 2000). Briefly, mice at P8 were anesthetized on ice, and a small amount of 10% DiI in dimethylformamide was injected into the peripheral region of the retina. After 48 h, the whole brain containing the SC and retina was dissected out, and then fixed in 10% formaldehyde at 4°C for 16 h. Images were acquired with an LSM 700 Laser Scanning Confocal Microscope. The center of fluorescence (center of mass) for each image was calculated and used to define the position of the terminal zone (TZ) in the SC along the A–P axis, which ranged between 0 and 20 (see Figs. 6U, 7U, 8U).
Retinal explant cultures.
Retinal explant cultures were performed as described previously (Wang et al., 1995). In brief, the ventrotemporal region of the retina was dissected from E15.5 embryos and cultured in collagen I gels (Nitta gelatin) containing 2 μg/ml ephrinB2-Fc or control Fc proteins for 48 h. A treatment with 5-[3-(4-fluorophenyl)-1-phenyl-1H-pyrazol-4-yl]-2,4-imidazolidinedione (DPH; 20 μg/ml, Sigma-Aldrich) or imatinib (10 μg/ml, Sigma-Aldrich) was performed by inclusion of these reagents into the gel. After fixation with 4% paraformaldehyde in PBS for 10 min, neurites were staining with the anti-βIII tubulin antibody. Images were observed with a Zeiss LSM700 Confocal Laser Microscope. The total area covered by neurites was quantified with ImageJ Software (RRID:SCR_003070).
Growth cone collapse assay.
A retinal strip culture was performed as previously described (Shintani et al., 2006). Briefly, retinal strips (width, 400 μm) prepared from E16.5–E17.5 retinas were cultured in DMEM containing 10% FBS on laminin (20 μg/ml)-coated dishes in a humidified incubator with 5% CO2 for 2 d. Axons and growth cones were stimulated with ephrinA2-Fc, ephrinA5-Fc, or control (0–10 μg/ml, final concentration) at 37°C for 30 min. A pretreatment with DPH (20 μg/ml) or imatinib (10 μg/ml) was performed for 15 min before the stimulation with ephrinA2-Fc. After fixation with 4% paraformaldehyde in PBS for 10 min, the strips were stained with the anti-βIII tubulin antibody and Alexa Fluor 594-phalloidin (Thermo Fisher Scientific). Images were observed with a Zeiss LSM700 Confocal Laser Microscope.
Primary culture of retinal neurons.
Retinas dissected from E16.5–E17.5 mice were digested with 0.1% trypsin in PBS at 37°C for 15 min. After adding 10 volumes of DMEM containing 10% FBS, neurons were mechanically dissociated into single cells by pipetting. The dissociated neurons were plated on laminin (20 μg/ml)-coated dishes at a density of 1 × 10⁶ cells/ml and maintained in Neurobasal Medium (Thermo Fisher Scientific) supplemented with B27 supplement (Thermo Fisher Scientific) for 48 h. Retinal neurons were stimulated with ephrinA2-Fc or control Fc (10 μg/ml, final concentration) at 37°C for 30 min, and proteins were then extracted and subjected to Western blotting as described above.
In vitro dephosphorylation assay.
GST-fusion proteins encoding the entire intracellular regions of RPTPs were described previously (Sakuraba et al., 2013). Regarding in vitro dephosphorylation, we prepared autophosphorylated c-Abl proteins as the substrate. Phosphorylated c-Abl proteins were purified from HEK293T cells expressing Myc-tagged c-Abl by immunoprecipitation with an anti-Myc antibody and protein G-Sepharose CL-4B. Protein G beads were washed three times with lysis buffer, and resuspended in 100 μl of 10 mm Tris-HCl, pH 7.0, containing 5 mm DTT, 5 mm EDTA, and 100 μg/ml bovine serum albumin (PTP buffer). In the dephosphorylation assay, 10 ng of GST-RPTPs or GST alone was reacted with 10 μl of the phosphorylated c-Abl protein solution at 30°C for 15 min. The reaction was stopped by the addition of SDS sample buffer. Samples were separated by SDS-PAGE followed by Western blotting with anti-phosphotyrosine and anti-Myc antibodies (1:1000 dilution; catalog #05-419, Millipore; RRID:AB_309725).
Experimental design and statistical analysis.
The sample size was calculated from a power analysis using preliminary data obtained in our laboratory under the following assumptions: α = 0.05 and power = 0.8. Statistical analyses were performed with the Student's t test or ANOVA followed by Tukey's post hoc test using Prism 5 (GraphPad Software; RRID:SCR_002798). Results are presented as the mean ± SEM, and p < 0.05 was considered to be significant.
Results
Expression of R3 RPTPs in the developing retina
We examined the expression levels of the R3 subfamily members of RPTPs in the developing mouse retina. RT-PCR analyses of the retina on P0 revealed the gene expression of Ptprj and Ptpro, but not of Ptprb or Ptprh (Fig. 1C). These results were consistent with previous findings showing that PTPRJ and PTPRO are expressed in the CNS (Gayà et al., 1999; Beltran et al., 2003) and that the expression of PTPRB and PTPRH is restricted to endothelial and intestinal epithelial cells, respectively, in mice (Fachinger et al., 1999; Sadakata et al., 2009).

Expression of the R3 RPTP subfamily in the developing mouse retina. A, Schematic representation of the axon guidance of mouse contralateral and ipsilateral retinal axons at the optic chiasm. Retinal axons from the VT retinal region express high levels of the EphB1 receptor to sense ephrinB2 at the chiasm and turn ipsilaterally. On the other hand, EphB1-negative RGCs from all other retinal regions project contralaterally. B, Schematic representation of the topographic retinocollicular map and expression patterns of Eph receptors and ephrins. Nasal and temporal axons project to the posterior and anterior SC, respectively, while dorsal and ventral retinas are connected to the lateral and medial SC, respectively. Interactions between Eph receptors and ephrins play a pivotal role in the development of the topographic retinocollicular map. N, Nasal; T, temporal; D, dorsal; V, ventral; A, anterior; P, posterior; M, medial; L, lateral. C, RT-PCR analyses of the expression of R3 RPTPs in the P0 retina. D, Section in situ hybridization analyses of Ptprj and Ptpro in P0 mouse retinas. A–P and dorsal–ventral (D–V) sections were examined. Bottom, Enlarged images of the regions surrounded by dashed lines in the top panels. Scale bars, 250 μm. E, Quantitative real-time RT-PCR analyses of the expression of Ptprj, Ptpro, Epha4, and Ephb2 in the developing retina. The expression of each mRNA was examined by qRT-PCR and is shown as relative values to that of Gapdh mRNA. Data are shown as the mean ± SEM (n = 3).
Ptprj and Ptpro mRNAs were detected in the ganglion cell layer (GCL) and inner nuclear layer (INL; Fig. 1D): there did not appear to be an expression gradient along the anterior–posterior or dorsal–ventral axis. Color development for Ptpro mRNA required more time (∼24 h) than that for Ptprj (∼5 h), which reflected the lower expression level of Ptpro than that of Ptprj.
The gene expression of Ptprj, Ptpro, and Eph receptors during retinal development was examined using qRT-PCR. Ptprj mRNA peaked on P0 in the retina, and gradually decreased thereafter (Fig. 1E, left). Epha4 and Ephb2 mRNAs showed expression levels and patterns that were similar to those of Ptprj mRNA (Fig. 1E, right); expression peaked on P0 and gradually decreased thereafter. However, the expression level of Ptpro mRNA was markedly lower than those of other mRNAs, and its expression pattern differed (Fig. 1E, middle); Ptpro expression gradually increased and peaked on P4.
Upregulation of tyrosine phosphorylation of Eph receptors in retinas of Ptprj-KO and Ptprj/Ptpro-KO mice
To establish whether PTPRO and/or PTPRJ are involved in the regulation of Eph signaling in the retina, we investigated abnormalities in Ptpro-KO, Ptprj-KO, and DKO mice. The retinal layer structures of these knock-out mice were normal (Fig. 2A), and these mice had the same eyeball sizes at birth (data not shown). These results suggested that a deficiency in Ptpro or Ptprj did not have any effects on the development of the retinal architecture. Wild-type (WT) and three knock-out mice showed similar expression levels of the EphA4, EphB2, ephrinA2, and ephrinB2 proteins in the P8 retina (Fig. 2B).

Increased tyrosyl phosphorylation of Eph receptors in retinas of Ptprj-KO and DKO mice. A, Retinal layering of Ptpro-KO, Ptprj-KO, and DKO mice. Each retinal section was stained with DAPI. ONL, Outer nuclear layer. Scale bars, 100 μm. B, Western blotting of retinal lysates from WT, Ptpro-KO, Ptprj-KO, and DKO mice with anti-EphA4, anti-EphB2, anti-ephrinA2, anti-ephrinB2, or anti-tubulin antibodies. The right graphs show summaries of intensities relative to WT mice (n = 4/group). C, Increased tyrosine phosphorylation of Eph receptors in the retinas of Ptprj-KO and DKO mice. Western blotting of lysates with anti-pTyr (left) and anti-pTyr immunoprecipitates with anti-pTyr (middle, bottom) and anti-pEph (middle, top) antibodies. Right, A summary of the relative intensity of pEph/total pTyr proteins. Data are shown as the mean ± SEM (n = 4/group). The p values are as follows: (1) 0.014; (2) 0.0002; and (3) 0.002. D, Increased tyrosine phosphorylation of EphB receptors in the retinas of Ptprj-KO and DKO mice. EphB receptors were purified by a pull-down assay with ephrinB2-Fc. Western blotting of pull-down samples with anti-pEph antibodies (left, top) and anti-EphB2 (left, bottom). Right, A summary of the relative intensity of pEph/EphB2 proteins. Data are shown as the mean ± SEM (n = 4/group). The p values are as follows: (1) 0.006; (2) 0.002; (3) 0.018; (4) 0.005. E, Increased tyrosine phosphorylation of EphA receptors in the retinas of Ptprj-KO and DKO mice. EphA receptors were purified by a pull-down assay with ephrinA2-Fc. Western blotting of pull-down samples with anti-pEph (left, top) and anti-EphA4 antibodies (left, bottom). Right, A summary of the relative intensity of pEph/EphA4 proteins. Data are shown as the mean ± SEM (n = 4/group). The p values are as follows: (1) 0.0002; (2) 0.0001; (3) 0.001; (4) 0.0003. Sample sizes (n = 3) were calculated from a power analysis, with an effect size of 2.5 (obtained from our pilot experiments), a power of 0.8, and a significance level of 0.05. Data were analyzed by ANOVA. IP, Immunoprecipitation.
We examined the phosphotyrosine levels of proteins in the retina by Western blotting. No significant differences were detected in total phosphotyrosine levels (Fig. 2C, left). To compare the phosphotyrosine levels of Eph receptors, tyrosyl-phosphorylated proteins were immunoprecipitated with the anti-phosphotyrosine antibody and then analyzed using the antibody to anti-tyrosyl-phosphorylated EphA/B receptors. Phosphorylated Eph receptors were the most prominently detected at ∼120 kDa in each immunoprecipitated sample (Fig. 2C, middle, upper). We previously reported that mouse PTPRO and PTPRJ dephosphorylated Eph receptors in cultured cells (Sakuraba et al., 2013). The Ptpro-KO retina showed a phosphotyrosine level of Eph receptors that was similar to that in the WT retina (120 ± 8 % of WT, p = 0.59; Fig. 2C, right, lower). On the other hand, the phosphotyrosine levels of Eph receptors in the Ptprj-KO and DKO retina were significantly higher than that in the WT retina (Ptprj-KO: 158 ± 12 %, p = 0.014; DKO: 200 ± 11%, p = 0.0002; Fig. 2C, right, lower).
We then separately examined the phosphotyrosine levels of EphAs and EphBs. We performed pull-down experiments with ephrin-Fc proteins. EphB and EphA receptors were purified with ephrinB2-Fc and ephrinA2-Fc proteins, respectively, and then analyzed using the antibodies to anti-tyrosyl-phosphorylated EphA/B receptors. The Ptpro-KO retina showed a phosphotyrosine level of EphB receptors similar to that in the WT retina (113 ± 12% of WT, p = 0.93; Fig. 2D). On the other hand, the phosphotyrosine levels of EphB receptors in the Ptprj-KO and DKO retina were significantly higher than that in the WT retina (Ptprj-KO: 191 ± 10%, p = 0.006; DKO: 208 ± 27%, p = 0.002; Fig. 2D). In addition, the Ptpro-KO retina showed a phosphotyrosine level of EphB receptors similar to that in the WT retina (114 ± 7% of WT, p = 0.74), while the phosphotyrosine levels of EphA receptors were significantly higher in the Ptprj-KO and DKO retinas than in the WT retina (Ptprj-KO: 182 ± 13%, p = 0.0002; DKO: 194 ± 12%, p = 0.0001; Fig. 2E).
PTPRJ suppresses the sensitivity of VT retinal axons to ephrinB2
Retinal axons from the VT retinal region express high levels of the EphB receptor to sense ephrinB2 at the chiasm, and thus, turn ipsilaterally (Fig. 1A). To clarify whether a deficiency in PTPRO or PTPRJ affects the sensitivity of VT retinal axons to ephrinB2, we examined neurite outgrowth from VT retinal explants prepared from WT, Ptpro-KO, Ptprj-KO, and DKO mice (Fig. 3). In control Fc, many long neurites extended from VT explants, and no significant differences were observed in neurite outgrowth among the four genotypes (Fig. 3A,B). We observed a marked reduction in neurite outgrowth from all VT explants when cultured on ephrinB2-Fc (Fig. 3A,C). Neurite outgrowth from explants was more strongly suppressed in Ptprj-KO and DKO mice than in WT or Ptpro-KO mice (WT: 2.3 ± 0.3; Ptpro-KO: 2.1 ± 0.3, p = 0.95; Ptprj-KO: 0.5 ± 0.1, p = 0.0002; DKO: 0.4 ± 0.1, p = 0.00001; Fig. 3C), which is consistent with the results obtained for the tyrosine phosphorylation levels of EphB receptors in Ptpro-KO and DKO mice (Fig. 2D). These results indicated that the activities of EphB1 receptors in VT retinal axons are mainly regulated by PTPRJ.

PTPRJ regulates the sensitivity of retinal axons to ephrinB2. A, Representative images of VT retinal explants prepared from WT, Ptpro-KO, Ptprj-KO, or DKO mice at E15.5. Explants were cultured for 48 h in collagen gels containing control Fc or ephrinB2-Fc (2 μg/ml each). Scale bars, 500 μm. B, C, Quantification of the area of neurite outgrowth from VT explants in collagen gels containing control Fc (B) or ephrinB2-Fc (C). Values are shown as the mean ± SEM (n = 6/group). The p values are as follows: (1) 0.0002; (2) 0.00001; (3) 0.0006; (4) 0.0004. Sample sizes (n = 5) were calculated from a power analysis, with an effect size of 2.5 (obtained from our pilot experiments), a power of 0.8, and a significance level of 0.05.
PTPRJ suppresses the sensitivity of retinal axons to ephrinA2 and ephrinA5
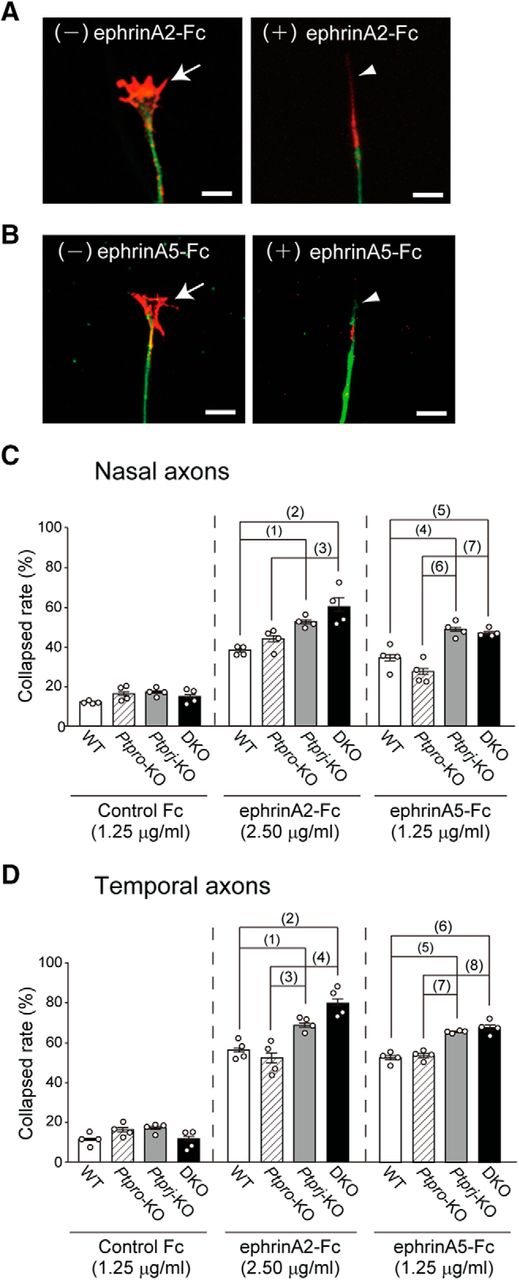
We examined growth cone collapse induced by ephrinA2-Fc or ephrinA5-Fc using axons growing from the cultured stripes of retinas prepared from WT, Ptpro-KO, Ptprj-KO, and DKO mice (Fig. 4). Figure 4, A and B, shows representative responses of WT retinal axons to ephrinA2 and ephrinA5, respectively. Control Fc protein had no effect on the collapse rate of nasal and temporal axons (Fig. 4C,D; left).

PTPRJ regulates the sensitivity of retinal axons to ephrinA2 and ephrinA5. Retinal strips prepared from WT, Ptpro-KO, Ptprj-KO, or DKO mice at E17.5 were cultured for 48 h and then stimulated with ephrinA2-Fc or ephrinA5-Fc for 30 min. A, B, Representative morphology of growth cones of WT nasal axons before (−) and after (+) a stimulation with ephrinA2-Fc (2.50 μg/ml; A) or ephrinA5-Fc (1.25 μg/ml; B). Retinal strips with growing axons were stained with anti-βIII tubulin (green) and phalloidin (red). Arrows and arrowheads indicate normal and collapsed growth cones, respectively. Scale bars, 10 μm. C, D, Growth cone collapse rates of nasal (C) and temporal (D) retinal axons after stimulation with control Fc (1.25 μg/ml), ephrinA2-Fc (2.50 μg/ml), or ephrinA5-Fc (1.25 μg/ml). Values are shown as the mean ± SEM (n = 4/group). The p values in C are as follows: (1) 0.008; (2) 0.0003; (3) 0.002; (4) 0.010; (5) 0.032; (6) 0.0003; (7) 0.0008. The p values in D are as follows: (1) 0.047; (2) 0.00004; (3) 0.005; (4) 0.00003; (5) 0.003; (6) 0.0007; (7) 0.005; (8) 0.001. Sample sizes (n = 3) were calculated from a power analysis, with an effect size of 2.5 (obtained from our pilot experiments), a power of 0.8, and a significance level of 0.05. Data were analyzed by ANOVA.
Stimulation with ephrinA2-Fc (2.50 μg/ml) markedly increased the collapse rate of nasal and temporal axons of all genotypes (Fig. 4C,D, middle). Nasal and temporal axons of Ptpro-KO mice did not show significant differences in the collapse rate with those of WT mice (nasal axons: WT, 38 ± 2%; Ptpro-KO, 44 ± 5%, p = 0.48; temporal axons: WT, 57 ± 2%; Ptpro-KO, 52 ± 5%, p = 0.70; Fig. 4C,D). However, nasal and temporal axons of Ptprj-KO and DKO mice both exhibited significantly higher collapse rates than those of WT mice (nasal axons: Ptprj-KO, 52 ± 2%, p = 0.008; DKO, 60 ± 5%, p = 0.0003; temporal axons: Ptprj-KO, 68 ± 2%, p = 0.047; DKO, 80 ± 3%, p = 0.00004; Fig. 4C,D).
There was also no significant difference in the collapse rate of nasal and temporal axons with ephrinA5-Fc (1.25 μg/ml) between Ptpro-KO and WT mice (nasal axons: WT, 34 ± 3%; Ptpro-KO, 27 ± 3%, p = 0.75; temporal axons: WT, 52 ± 2%; Ptpro-KO, 53 ± 2%, p = 0.99; Fig. 4C,D). In contrast, nasal and temporal axons of Ptprj-KO and DKO mice exhibited significantly higher collapse rates than those of WT mice (nasal axons: Ptprj-KO, 48 ± 2%, p = 0.010; DKO, 46 ± 2%, p = 0.032; temporal axons: Ptprj-KO, 65 ± 1%, p = 0.003; DKO, 67 ± 3%, p = 0.0007; Fig. 4C,D). Based on the dose-dependency experiments (data not shown), ephrinA5 appeared to be more active in retinal axons than ephrinA2.
Collectively, these results indicated that PTPRJ mainly influences the sensitivity of both nasal and temporal retinal axons to ephrinAs by controlling the activity of EphA receptors, which is consistent with the tyrosine phosphorylation levels of EphA receptors in Ptpro-KO and DKO mice (Fig. 2E). Expectedly, temporal axons showed higher sensitivity to ephrinAs than nasal axons in all groups.
PTPRJ is involved in the crossing decision of retinal axons at the OC
The OC is an important midline decision point for sorting retinal axons that project either ipsilaterally or contralaterally. EphB signaling has been implicated in axonal selection at the OC (Williams et al., 2003). We performed the anterograde DiI labeling of retinal axons from the right eye at E17.5 and P1 because most retinal axons have passed through the OC at E17.5, and contralateral and ipsilateral tracts are both established at P1 (Godement et al., 1987; Fig. 5A). Whole-mount views of the OC revealed marked differences in the sorting of axons between DKO and WT mice: the proportion of axons projecting ipsilaterally markedly increased in DKO mice (Fig. 5B,C, arrows). We measured the relative fluorescence of the ipsilateral optic tract and the total fluorescence intensities of both optic tracts as the ipsilateral index (Fig. 5A, right).

Ipsilateral projections of retinal axons at the OC in WT, Ptpro-KO, Ptprj-KO, and DKO mice. A, Schematic representation of DiI tracing of retinal axons and quantification of the projection index to the ipsilateral side or contralateral eye. Retinal axons in the right eye were anterogradely labeled with DiI. Axons that projected ipsilaterally and misrouted to the contralateral eyes are indicated by red and orange lines, respectively. The ipsilateral index was calculated by dividing the fluorescent intensity of the ipsilateral optic tract by the total fluorescent intensity of both tracts. The misrouting index was calculated as the ratio between the fluorescent intensity of the left optic nerve and that of the right optic nerve. B, C, Representative whole-mount ventral view of retinal axons at the OCs in WT, Ptpro-KO, Ptprj-KO, and DKO mice. Retinal axons in the right eye were labeled with DiI at E17.5 (B) and P1 (C). Arrows and asterisks indicate projections to the ipsilateral side and contralateral optic nerve, respectively. Scale bars, 200 μm. D, E, Index of projections to the ipsilateral side (n = 11 for each group). F, G, Index of projections to the contralateral optic nerve (n = 11 for each group). Sample sizes (n = 9) were calculated from a power analysis, with an effect size of 1.3 (obtained from our pilot experiments), a power of 0.8, and a significance level of 0.05.
At E17.5, no significant differences in the ipsilateral index were observed among Ptpro-KO, Ptprj-KO, and WT mice (WT, 8.8 ± 1.7%; Ptpro-KO, 8.6 ± 1.7%, p = 1.0; Ptprj-KO, 13.7 ± 3.1%, p = 0.64; Fig. 5D). However, the ipsilateral index of DKO mice was significantly higher than that of WT mice (WT, 8.8 ± 1.7%; DKO, 24.5 ± 4.3%, p = 0.003; Fig. 5D). When labeled at P1, the proportion of axons projecting ipsilaterally was significantly increased in Ptprj-KO and DKO mice (WT, 7.8 ± 0.6%; Ptpro-KO, 8.7 ± 1.2%, p = 0.97; Ptprj-KO, 13.3 ± 1.7%, p = 0.032; DKO, 13.6 ± 1.5%, p = 0.013; Fig. 5E). However, no significant differences were observed in ipsilateral projections between Ptpro-KO and WT mice (Fig. 5E). These results suggested that PTPRJ functions to confine ipsilateral projections by controlling EphB activity.
PTPRJ is involved in the prevention of axon misrouting to the opposite eye
In addition to increased ipsilateral projections, we found that larger proportions of retinal axons projected to the contralateral eye in Ptprj-KO and DKO mice than in WT mice (Fig. 5B,C, asterisks). Therefore, we measured relative fluorescence in the contralateral (left) optic nerves compared with the right optic nerve as the misrouting index (Fig. 5A).
At E17.5, Ptprj-KO and DKO mice, but not Ptpro-KO mice, showed a significantly higher index than WT mice (WT, 6.3 ± 1.0%; Ptpro-KO, 13. 7 ± 4.2%, p = 0.78; Ptprj-KO, 32.6 ± 7.0%, p = 0.009; DKO, 40.4 ± 7.5%, p = 0.0005; Fig. 5F). On P1, the proportion of axons projecting to the contralateral optic nerve remained significantly higher in Ptprj-KO and DKO mice (WT, 6.5 ± 0.7%; Ptpro-KO, 8.9 ± 1.3%, p = 0.068; Ptprj-KO, 13.1 ± 1.8%, p = 0.018; DKO, 16.9 ± 2.0%, p = 0.0001; Fig. 5G). However, the retinal axons of Ptpro-KO mice again showed no significant differences in projections to the contralateral optic nerve (Fig. 5G). These results suggested that PTPRJ play a role in suppressing axon misrouting to the contralateral optic nerve.
PTPRJ regulates the topographic mapping of retinal axons in the SC
To elucidate whether PTPRO and/or PTPRJ are involved in topographic retinocollicular projections in the SC, retinocollicular projections on P10 were investigated by anterograde labeling with DiI. DiI was introduced into the retina with small focal injections on P8 when retinocollicular projections have matured in mice (Simon and O'Leary, 1992; Hindges et al., 2002), and the contralateral SC was examined 48 h later (Fig. 6).

Projections of nasal retinal axons to the SC in WT, Ptpro-KO, Ptprj-KO, and DKO mice. Two days after a focal injection of DiI into the nasal periphery of the right retina on P8, DiI-labeled axons on the SC were analyzed. A, F, K, P, Schematic drawings of flat-mount right retinas. The locations of the DiI label in the right retina are indicated by dots. N, Nasal; T, temporal; D, dorsal; V, ventral. B, G, L, Q, Whole-mount dorsal views of the left SC (posterior up, anterior down). Projection patterns in WT and Ptpro-KO mice revealed that nasal retinal axons form TZs at a posterior position (B, G), whereas the projections of retinal axons in Ptprj-KO and DKO mice showed that the TZs of nasal axons anteriorly shifted (L, Q). White dotted lines outline the SC. P, Posterior; M, medial. C, H, M, R, Schematic drawings of B, G, L, and Q, respectively. D, I, N, S, Sagittal sections of the SC in B, G, L, and Q, respectively. In WT and Ptpro-KO mice, TZs were normal (arrowheads). In contrast, in Ptprj-KO and DKO mice, large numbers of nasal axons formed anteriorly shifted TZs (arrows) in addition to normal TZs (arrowheads). P, Posterior; V, ventral. E, J, O, T, Schematic drawings of D, I, N, and S, respectively. U, Analysis of the location of TZs in the SCs of WT, Ptpro-KO, Ptprj-KO, and DKO mice. The center of fluorescence (center of TZs) for each image was used to define the position of the TZ in the SC along the A–P axis. The position ranges between 0 and 20 (left). The right graph shows a summary of the location of TZs. Sample sizes (n = 10 each) were calculated from a power analysis, with an effect size of 1.2 (obtained from our pilot experiments), a power of 0.8, and a significance level of 0.05. Data were analyzed by ANOVA. Scale bars: B, G, L, Q, 600 μm; D, I, N, S, 200 μm.
In WT mice, a single retinal injection of DiI into the nasal periphery of the retina revealed a single DiI-labeled TZ in the posterior area of the contralateral SC in all mice (11 of 11; Fig. 6A–C). A sagittal section of the SC showed that nasal axons formed terminal arbors in the superficial layer in the posterior SC (Fig. 6D,E). In all Ptpro-KO mice (11 of 11), nasal axons developed proper TZs in the posterior SC, similar to those in WT mice (Fig. 6F–J). However, large proportions of nasal axons formed TZs at more anterior locations within the SC in Ptprj-KO and DKO mice (Fig. 6K–M,P–R). Sagittal sections clearly showed that axons from the nasal retina formed anteriorly shifted major TZs, in addition to minor TZs at the appropriate topographic location in the posterior part of the SC in Ptprj-KO (4 of 11) and DKO mice (6 of 11; Fig. 6N,O,S,T). A quantitative analysis of the distribution of TZs on the SC revealed that Ptprj-KO and DKO mice, but not Ptpro-KO mice, exhibited TZs that had anteriorly shifted more prominently than those of WT mice (WT, 0.9 ± 0.1; Ptpro-KO, 0.9 ± 0.1, p = 0.99; Ptprj-KO, 1.5 ± 0.2, p = 0.026; DKO, 2.0 ± 0.2, p = 0.0001; Fig. 6U).
We then examined projections from the ventral retinal regions: retinal axons from the ventral retina normally project to the medial part of the contralateral SC. Ventral retinal injections of DiI in WT mice revealed a single TZ located midway along the A–P axis within the medial SC (11 of 11; Fig. 7A–C). A sagittal section of the SC indicated that labeled WT axons formed terminal arbors in the superficial layer in the medial SC (Fig. 7D,E). In Ptpro-KO mice (11 of 11), ventral axons developed TZs in the medial SC, similar to WT mice (Fig. 7F–J). In contrast, in large proportions of Ptprj-KO and DKO mice, ventral retinal axons showed anteriorly shifted TZs within the SC (Fig. 7K–M,P–R). Sagittal sections showed that ventral retinal axons also formed anteriorly shifted TZs in addition to normal TZs in the medial part of the SC in Ptprj-KO mice (4 of 11) and DKO mice (7 of 11; Fig. 7N,O,S,T). A quantitative analysis of the distribution of TZs on the SC revealed that the TZs of Ptprj-KO and DKO mice, but not Ptpro-KO mice, had significantly shifted anteriorly (WT, 9.0 ± 0.46; Ptpro-KO, 9.2 ± 0.4, p = 0.98; Ptprj-KO, 11.3 ± 0.5, p = 0.005; DKO, 12.8 ± 0.5, p = 0.0001; Fig. 7U).

Projections of ventral retinal axons to the SC in WT, Ptpro-KO, Ptprj-KO, and DKO mice. Two days after a focal injection of DiI into the ventral periphery of the right retina on P8, DiI-labeled axons on the SC were analyzed. A, F, K, P, Schematic drawings of flat-mount right retinas. The locations of the DiI label in the right retina are indicated by dots. N, Nasal; T, temporal; D, dorsal; V, ventral. B, G, L, Q, Whole-mount dorsal views of the left SC (posterior up, anterior down). B, G, L, Q, Projection patterns in WT and Ptpro-KO mice showed that nasal retinal axons form TZs at a posterior position (B, G), whereas the projections of retinal axons in Ptprj-KO and DKO mice showed that the TZs of ventral axons anteriorly shifted (L, Q). White dotted lines outline the SC. P, Posterior; M, medial. C, H, M, R, Schematic drawings of B, G, L, and Q, respectively. D, I, N, S, Sagittal sections of the SC along the dotted lines in C, H, M, and R, respectively. In WT and Ptpro-KO mice, TZs were normal (arrowheads). In contrast, in Ptprj-KO and DKO mice, large numbers of ventral axons formed anteriorly shifted TZs (arrows) in addition to normal TZs (arrowheads). P, Posterior; D, dorsal. E, J, O, T, Schematic drawings of D, I, N, and S, respectively. U, Analysis of the location of TZs in the SC of WT, Ptpro-KO, Ptprj-KO, and DKO mice. The center of fluorescence (center of TZs) for each image was used to define the position of the TZ in the SC along the anteroposterior axis. The position ranges between 0 and 20 (left). The right graph shows a summary of the location of TZs. Sample sizes (n = 10 each) were calculated from a power analysis, with an effect size of 1.2 (obtained from our pilot experiments), a power of 0.8, and a significance level of 0.05. Data were analyzed by ANOVA. Scale bars: B, G, L, and Q, 600 μm; D, I, N, and S, 200 μm.
Regarding temporal retinal axons, temporoperipheral retinal axons project to the most anterior region of the SC, and difficulties are associated with detecting alterations in their projection. Therefore, we examined projections from the centrotemporal retinal regions (Fig. 8). In WT mice, the centrotemporal retinal injections of DiI revealed a rise to a single TZ located in the anterior area (11 of 11; Fig. 8A–C). Sagittal sections of the SC indicated that labeled WT axons formed terminal arbors in the superficial layer in the SC (Fig. 8D,E). In Ptpro-KO mice (11 of 11), we observed single TZs in the anterior SC, similar to WT mice (Fig. 8F–J). In contrast, in large proportions of Ptprj-KO and DKO mice, centrotemporal retinal axons showed anteriorly shifted TZs within the SC (Fig. 8K–M,P–R). Sagittal sections also exhibited centrotemporal retinal axons that formed anteriorly shifted TZs in addition to normal TZs in the anterior part of the SC in Ptprj-KO mice (5 of 11; Fig. 8N,O) and DKO mice (6 of 11; Fig. 8S,T). A quantitative analysis of the distribution of TZs on the SC revealed that the TZs of Ptprj-KO and DKO mice, but not Ptpro-KO mice, had significantly shifted anteriorly (WT, 16.7 ± 0.3; Ptpro-KO, 16.9 ± 0.2, p = 0.97; Ptprj-KO, 17.8 ± 0.2, p = 0.002; DKO, 17.9 ± 0.1, p = 0.0007; Fig. 8U).

Projections of centrotemporal retinal axons to the SC in WT, Ptpro-KO, Ptprj-KO, and DKO mice. Two days after a focal injection of DiI into the centrotemporal region of the right retina on P8, DiI-labeled axons on the SC were analyzed. A, F, K, P, Schematic drawings of flat-mount right retinas. The locations of the DiI label in the right retina are indicated by dots. N, Nasal; T, temporal; D, dorsal; V, ventral. B, G, L, Q, Whole-mount dorsal views of the left SC (posterior up, anterior down). Projection patterns in WT and Ptpro-KO mice showed that centrotemporal retinal axons form TZs at a posterior position (B, G), whereas the projections of retinal axons in Ptprj-KO and DKO mice revealed that the TZs of ventral axons anteriorly shifted (L, Q). White dotted lines outline the SC. P, Posterior; M, medial. C, H, M, R, Schematic drawings of B, G, L, and Q, respectively. D, I, N, S, Sagittal sections of the SC in B, G, L, and Q, respectively. In WT and Ptpro-KO mice, TZs were normal (arrowheads). In contrast, in Ptprj-KO and DKO mice, large numbers of centrotemporal axons formed anteriorly shifted TZs (arrows) in addition to normal TZs (arrowheads). P, Posterior; D, dorsal. E, J, O, T, Schematic drawings of D, I, N, and S, respectively. U, Analysis of the location of TZs in the SC of WT, Ptpro-KO, Ptprj-KO, and DKO mice. The center of fluorescence (center of TZs) for each image was used to define the position of the TZ in the SC along the anteroposterior axis. The position ranges between 0 and 20 (left). The right graph shows a summary of the location of TZs. The second mark from the bottom in WT represents an overlap of two dots. Sample sizes (n = 10 each) were calculated from a power analysis, with an effect size of 1.2 (obtained from our pilot experiments), a power of 0.8, and a significance level of 0.05. Data were analyzed by ANOVA. Scale bars: B, G, L, and Q, 600 μm; D, I, N, and S, 200 μm.
Thus, altered anteroposterior mapping was evident in the retinocollicular projections of Ptprj-KO and DKO mice, suggesting that the retinal axons of Ptprj-KO and DKO mice had hypersensitivity to ephrinAs distributed gradiently along the A–P axis in the SC. However, no obvious alterations were detected along the M–L axis in any of the retinal axons tested among all genotypes.
c-Abl activity is involved in the ephrin-induced growth cone collapse of retinal axons and PTPRJ controls c-Abl activity
c-Abl kinases consisting of c-Abl and Arg (Abl-related gene) are a unique family of non-receptor type tyrosine kinases. Their C-terminal portion harbors an actin-binding domain, and, thus, c-Abls have been implicated in the rearrangement of the actin cytoskeleton (Wills et al., 1999; Woodring et al., 2003). In cancer cells and intestinal stem cells, ephrin–Eph signaling is reportedly mediated by c-Abl (Noren et al., 2006; Genander et al., 2009). In retinal axons, ephrinA5-induced growth cone collapse is inhibited by the c-Abl inhibitor STI571 (imatinib; Harbott and Nobes, 2005). However, the role of c-Abl in Eph signaling in retinal axons has remained unclear.
To reveal the functional significance of c-Abl in Eph signaling in retinal axons, we examined the activation of c-Abl after the stimulation of Eph receptors with ephrinB2 or ephrinA2 using dissociated retinal neurons. The phosphorylation at tyrosine 412 (Y412) in the activation loop of c-Abl was assessed as an indicator of the activation of c-Abl. The anti-tyrosyl-phosphorylated c-Abl antibody (anti-pAbl) detected a band of ∼135 kDa, the predicted size of c-Abl (Fig. 9A). The treatment with ephrinB2-Fc increased the phosphorylation level of c-Abl in retinal cells by 1.2 ± 0.1-fold (p = 0.23) at 15 min and 1.7 ± 0.2-fold (p = 0.013) at 30 min (Fig. 9A). The stimulation of dissociated retinal cells with ephrinA2-Fc proteins also induced the activation (phosphorylation) of c-Abl within 15 min (1.6 ± 0.2-fold, p = 0.022), and this phosphorylation level was sustained for at least 30 min (1.8 ± 0.1-fold, p = 0.004; Fig. 9B). These results suggested that c-Abl was activated by ephrin–Eph signaling.

Increased tyrosine phosphorylation of c-Abl in retinas of Ptprj-KO and DKO mice. A, Western blotting of cell lysates prepared from dissociated retinal cells treated with or without ephrinB2-Fc (2.0 μg/ml) for 15 or 30 min. The antibodies used are indicated to the right. A summary of the relative ratio of pAbl/Abl is shown on the right side (n = 4). B, Western blotting of cell lysates prepared from dissociated retinal cells treated with or without ephrinA2-Fc (1.5 μg/ml) for 15 or 30 min. The antibodies used are indicated to the right. A summary of the relative ratio of pAbl/Abl is shown on the right side (n = 4). C, In vitro dephosphorylation assay of the c-Abl protein by PTPRO or PTPRJ. Tyrosine-phosphorylated Myc-c-Abl proteins were incubated with GST, GST-PTPRO, or GST-PTPRJ. After the reaction, c-Abl proteins were analyzed with anti-pTyr and anti-Myc antibodies. The right graph is a summary of the ratio of pAbl/Abl (n = 4). D, Coimmunoprecipitation of c-Abl with the substrate-trapping (DA) mutant of PTPRO or PTPRJ. A Myc-tagged c-Abl expression construct was cotransfected with the control empty vector or expression construct of HA-tagged PTPRO-WT, PTPRO-DA mutant, PTPRJ-WT, or PTPRJ-DA mutant in HEK293T cells. Immunoprecipitation was performed using an anti-HA or anti-Myc antibody. Immunoprecipitates were analyzed with anti-HA and anti-Myc antibodies by Western blotting. E, Dephosphorylation of c-Abl by PTPRO and PTPRJ in HEK293T cells. A Myc-tagged c-Abl expression construct was cotransfected with a control empty vector or expression construct of HA-tagged PTPRO-WT or PTPRJ-WT in HEK293T cells. Cell lysates were analyzed with the indicated antibodies by Western blotting. The right graph is a summary of the relative ratio of pAbl/Abl (n = 4). F, Increased tyrosine phosphorylation of c-Abl in the retinas of Ptprj-KO and DKO mice. Retinal lysates prepared from WT, Ptpro-KO, Ptprj-KO, and DKO mice were analyzed with the indicated antibodies. Right, A summary of the relative ratio of pAbl/Abl. Values are shown as the mean ± SEM (n = 4). Sample sizes (n = 3) were calculated from a power analysis, with an effect size of 2.5 (obtained from our pilot experiments), a power of 0.8, and a significance level of 0.05. Data were analyzed by a one-way ANOVA.
To test whether PTPRO and PTPRJ directly dephosphorylate c-Abl as well as Eph receptors, we performed in vitro experiments using purified proteins. GST-PTPRO and GST-PTPRJ both efficiently dephosphorylated c-Abl proteins prepared from HEK293T cells by immunoprecipitation (GST, 1; GST-PTPRO, 0.40 ± 0.05, p = 0.001; GST-PTPRJ, 0.43 ± 0.07, p = 0.001; Fig. 9C). These results indicated that PTPRO and PTPRJ dephosphorylated specific phosphotyrosine residues in c-Abl proteins. Furthermore, we performed coimmunoprecipitation experiments using WT and substrate-trapping DA mutants of PTPRO and PTPRJ: the DA mutant, in which the general aspartic acid (D) residue in the PTP domain is converted to alanine (A), is deficient in PTPase activity, but retains the ability to recognize and stably bind substrates (Flint et al., 1997). The DA mutants of PTPRO and PTPRJ, but not WT, coimmunoprecipitated with c-Abl (Fig. 9D), indicating that c-Abl is recognized as a substrate by PTPRO and PTPRJ in cells. Furthermore, when c-Abl was coexpressed together with full-length PTPRO or PTPRJ in HEK293T cells, the tyrosine phosphorylation levels of c-Abl were significantly reduced (WT, 1; PTPRO, 0.46 ± 0.08, p = 0.002; PTPRJ, 0.27 ± 0.05, p = 0.0001; Fig. 9E). Collectively, these results indicated that PTPRO and PTPRJ dephosphorylate c-Abl as a physiological substrate.
We confirmed the phosphotyrosine levels of c-Abl in the retina between knock-out mice. Western blotting verified that the expression levels of c-Abl were similar in the P8 retinas of WT and knock-out mice (Fig. 9F). pAbl levels were significantly higher in Ptprj-KO and DKO retinas than in WT retinas (WT, 1; Ptpro-KO, 1.29 ± 0.12, p = 0.50; Ptprj-KO, 1.69 ± 0.17, p = 0.028; DKO, 2,07 ± 0.21, p = 0.001; Fig. 9F). These results indicated that PTPRJ predominantly regulates c-Abl activity in the retina, and that the abnormal projections of retinal axons observed in Ptprj-KO and DKO mice were attributable to the aberrant activation of c-Abl in these mice.
We then investigated whether c-Abl is necessary for the transduction of the repellant signal by Eph receptors in retinal axons. We examined whether the inhibition of neurite outgrowth from VT retinal explants by ephrinB2 was ameliorated by a treatment with imatinib (c-Abl inhibitor) or DPH (c-Abl activator; Yang et al., 2011; Dunn et al., 2015; Liu et al., 2017) using VT retinal explants. The imatinib treatment had no effect on neurite extension by control Fc, but significantly suppressed the inhibition of neurite outgrowth by ephrinB2-Fc (0.7 ± 0.2 vs 4.0 ± 0.3, p = 0.000001; Fig. 10A). The treatment with DPH markedly inhibited neurite extension from VT explants (7.2 ± 0.5 vs 1.3 ± 0.1, p = 0.000001), and DPH enhanced the effects of ephrinB2-Fc on neurite extension (1.0 ± 0.2 and 0.2 ± 0.1, p = 0.047; Fig. 10A). These results implicated c-Abl kinase in the inhibition of neurite extension by ephrinB2.

Ephrin signaling is partially mediated by c-Abl in the retina. A, Effects of imatinib and DPH on the inhibition of neurite outgrowth from ventrotemporal (VT) retinal explants by ephrinB2-Fc. Representative images of VT retinal explants cultured for 48 h in collagen gels containing imatinib (10 μg/ml) or DPH (20 μg/ml) with or without ephrinB2-Fc (2.0 μg/ml; the left panels). Scale bars, 500 μm. A summary of the quantification of the area of neurite outgrowth is shown on the right side. Values are shown as the mean ± SEM (n = 6/group). The p values are as follows: (1) 0.000001; (2) 0.000001; (3) 0.00003; (4) 0.035; (5) 0.000001; (6) 0.047. B, Effects of imatinib and DPH on retinal growth cone collapse induced by ephrinA2-Fc. Morphology of temporal retinal growth cones, which were treated with imatinib (10 μg/ml), DPH (20 μg/ml), or vehicle for 30 min. They were then reacted with or without ephrinA2-Fc (1.5 μg/ml). A summary of the quantification of growth cone collapse is shown on the right side. Values are shown as the mean ± SEM (n = 4). The p values are as follows: (1) 0.0001; (2) 0.001; (3) 0.0001: (4) 0.001; (5) 0.014; (6) 0.001. Sample sizes were calculated from a power analysis, with an effect size of 2.5 (obtained from our pilot experiments), a power of 0.8, and a significance level of 0.05. Data were analyzed by ANOVA.
We then investigated whether ephrinA2-induced growth cone collapse was affected by a treatment with imatinib or DPH using temporal retinal axons. The imatinib treatment had no effect on the basal growth cone collapse rate, but significantly suppressed that induced by ephrinA2-Fc (31 ± 3 and 21 ± 1%, p = 0.0001; Fig. 10B). The treatment with DPH alone increased the collapse rate (9 ± 1% to 39 ± 2%, p = 0.001), and DPH enhanced the effects of ephrinA2-Fc on growth cone collapse (39 ± 2% and 70 ± 1%, p = 0.001; Fig. 10B). These results suggested that c-Abl kinase also plays a pivotal role in the growth cone collapse of retinal axons induced by ephrinA molecules.
Activation of c-Abl induces abnormal axonal projections similar to those observed in Ptprj-KO and DKO mice
We investigated whether the forced activation of c-Abl kinases in vivo induces abnormal retinal projections that are similar to those observed in Ptprj-KO and DKO mice. We injected DPH (20 mg/kg) into pregnant mice daily between E11.5 and E16.5, and embryos were fixed and analyzed on E17.5. In DPH-treated embryos, the proportion of axons projecting ipsilaterally markedly increased (ipsilateral index: control, 14.0 ± 1.2%; DPH treated, 23.7 ± 2.4%; p = 0.004; Fig. 11A,B). Furthermore, the proportion of axons projecting into the contralateral optic nerve also significantly increased in DPH-treated mice (misrouting index: control, 4.6 ± 0.9%; DPH treated, 8.9 ± 1.4%; p = 0.028; Fig. 11A,C). These phenotypes were similar to those in Ptprj-KO and DKO mice.

Aberrant activation of c-Abl leads to impaired retinal axonal projections. A, Whole-mount ventral views of projections at the OC in vehicle or DPH-treated mice. Pregnant C57BL/6 mice were treated with DMSO (vehicle) or DPH (20 mg/kg) daily from E12.5 to E16.5, and retinal axons in the right eye were then labeled with DiI at E17.5. Scale bars, 200 μm. Arrows and asterisks indicate projections to the ipsilateral side and opposite retina, respectively. B, Index of ipsilateral projections in DPH-treated mice (n = 11 for each group). C, Index of misrouting to the contralateral retina in DPH-treated mice (n = 11 for each group). D, I, Schematic drawings of flat-mount right retinas. DMSO or DPH (20 mg/kg) was injected into mice daily between P0 and P8. A focal injection of Dil into the nasal periphery of the right retina was performed on P8, and the location of DiI in the retina and SC was analyzed on P10. The locations of the DiI label in the nasal periphery of the right retina are indicated by dots. Nasal axons to the right and dorsal axons to the top. N, Nasal; D, dorsal. E, J, Representative whole-mount dorsal views of SC. P, Posterior; M, medial. F, K, Schematic drawings of E and J, respectively. G, L, Sagittal sections of the SC in E and J, respectively. Sagittal sections were prepared along the indicated lines in F and K. A normal TZ was observed in the control mouse (arrowhead). In contrast, large numbers of nasal axons formed an anteriorly shifted TZ in the DPH-treated mouse (arrow). P, Posterior; V, ventral. H, M, Schematic drawings of G and L, respectively. N, Quantitative analysis of the location of TZs in control and DPH-treated mice (n = 11 for each group). Sample sizes (n = 10) were calculated from a power analysis, with an effect size of 2.5 (obtained from our pilot experiments), a power of 0.8, and a significance level of 0.05. Scale bars: E and J, 600 μm; G, L, 200 μm.
We also examined the effects of the DPH treatment on retinal axonal projections in the SC. We intraperitoneally injected DPH (20 mg/kg) into newborn mice daily between P0 and P8, and DiI was introduced into the nasal periphery by focal injection on P8. In vehicle-treated mice, nasal retinal axons formed proper TZs in the posterior SC (Fig. 11D–H). In contrast, significant proportions of nasal retinal axons in DPH-treated mice formed TZs at more anterior locations within the SC (Fig. 9I–M). Sagittal sections clearly showed that axons from the nasal retina formed anteriorly shifted TZs in the posterior part of the SC (Fig. 11G,H,L,M). A quantitative analysis of the distribution of TZs on the SC revealed that the TZs of DPH-treated mice had significantly shifted more anteriorly than those in control mice (relative location of TZ on the SC: control, 1.2 ± 0.1; DPH treated, 1.7 ± 0.1; p = 0.004; Fig. 11N). These phenotypes by the DPH treatment were again similar to those observed in Ptprj-KO and DKO mice. Therefore, the increased activity of c-Abl kinases in Ptprj-KO and DKO mice may be the cause of the abnormal projections of retinal axons observed in mutant mice.
Discussion
Retinocollicular projections are a good model for elucidating the mechanisms underlying axon guidance and topographic map formation (Brown et al., 2000; Carreres et al., 2011; Feldheim et al., 2004). In the present study, we demonstrated that PTPRJs are required for retinal axon guidance at the OC and retinocollicular map formation in mice. We showed that PTPRJs are strongly expressed in RGCs at appropriate developmental stages to regulate guidance and mapping (Fig. 1). We found that the phosphorylation levels of EphA and EphB receptors were upregulated in the retinas of Ptprj-KO and DKO mice (Fig. 2). The retinal axons of Ptprj-KO and DKO mice showed an enhanced response to ephrinA2 and ephrinB2 proteins in growth cone collapse assays (Fig. 4) and neurite extension assays (Fig. 3), respectively. These results suggested that ephrin–Eph repulsive signaling was upregulated in Ptprj-KO and DKO mice. Consistent with these results, axon-tracing analyses in vivo revealed that the proportion of retinal axons that misrouted to the ipsilateral side or to the opposite eye through the OC was greater in Ptprj-KO mice and DKO mice than in WT mice (Fig. 5). These projection phenotypes at the OC are explained by the following mechanisms: axons with EphB activities higher than a certain level receive hyper-repulsive signals, avoid the midline chiasm expressing ephrinB2, and project ipsilaterally or to the contralateral eye. Furthermore, the nasal, ventral, and centrotemporal retinal axons of Ptprj-KO and DKO mice commonly exhibited abnormal projections in which they made ectopic TZs anteriorly shift in the SC (Figs. 6, 7, 8). These abnormal projections are explained by EphA receptors in Ptprj-deficient retinal axons having an enhanced response to ephrinAs in the SC due to the lack of suppression by PTPRJ.
In addition, we revealed that PTPRJ dephosphorylated c-Abl located downstream of Eph receptors (Fig. 9). We demonstrated that PTPRJ recognized c-Abl as a substrate and dephosphorylated it in HEK293T cells (Fig. 9C–E). The phosphorylation levels of c-Abl were consistently upregulated in the retinas of Ptprj-KO and DKO mice (Fig. 9F). Ephrin–Eph signaling is reportedly mediated by c-Abl kinase in some cell types (Chang et al., 2008, Genander et al., 2009). We found that c-Abl was activated in retinal cells following stimulation with ephrinB2 and ephrinA2 (Fig. 9A,B). The requirement of c-Abl activity for repulsive Eph signaling is clear from our in vitro neurite extension assays and collapse assays; the inhibitory effects of ephrinB2 on neurite extension were significantly suppressed by a c-Abl inhibitor (imatinib) and enhanced by a c-Abl activator (DPH; Fig. 10A), and ephrinA2-induced collapse was also suppressed by imatinib and enhanced by DPH (Fig. 10B). Furthermore, we demonstrated that the proportion of retinal axons that misrouted to the ipsilateral side or to the opposite eye through the OC was increased in DPH-treated animals, suggesting that repulsive ephrinB–EphB signaling is upregulated by DPH. We also showed that c-Abl was involved in the appropriate topographic mapping of retinal axons in the SC. In mice treated with DPH, nasal axons aberrantly terminated anterior to the appropriate position in the SC (Fig. 11). This anterior shift is expected if repulsive signaling by EphA along the A–P axis in the SC is enhanced by the activation of c-Abl. Collectively, our results indicate that PTPRJ suppresses ephrin–Eph–c-Abl repulsive signaling in the retinal axons of mice through the dephosphorylation of both Eph and c-Abl kinases.
Previous studies that analyzed retinocollicular projections in EphB-deficient mice (Hindges et al., 2002; Thakar et al., 2011) indicated that EphBs are necessary for topographic map formation along the M–L axis. However, there were no alterations in retinal axonal projections along the M–L axis in the SC of all genotypes. Therefore, our results indicate that c-Abl is required for the transduction of repulsive, but not attractive, signals by Eph receptors in retinal axons. The molecular mechanisms for attractive signaling by EphB receptors have not yet been elucidated, but may differ from those of repulsive signaling by Eph receptors. It is important to note that Wnt–Ryk signaling reportedly plays a pivotal role in retinal axonal projections along the M–L axis in the SC (Lim et al., 2010).
We previously showed that PTPRO, but not PTPRJ, dephosphorylated Eph receptors in chicks and that PTPRO plays an important role in retinotectal topographic map formation (Shintani et al., 2006). However, murine R3 RPTP subfamily members (PTPRB, PTPRH, PTPRJ, and PTPRO) equally dephosphorylated Eph receptors as substrates (Sakuraba et al., 2013). We revealed that Ptpro and Ptprj were expressed in the developing mouse retina (Fig. 1C). We herein showed that murine PTPRO and PTPRJ equally dephosphorylated Eph receptors and c-Abl in in vitro analyses (Figs. 9C–E). However, the expression level of Ptpro was markedly lower than that of Ptprj, and the temporal expression profile of Ptpro was distinct from those of Ptprj and Ephs (Fig. 1E). Consistently, we did not detect any evident alterations in the projections of retinal axons in Ptpro-KO mice, findings similar to those of a previous study (Gatto et al., 2013). We did not detect alterations in the gene expression of Ptprj in Ptpro-KO mice or Ptpro in Ptprj-KO mice, which again suggests the small contribution of PTPRO to retinal axonal projections (data not shown). Thus, species differences exist in enzyme–substrate relationships between R3 RPTP subfamily members and Eph receptors: in mouse retinal axons, PTPRJ predominantly regulates repulsive Eph signaling, in contrast to PTPRO in chicks.
It is important to note that PTPRJ dephosphorylates several PTKs (Sakuraba et al., 2013; Shintani et al., 2015, 2017). Alterations in the activities of RPTKs other than Ephs may also contribute to the defects observed in Ptprj-KO and DKO mice. The hepatocyte growth factor receptor, a substrate of PTPRJ, has been implicated in axon outgrowth (Pante et al., 2005; Sakuraba et al., 2013). We found that the length of axons extending from retinal explants was similar among WT, Ptprj-KO, and DKO mice, and there did not appear to be a delay in the arrival of retinal axons at the SC in Ptprj-KO and DKO mice (data not shown). These results suggest the absence of general defects in axon outgrowth by Ptprj-KO and DKO. On the other hand, PTPRO has been shown to regulate the axonal branching of trigeminal ganglion cells by inhibiting TrkB and Ret signaling (Gatto et al., 2013). TrkB has also been implicated in the regulation of the axonal branching of retinal axons (Marler et al., 2008; Suzuki et al., 2014). However, alterations in the tyrosine phosphorylation level of TrkB were not detected in the retina of Ptprj-KO or DKO mice (our unpublished observations). Nevertheless, PTPRJ may control axonal projections through other signaling pathways. Further studies are needed to identify additional physiological substrates for PTPRJ.
Our results indicated that PTPRJ plays critical roles in retinocollicular projections by controlling the repulsive signal by Eph and c-Abl activities. To the best of our knowledge, this is the first study to implicate PTPRJ in axon guidance in mammals. However, ephrin reverse signaling has also been suggested to contribute to topographic retinocollicular map formation, as well as Eph forward signaling (Yates et al., 2001, 2004; Thakar et al., 2011); the Eph–ephrin interaction transduces signals bidirectionally not only into Eph-expressing cells (forward signaling), but into ephrin-expressing cells (reverse signaling). In addition, competition between axons based on repellant interactions plays an important role in mapping (Brown et al., 2000; Yates et al., 2004; Tsigankov and Koulakov, 2006). In this mechanism, the relative rather than absolute levels of EphA forward signaling appear to be important for mapping (Brown et al., 2000; Reber et al., 2004). It currently remains unclear whether PTPRJ is involved in the regulation of ephrin reverse signaling and axonal competitive signaling. The cell type-specific gene targeting of Ptprj will contribute to PTPRJ functions in these signals being elucidated in future studies.
Footnotes
This work was supported by grants from the Ministry of Education, Culture, Sports, Science, and Technology of Japan (to M. N.). We thank Drs. E. Gaudio, F. Trapasso, and A. Fusco for providing us with targeted Ptprj heterozygous mice; the RIKEN Bio-Resource Center for providing us with targeted Ptpro heterozygous mice (T. Shirasawa generated the mouse line at the Tokyo Metropolitan Institute of Gerontology); K. Wada and Y. Dokyo for technical assistance; and A. Kodama for secretarial assistance; members of the Model Animal Research Facility of the National Institute for Basic Biology (NIBB) Bioresource Center for animal care; and the Functional Genomics Facility in the NIBB Core Research Facilities for technical support.
The authors declare no competing financial interests.
- Correspondence should be addressed to either Masaharu Noda or Takafumi Shintani, Division of Molecular Neurobiology, National Institute for Basic Biology, Okazaki 444-8787, Japan, madon{at}nibb.ac.jp or shin{at}nibb.ac.jp


