

Article Figures & Data
Figures
- Figure 1.
Summation of local synaptic inputs and global APs evoked by glomerular stimulation is mostly supralinear. A, Schematic depiction of experiment and example of individual experiment. Left, Stimulation of mitral cells via glomerular stimulation electrode, whole-cell recording of responses (EPSPs, APs) from GC, which is filled with Ca2+-sensitive dye via the patch pipette to allow for two-photon imaging of synaptic responses in individual spines. Right, bottom, Vm recording from GC soma with similar stimulation strength: EPSP or AP. Middle and top right, Fluorescence transients (line scans) across spine and adjacent dendrite. Four types of responses: 00, no substantial ΔCa2+ in spine or dendrite; 10, ΔCa2+ limited to spine; 01, similar ΔCa2+ in spine and dendrite; 11, larger ΔCa2+ in spine than in dendrite, ΔCa2+ in dendrite similar to 01. Middle, Two-photon scan of imaged spine and dendrite. B, The matrix of possible spine states with respect to ΔCa2+ as inferred from the responses: 00, no local input, no AP; 10, local synaptic input to spine head; 01, global AP without local activation; 11, coincident global AP and local activation. The associated ΔCa2+ is depicted as red intensity. C, Left, Cumulative scatter plot of n = 11 experiments. x axis represents arithmetic sum of spine ΔF/F amplitudes for AP and local input (10+01). y axis represents spine ΔF/F amplitudes for coincident activation 11. Right panel, SE (normalized amplitudes 11/(10+01)). Mean and individual values of coincident activation (c) compared with arithmetic summation (as). Error bars indicate SD. *p < 0.05. A, Left, Scheme modified from Egger et al. (2005). Right, Modified from Egger (2008). C, Left, Reanalyzed from Egger (2008) with additional data from two more spines.
- Figure 2.
Simulation methods 1. NEURON model and simulation of individual events. A, Schematic depiction of essential features of the model (ion conductances and Ca2+ sequestration in spine and dendrite, neck resistance RN). B, Simulated individual signals. Left, The synaptic input mimicked by pulse of glutamate. Right, sAP. Top, Stimulus and spine and somatic membrane potential. For the synaptic input, a spine spike is evoked in the spine head that does not propagate into the adjacent dendrite and also not to the soma (gray trace), whereas Vm (t) is identical in spine and soma for the sAP; therefore, the somatic response is hidden by the spine response. Middle, Associated Ca2+ currents in spine head. Bottom, Changes in intracellular Ca2+ and associated fluorescence transients in spine and adjacent dendrite (gray trace). For the spine spike, there is no detectable transient in the dendrite.
- Figure 3.
Simulation methods 2. Conversion of Ca2+ transients into fluorescence changes under our experimental conditions (100 μm OGB-1). A, Example analysis of ΔF/F responses to single somatically evoked APs and AP trains (50 Hz) to estimate the saturation limit for the reliable detection of absolute ΔCa2+ changes based on ΔF/F. (ΔF/F)sAP was fitted with a single exponential; the fit was then linearly summated and compared with (ΔF/F)50Hz. The saturation limit was chosen as the ΔF/F value above which the recorded signal would strongly deviate from the summated fit. B, Simulation of concentration change of the Ca2+-dye complex during AP train based on Kd = 200 nm. The reduced increase, and therewith the reduction in additional ΔF/F in response to later APs, was then applied to adjust the conversion in C from a linear increase to a sublinear increase. C, Lookup table for conversion of ΔCa2+ into ΔF/F, used up to the mean saturation limit of 125% derived from A.
- Figure 4.
Simulated pairing of spine spike and global AP at various time intervals Δt predicts SE. A, Simulation of Vm at the spine head for spine spike and somatically evoked AP at various pairing intervals Δt. Negative Δt corresponds to the sAP preceding the spine spike; positive Δt corresponds to the spine spike preceding the sAP. Δt is the difference between the respective stimulus onsets, whereas Δt′ denotes Δt corrected for the offset between the two peaks (top right). B, Simulations of ΔF/F for various timing intervals Δt and comparison with the arithmetic sum of the individual responses from Figure 2 spaced by the same Δt. C, SE, the maximal ΔF/F amplitude for each pairing divided by the maximal ΔF/F for the corresponding arithmetic sum, versus pairing interval Δt′ (Δt′ = Δt −2.2 ms, corrected for the offset between the individual spikes). Inset, Magnification of the Δt interval between −10 ms and 10 ms. D, Effect of pairing on actual time interval between the two spike peaks Δtpeaks. Top, Simulated Vm at the spine head. Black line indicates spine spike simulation alone. Colored lines indicate pairing at the denoted Δt′ intervals (ms). Bottom, Deviation ∂t from the set interval Δt′, depending on Δt′. For increasingly negative intervals, there is first repulsion and then attraction.
- Figure 5.
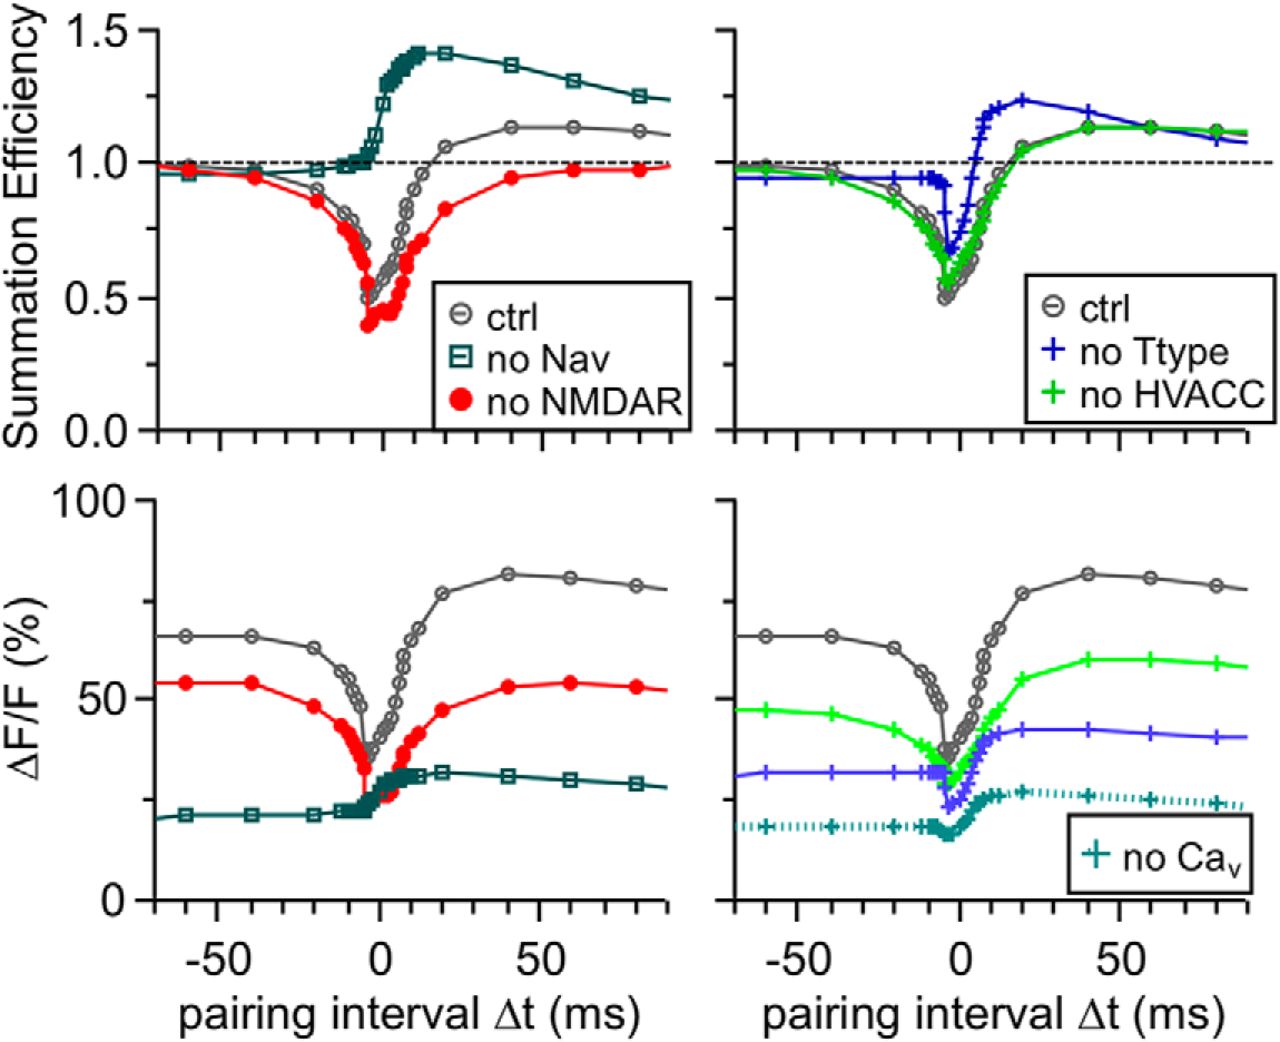
Pharmacology in silico. Effect of selective removal of voltage-dependent conductances Nav, Cav, or NMDAR from the spine head on SE. Top panels, Effect of blockade on SE versus pairing interval Δt compared with control (from Fig. 4C). Bottom panels, Effect of blockade on absolute changes in ΔF/F versus pairing interval Δt compared with control (peak ΔF/F values from Fig. 4B). Left panels, Removal of either Nav conductances or NMDARs compared with control. Right panels, Removal of either T-type or HVA Cav compared with control. Removal of both Cavs at the same time shown in bottom right panel only, for sake of clarity.
- Figure 6.
Robustness of simulation with respect to conductance densities in the spine head and RNeck. Each plot represents the SE(Δt) from Figure 4C (black traces) and the random perturbations within a regimen of 50%–200% of the original values of the tested parameters (lighter colored or gray traces; n = 30 for each parameter or less, if the perturbed model could not generate a full-blown spine spike). Each trace in each panel represents the model output for one different set of parameter values. The original values are given in Table 1, except for RNeck, which was 1.7 GΩ (because its value is derived from other NEURON parameters, see Materials and Methods). Tested parameters were the conductances for Nav and Kv (covaried), the conductances for Ca2+ (for NMDAR, HVACC, and T-type CC each), the AMPAR conductance, and the neck resistance.
- Figure 7.
Experimental validation. TPU of glutamate at individual spines in coincidence with global APs for various Δt values. A, Example of individual experiment. Scan of spine and dendrite with location of uncaging spot. Top, Vm recordings from GC soma of uncaging-evoked EPSP (uEPSP, left) or AP evoked by somatic current injection (sAP, right). Middle and bottom, Averaged fluorescence transients (line scans) across spine and adjacent dendrite. Five types of protocols: 10, uncaging at spine alone; 01, sAP alone, 3 times; 11, pairing of uncaging and sAP for three different intervals −10, 0, and +10 ms. B, Cumulative graph of absolute ΔF/F amplitudes in response to the three pairing protocols for 9 individual experiments. Lines connect data points from one experiment. Solid diamonds represent the experiment shown in A. C, Cumulative graph and statistical analysis of the associated summation efficiencies in response to the three pairing protocols. Open squares represent individual experiments. Solid squares represent mean. Error bars indicate SD. Rightmost data point indicates cumulative SE for coincident local input and synaptically evoked AP from Figure 1C for comparison. p values of significance levels are given in Results. *p < 0.05; **p < 0.01.
- Figure 8.
Latency of APs evoked by glomerular input and prediction of Ca2+ transients in the absence of dye. A, Analysis of the latency Δt″ between EPSP onset and AP peak for synaptically evoked GC APs. Left, Individual example somatic voltage recording of EPSP (gray trace) and AP (black trace). The stimulation artifact due to extracellular electrical stimulation of the glomerulus (compare Fig. 1A,B) is capped. Right, Cumulative data of latency Δt″. Individual experiments (open diamonds) and mean value ± SD (solid diamond). B, Individual simulated [ΔCa2+]i transients for selected pairing intervals as to illustrate the increased dynamic range in the absence of exogenous buffer/dye (thick black traces). Thin black traces represent the arithmetic sum of local input and global AP 10 + 01 in the absence of dye. Thick gray traces represent the simulated [ΔCa2+]i transients for the respective pairing intervals in the presence of 100 μm OGB-1 (which also underlie the respective ΔF/F transients shown in Fig. 4B). C, Predicted SE of [ΔCa2+]i in the absence of exogenous buffer/dye; result for dye plotted for comparison.


Tables
Parameter, location Mechanism Value gNav spine and dendrite Nav conductance density 0.5 S/cm2 gKv spine and dendrite Kv conductance density 0.01 S/cm2 gTtype spine T-type Ca2+ conductance density 0.00015 S/cm2 gTtype dendrite T-type Ca2+ conductance density 0.0003 S/cm2 gHVACC spine HVA Ca2+ conductance density 0.0004 S/cm2 gHVACC dendrite HVA Ca2+ conductance density 0.0005 S/cm2 gAMPA Synaptic AMPA receptor conductance 2000 pS gNMDA (total) Synaptic NMDA receptor conductance (all ions) 400 pS gNMDA (Ca2+) Synaptic NMDA receptor Ca2+ conductance 17 pS Kon endogenous buffer 1000 (mm ms)−1 Kon exogenous buffer Dye (OGB-1) 1000 (mm ms)−1 Koff endogenous buffer 1 ms−1 Koff exogenous buffer Dye (OGB-1) 0.2 ms−1 ↵aS, Siemens.


