

Article Figures & Data
Figures
- Figure 1.
Three existing hypotheses about the relation between prestimulus BBA and RT. Black, horizontal line indicates the postural hypothesis of BBA, where there is no relationship between BBA and RT. Red, positively sloped line indicates the maintenance hypothesis of BBA because increased BBA would be associated with longer RTs. Blue, negatively sloped line indicates the attentional hypothesis of BBA because more BBA would signify greater attention on the task and therefore shorter RTs.
- Figure 2.
Recording locations, techniques, task, and discrimination behavior. a, An illustration of the experimental setup for data gathering in the discrimination task. We gently restrained the resting arm with a plastic tube and cloth sling. We tracked a reflective IR bead taped on the middle digit of the unrestrained hand to mimic a touch screen and to provide an estimate of instantaneous arm position. We tracked eye position using an infrared reflective mirror placed in front of the monkey's nose. b, Timeline of the discrimination task, showing the prestimulus period (the 600 ms period before checkerboard onset, depicted as a blue rectangle), poststimulus period (the 300 ms period after checkerboard onset depicted in purple), and postmovement period (the 300 ms period after movement initiation at the RT shown in pink). c, Examples of different stimulus ambiguities used in the experiment parameterized by the color coherence of the checkerboard defined as follows:
 . The corresponding signed color coherence is defined as follows: . Positive values of signed color coherence indicate more red than green squares and vice versa. d–e, Average discrimination performance (d) and RT (e) over sessions of the 2 monkeys as a function of the signed color coherence of the checkerboard. RT plotted here includes both correct and incorrect trials for each session and then averaged across sessions. Gray markers represent measured data points along with 2x (SE) estimated over sessions, although variation is so small that they are difficult to see in d. The black line segments are drawn in between these measured data points to guide the eye. For most data points in d, the error bars lie within the markers. d, e, x axes represent the signed color coherence in %. y axes represent the percentage responded red in d and RT in e. Also shown in d are discrimination thresholds (mean ± SD over sessions) estimated from a Weibull fit to the overall percentage correct as a function of unsigned coherence. The discrimination threshold is the color coherence level at which the monkey made 81.6% correct choices. A total of 24 sessions for Monkey T (47,483 trials) and 44 sessions for Monkey O (70,250 trials) went into these averages. f, Box-and-whisker plot of RT as a function of unsigned checkerboard coherence. For each coherence, the central mark of the box indicates the median, the bottom and top edges of the box reflect the 25th and 75th percentiles, respectively, the maximum whisker length is specified as three times the interquartile range, and outliers are plotted as plus symbols. There is large variation of RTs both across and within coherences. g, Location of PMd along with an example recording from a 16-electrode, 150 μm spacing U probe. The neuronal waveforms are taken from the recordings, and properties of these neuronal responses were reported in a previous study.
 - Figure 3.
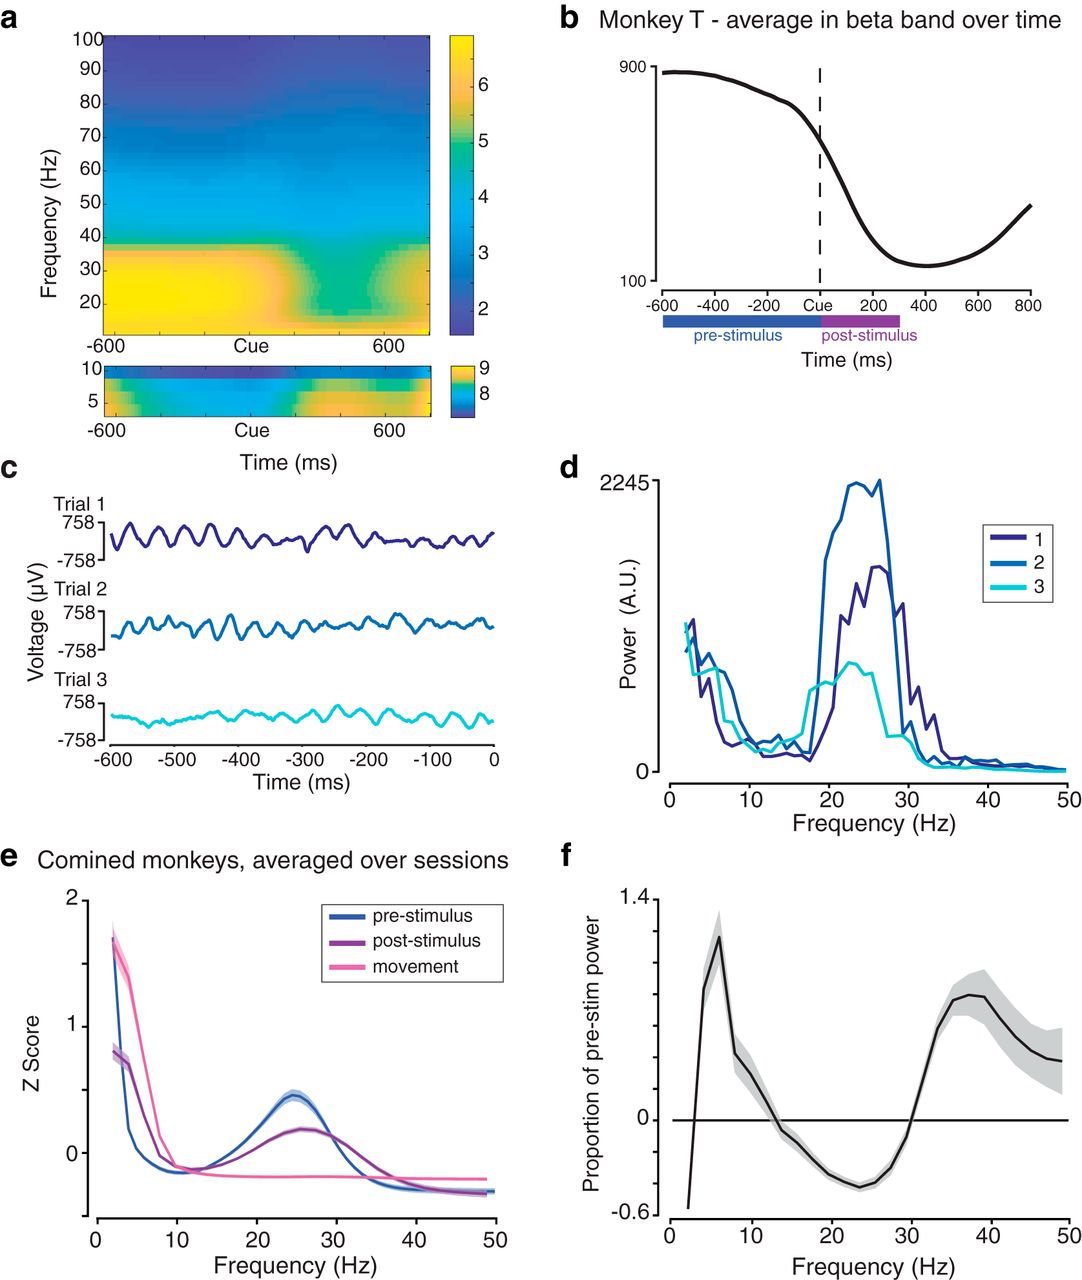
Existence of BBA during hold period before the visual stimulus. a, Multitaper spectrogram aligned to checkerboard onset (indicated with Cue), averaged over all electrodes, trials, and sessions for Monkey T. The y axis represents frequency and is shown in Hertz. The x axis represents time in milliseconds. Color represents natural log power in log of arbitrary units. The spectrogram has been split to show the range of activity for low frequencies <10 Hz and higher frequencies from 10 to 100 Hz. Clear presence of prestimulus BBA is seen, with lower-power poststimulus BBA. b, Activity in the beta band (13–30 Hz) over time, averaged over all electrodes, trials, and sessions for Monkey T. The y axis represents power in (A.U.). The x axis represents time in milliseconds. c, The LFP time series of three trials of Electrode 2 during a single session. The colors are unique to each trial and consistent with subplot (d). The time series are shown as microvolts per millisecond. d, Power spectra of three example trials during the epoch before the checkerboard. Power in (A.U.) is plotted against frequency (Hertz). e, Normalized power spectra of the LFP during the epoch before the checkerboard (blue), after the checkerboard (purple), and after movement (pink). Data were separately averaged for each monkey over trials and then electrodes. Next, data were combined for the 2 monkeys and were averaged over sessions. The power spectra were normalized, and their z scores are plotted against frequency (Hertz). Shaded regions represent SE over sessions. f, A baseline correction of power per frequency for the poststimulus period. The power spectrum proportional change calculated as
. Shading represents SE over sessions. The poststimulus and prestimulus power spectra used have not been normalized and have been averaged over trials, then over electrodes, and last over pooled monkeys' sessions. - Figure 4.
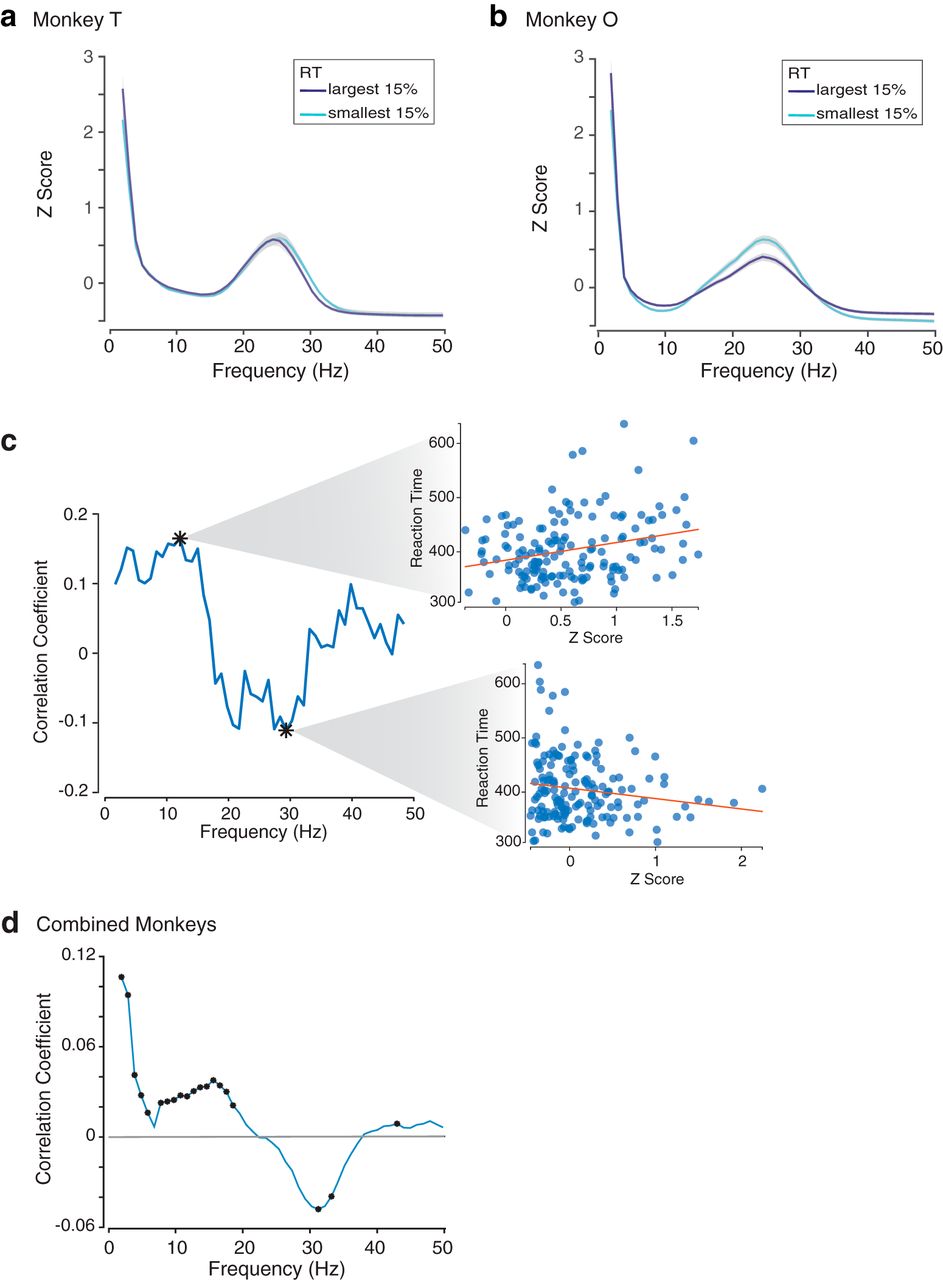
Relation between prestimulus BBA and RT. a, b, Normalized prestimulus power spectra grouped into two RT quantiles and averaged over all trials within that group, all electrodes, and all sessions for Monkey T (a) and Monkey O (b). The two quantiles are the 15% largest (slowest) RTs and the 15% smallest (fastest) RTs. The power spectra have been normalized, and their z scores are plotted against frequency (Hertz). Gray represents SE over sessions. c, The partial correlation between RT and normalized power at each frequency, averaged over electrodes, for all trials with the easiest checkerboard coherence within one session. At the peaks in correlation, a scatter plot of RT versus normalized power (averaged over electrodes) at that frequency is shown. Orange line represents RT regressed as a function of an intercept and normalized power at that frequency. d, Partial correlation between normalized prestimulus power spectra with RT as a function of frequency. Data were separately averaged for each monkey over trials and then electrodes. Next, data were combined for the 2 monkeys and were averaged over sessions. *Points along the curve where the correlation is significant (adjusted p value <0.05).
- Figure 5.
Relation between poststimulus BBA and RT. a, b, Normalized poststimulus power spectra grouped into two RT quantiles and averaged over all trials within that group, all electrodes, and all sessions for Monkey T (a) and Monkey O (b). The two quantiles are the 15% largest (slowest) RTs and the 15% smallest (fastest) RTs. The power spectra have been normalized, and their z scores are plotted against frequency (Hertz). Gray represents SE over sessions. c, Correlation between normalized poststimulus power spectra with RT as a function of frequency. Data were separately averaged for each monkey over electrodes. Next, data were combined for the 2 monkeys and were averaged over sessions. *Points along the curve where the correlation is significant (adjusted p value <0.05, sign test).
- Figure 6.
Simulations of relation between BBA and RT. Process (a) and results (b) of a simulation that generated synthetic LFP signals as Amplitude * sin(2 * π * Frequency * t). The amplitude and frequency of the LFP were defined differently for each case, either as a constant or a function of RT. In all cases, random noise was added to these variables. Power spectra were made from these LFP signals, and they were then correlated with RT to create the shown plots of correlation coefficients as a function of frequency for each of the six cases. The amplitude and frequency relationships with RT for each case are shown with the correlations.
- Figure 7.
Wavelets help resolve the time modulation of BBA. a, Spectrogram computed using Morelet wavelets averaged over trials, electrodes, and sessions. x axis represents time in milliseconds; y axis represents the frequency in Hertz. Warmer (yellower) colors represent higher power. b, Partial correlation between each voxel of the Morelet wavelet spectrogram and RT, controlling for checkerboard coherence. Gray represents nonsignificant correlations (after FDR corrections), which were set to zero. c, Spectrogram difference between the 15% slowest (largest) RTs and 15% fastest (smallest) RTs. The spectrograms were averaged over trials and electrodes before the spectrogram for the fastest RTs was subtracted from that of the slowest RTs, and then the difference spectrogram was averaged over sessions. Gray represents points for which the t test was not significant (after FDR corrections), which were set to zero. d, Power spectra of difference between the 15% slowest (largest) RTs and 15% fastest (smallest) RTs for different 200 ms time periods. Spectrograms were averaged over trials and electrodes before the spectrogram for the fastest RTs was subtracted from that of the slowest RTs; then this was averaged over 200 ms time bins and then averaged over sessions. Shading represents SE over sessions.
- Figure 8.
Prestimulus and poststimulus BBA by depth. a, Normalized prestimulus power spectra grouped into two electrode groupings and averaged over all trials, all electrodes within that group, and all sessions for Monkey T and Monkey O. The power spectra have been normalized, and their z scores are plotted against frequency (Hertz). Red represents the average over the superficial electrodes. Blue represents the average over the deep electrodes. Shading represents SE over sessions. b, Depth-dependent correlation between normalized prestimulus power spectra with RT as a function of frequency. Data were separately averaged for each monkey over trials and then separately for each depth group over electrodes. Next, data for each group were combined for the 2 monkeys and were averaged over sessions. Red represents the correlation over the superficial electrodes. Blue represents the correlation over the deep electrodes. c, Normalized poststimulus power spectra grouped into two electrode groupings and averaged over all trials, all electrodes within that group, and all sessions combined across both monkeys. The power spectra have been normalized, and their z scores are plotted against frequency (Hertz). Red represents the average over the superficial electrodes. Blue represents the average over the deep electrodes. Shading represents SE. d, Depth-dependent correlation between normalized poststimulus power spectra with RT as a function of frequency over both monkeys. Red represents the correlation over the superficial electrodes. Blue represents the correlation over the deep electrodes.


