
Abstract
Rapid and effective neural transmission of information requires correct axonal myelination. Modifications in myelination alter axonal capacity to transmit electric impulses and enable pathological conditions. In the CNS, oligodendrocytes (OLs) myelinate axons, a complex process involving various cellular interactions. However, we know little about the mechanisms that orchestrate correct myelination. Here, we demonstrate that OLs express R-Ras1 and R-Ras2. Using female and male mutant mice to delete these proteins, we found that activation of the PI3K/Akt and Erk1/2-MAPK pathways was weaker in mice lacking one or both of these GTPases, suggesting that both proteins coordinate the activity of these two pathways. Loss of R-Ras1 and/or R-Ras2 diminishes the number of OLs in major myelinated CNS tracts and increases the proportion of immature OLs. In R-Ras1−/− and R-Ras2−/−-null mice, OLs show aberrant morphologies and fail to differentiate correctly into myelin-forming phenotypes. The smaller OL population and abnormal OL maturation induce severe hypomyelination, with shorter nodes of Ranvier in R-Ras1−/− and/or R-Ras2−/− mice. These defects explain the slower conduction velocity of myelinated axons that we observed in the absence of R-Ras1 and R-Ras2. Together, these results suggest that R-Ras1 and R-Ras2 are upstream elements that regulate the survival and differentiation of progenitors into OLs through the PI3K/Akt and Erk1/2-MAPK pathways for proper myelination.
SIGNIFICANCE STATEMENT In this study, we show that R-Ras1 and R-Ras2 play essential roles in regulating myelination in vivo and control fundamental aspects of oligodendrocyte (OL) survival and differentiation through synergistic activation of PI3K/Akt and Erk1/2-MAPK signaling. Mice lacking R-Ras1 and/or R-Ras2 show a diminished OL population with a higher proportion of immature OLs, explaining the observed hypomyelination in main CNS tracts. In vivo electrophysiology recordings demonstrate a slower conduction velocity of nerve impulses in the absence of R-Ras1 and R-Ras2. Therefore, R-Ras1 and R-Ras2 are essential for proper axonal myelination and accurate neural transmission.
- differentiation
- myelin
- oligodendrocyte
- oligodendrocyte progenitor cell
- RRas
Introduction
Mammalian plasma membranes from specialized glial cells generate myelin as oligodendrocytes in the CNS and Schwann cells in the peripheral nervous system. Axonal myelination is essential to facilitate fast, saltatory conduction of action potentials. Changes in myelin structure such as sheath thickness and internode length can alter axonal conduction velocities, which may induce pathologies such as leukodystrophies and peripheral neuropathies (Suter and Scherer, 2003; Boespflug-Tanguy et al., 2008).
During development, oligodendrocyte progenitor cells (OPCs), which differentiate into oligodendrocytes (OLs), arise along the caudorostral axis of the ventricular neuroepithelium of the neural tube at multiple restricted foci distributed along the dorsoventral axis to colonize the entire CNS (de Castro and Zalc, 2013; Ono et al., 2018). OPCs then differentiate into mature OLs, forming myelin (Nave and Werner, 2014). Various intrinsic and extrinsic cues such as specific growth factors, protein kinases, and extracellular matrix proteins regulate the spatial and temporal patterns of OL differentiation by modifying gene expression and cell morphology (Bauer et al., 2009; Emery, 2010).
Among these factors, the PI3K/Akt and Erk1/2-MAPK signaling pathways may control OL survival, migration, differentiation, and myelination (Ness et al., 2002; Romanelli et al., 2009; Ishii et al., 2014; Murcia-Belmonte et al., 2014; Gaesser and Fyffe-Maricich, 2016; Murcia-Belmonte et al., 2016). Indeed, mutant animals that have constitutively active PI3K-Akt-mTOR pathways in their OPCs and OLs show dramatically enhanced myelin formation, but not changes in OL generation (Flores et al., 2008; Goebbels et al., 2010; Harrington et al., 2010). In contrast, inhibition of effectors of the PI3K/Akt pathway such as mTOR causes defective OL differentiation both in vitro and in vivo (Tyler et al., 2009; Wahl et al., 2014). Erk1/2 signaling controls the thickness and maintenance of CNS myelin (Wahl et al., 2014 Ishii et al., 2014) and its inactivation produces a delay in the differentiation and maturation of OLs (Fyffe-Maricich et al., 2011). Hyperactivation of the Erk1/2–MAPK pathway during development drives a transient OPC hyperproliferation without affecting their differentiation or the final number of mature OLs (Ishii et al., 2013). In addition, Erk1/2 activation in OLs drives sheath expansion (Jeffries et al., 2016) (Jeffries et al., 2016). It is known that there is cross talk between PI3K/Akt and Erk1/2-MAPK (Gaesser and Fyffe-Maricich, 2016; Furusho et al., 2017), though little is known about the mechanisms that mediate the coordinated activity of signaling in these two molecular pathways.
One candidate is the Ras superfamily of GTP-binding proteins. These membrane-anchored intracellular signal transducers that act through both PI3K/Akt and Erk1/2-MAPK pathways (Arimura and Kaibuchi, 2007) to influence various cell functions, including proliferation, differentiation, and cell survival (Karnoub and Weinberg, 2008; Pylayeva-Gupta et al., 2011). Members of the classic Ras subfamily (Hras, Kras and Nras) are frequently mutated and constitutively active in human cancers (Chan et al., 1994). GTPases of the Ras-related (R-Ras) subfamily, composed of R-RAS1 (RRas), R-RAS2 (TC21), and R-RAS3 (also called MRas), are less well understood (Ohba et al., 2000; Colicelli, 2004; Gutierrez-Erlandsson et al., 2013). R-Ras proteins share strong homology (55–60% amino acid identity) with classic Ras proteins (Drivas et al., 1990; Colicelli, 2004) and with many effector proteins, including components in the PI3K/Akt and Erk1/2-MAPK pathways (Chan et al., 1994; Graham et al., 1994, 1999; Movilla et al., 1999; Rosário et al., 1999, 2001; Delgado et al., 2009). R-Ras1 and R-Ras2 are ubiquitously expressed (Komatsu and Ruoslahti, 2005; Larive et al., 2012), whereas R-Ras3 expression is more restricted (Kimmelman et al., 2002; Sun et al., 2006). In the CNS, OLs can express R-Ras1 (Olsen and ffrench-Constant, 2005); however, its specific function and putative role with R-Ras2 in myelination remains unknown.
Here, we investigated the role of R-Ras1 and R-Ras2 in OL differentiation for myelin formation using three knock-out mice: single R-Ras1 or R-Ras2-null mutants and a double-null mutant. Different levels of hypomyelination in R-Ras1−/− and R-Ras2−/− mice indicate that both GTPases are essential for proper myelination. Single- and double-null mutant mice showed diminished OL viability from weaker activation of PI3K/Akt and Erk1/2-MAPK signaling. OL maturation was altered, changing the internode length (myelin segments between nodes of Ranvier), which strongly decreased axonal conduction velocity. Overall, our data strongly suggest that R-Ras1 and R-Ras2 are critical for OL differentiation and CNS myelination through mechanisms using Akt and Erk pathways.
Materials and Methods
Animals.
Mice were housed in specific-pathogen-free conditions in a humidity- and temperature-controlled room on a 12 h light/dark cycle, receiving water and food ad libitum. All animal procedures were approved by the corresponding institutional ethical committee (Centro Biología Molecular Severo Ochoa, CBMSO) and were performed in accordance with Spanish and European directives. All efforts were made to minimize animal suffering.
R-Ras1−/− mice were generated at GenoWay using the targeting construction BAL1-HR with a neomycin resistance cassette flanked by FRT sequences inserted in intron 1 and LoxP sites flanking exons 2 and 6. The construction was electroporated into embryonic stem cells derived from mouse 129Sv/Pas and selected by the antibiotic G418. Southern blot was used to verify the correct homologous recombination.
Heterozygous mice were crossed and offspring littermates were genotyped by PCR (R-Ras1−/− FW: 5′-GGAGCAAGAGGAGGGAAGGAATGGG-3′, R-Ras1−/− RV: 5′-CCTTCCAGAGGACTCAGTTCAATCC-3′, R-Ras1+/+ FW: 5′-CGCTCTAGCTGAGCCTCTGT-3′, R-Ras1+/+ RV: 5′-TACAGGGTCTTGTGGGGAAA-3′).
R-Ras2−/− mice were generated at Lexicon Pharmaceuticals and were derived from embryonic stem cell clone OST361011 with insertion of retroviral VICTR37 in the middle of intron 1 of R-Ras2. Heterozygous mice were crossed and offspring littermates were genotyped by PCR (primer 1, 5′-TGAAACAGGATCATGTTGTGGAG-3′; primer 2, 5′-CAGGAGGAGTCCAAGAAGAC-3′; primer 3, 5′-ATAAACCCTCTTGCAGTTGCATC-3′) (Delgado et al., 2009). R-Ras2+/+ and R-Ras2−/− transgenic mice were obtained by crossing of heterozygous mice.
R-Ras1−/− and R-Ras2−/− mice were kindly provided by Prof. B. Alarcón (CBMSO). Double-knock-out R-Ras1−/−;R-Ras2−/− mice were generated by backcrossing individual lines of R-Ras1−/− and R-Ras2−/−. Animals were maintained in a C57BL6J background. We used either male or female mice to perform the experiments. The morning the vaginal plug appeared was defined as embryonic day 0.5 (E0.5) and the day of birth was defined as postnatal day 0 (P0).
Western blotting.
Tissue samples (optic nerve, spinal cord, and corpus callosum of animals from P30 to P90) were dissected, sonicated in lysis buffer (50 mm Tris pH 8.0, 150 mm NaCl, 1% NP40, 2 mm EDTA, 0.1% SDS, 0.5% desoxycholate, and protease inhibition mixture; Roche 11697498001) and phenylmethane sulfonyl fluoride (PMSF). For detection of phosphorylated proteins, a different buffer was used (40 mm Tris pH 8.0, 300 mm NaCl, 20% glycerol, 4 mm EDTA, 0.3% Brij 96, 1 mm PMSF, 2 mm Na3VO4, 10 mm NaF, 1 mm apoprotein, 1 mm benzamidine, 1 mm iodoacetamide, and protease inhibitor mixture). Lysates were denatured by boiling for 5 min in protein loading buffer [50 mm Tris-HCl pH 6.8, 2% SDS, 10% glycerol, 1% β-mercaptoethanol (BME), 12.5 mm EDTA and 0.02% bromophenol blue] and resolved in 10–12% SDSP-gels in the presence of BME. Gels were run at constant current starting at 90–100 V. After electrophoresis, samples were transferred onto PVDF membranes using a semidry electroblotting system (Transblot-turbo; Bio-Rad) at 1.2 mA/cm2 for 35–40 min. Nonspecific protein binding was blocked by incubating the membrane with 5% nonfat milk or 5% BSA (for detection of phosphorylated proteins) in TBS-Tween 20 for 2 h at room temperature. Membranes were then incubated overnight at 4°C with the pertinent primary antibodies diluted in blocking buffer: rabbit anti-R-Ras 1:200 (ab154962), rabbit anti-Caspr 1:250 (Abcam catalog #ab34151, RRID:AB_869934), mouse anti-GAPDH (G9) 1:1000 (Santa Cruz Biotechnology catalog #sc-365062, RRID:AB_10847862), goat anti-MAG (C-19) 1:200 (Santa Cruz Biotechnology catalog #sc-9544, RRID:AB_670102), rabbit anti-Akt 1:1000 (Cell Signaling Technology catalog #9272, RRID:AB_329827), rabbit anti-P-Akt (S473) 1:1000 (Cell Signaling Technology catalog #4060, RRID:AB_2315049), rabbit anti-P-Akt (T308) 1:1000 (Cell Signaling Technology catalog #9275), rabbit anti-phospho S6 (S240/244) 1:1000 (Cell Signaling Technology catalog #5364, RRID:AB_10694233), rabbit anti-p44/42 MAPK (Erk1/2) 1:1000 (Cell Signaling Technology catalog #9102, RRID:AB_330744), rabbit anti-P-p44/42 MAPK (P-Erk1/2) (T202/T204) 1:1000 (Cell Signaling Technology catalog #9101, RRID:AB_331646), mouse anti-MBP (aa67-74) 1:200 (Bio-Rad/AbD Serotec catalog #MCA685S, RRID:AB_325009), mouse anti-TCF-4 clone 6H5–3 1:1000 (Millipore catalog #05-511, RRID:AB_309772), or rabbit anti-Olig2 1:2000 (Millipore catalog #AB9610, RRID:AB_570666). Specific rabbit antiserum to R-Ras2 (kindly provided by Prof. B. Alarcón) was generated by immunization of New Zealand rabbits with a purified GST-TC21 fusion protein (Delgado et al., 2009) and used at a 1:200 dilution.
After washing, blots were incubated for 1 h with the appropriate peroxidase-conjugated secondary antibodies (Thermo Fisher Scientific). Labeled proteins were detected with the chemiluminescence reagent ECL (GE Healthcare).
Immunohistochemistry.
Animals were anesthetized (ketamine/xylazine) and perfused transcardially with 0.1 m PBS, pH 7.4, followed by 4% paraformaldehyde in PBS. Perfused tissues were removed and postfixed in 4% paraformaldehyde at 4°C overnight, then cryoprotected in 30% sucrose in PBS and embedded and frozen in a 7.5% gelatin in 15% sucrose solution. Then they were sectioned on a cryostat to produce 15 μm-thick cryosections on Superfrost Plus microscope slides (Fisher Scientific). Sections were blocked for 1 h at room temperature with 10% fetal bovine serum in PBS containing 0.5% Triton X-100 (blocking solution) and then incubated overnight at 4°C with the primary antibodies (rabbit anti-R-Ras 1:200, rabbit anti-R-Ras2 1:500, mouse anti-Nkx2.2 1:250 (DSHB catalog #74.5A5, RRID:AB_531794), kindly provided by Aixa Morales (Cajal Institute, Consejo Superior de Investigaciones Científicas), rabbit anti-olig2 1:500, rabbit anti-cleaved caspase-3 (Asp175) 1:500 (Cell Signaling Technology catalog #9661, RRID:AB_2341188), rabbit anti-MBP 1:300 (Abcam catalog #ab40390, RRID:AB_1141521), mouse anti-NF200 clone NE14 1:300 (Sigma-Aldrich catalog #N5389, RRID:AB_260781), rabbit anti-Caspr 1:250, mouse anti-TCF-4 clone 6H5-3 1:200 and mouse anti-O4 1:200 (Millipore catalog #MAB345, RRID:AB_94872) diluted in blocking solution. After 3 washes, fluorescent-tagged secondary antibodies were applied for 1 h at room temperature and sections were counterstained with DAPI (catalog #32670; Sigma-Aldrich) and mounted in Aqua-polymount mounting medium (catalog #18606; Polyscience).
BrdU injections were administered intraperitoneally to pregnant mice (100 μg/g) at different stages of embryo development. One hour after BrdU administration, the mother was killed and the brains of embryos were fixed overnight in 4% PFA. Staining for BrdU was performed as described previously (Cubelos et al., 2008). Briefly, slides were incubated overnight at 4°C with a mouse monoclonal anti-BrdU antibody 1:200 (Becton Dickinson catalog #347580, RRID:AB_609568). Secondary Alexa Fluor 598-conjugated anti-rat antibodies 1:500 (Invitrogen) were applied for 2 h at room temperature. Anatomically matched sections were selected from each mouse at each stage after BrdU injection (n = 3 control mice and n = 3 R-Ras1−/−;R-Ras2−/− mice). Identical results were obtained from independent analysis by two investigators. Quantification of positive cells was performed always in the same part of the tissues with ImageJ software (RRID:SCR_003070).
Toluidine blue staining.
Mice were anesthetized as indicated above, intracardially perfused with 4% PFA and 2.5% glutaraldehyde in 0.1 m PBS, and brains were dissected and treated in the same fixative overnight. Sections were made with a Leica VT1200 S vibrating blade microtome (100 μm), washed for 10 min in PBS, stained for 1 min with 200 μl of 0.1% toluidine blue, and finally washed with distilled water and ethanol for 30 s. Photographs were taken with a Leica MZ6 magnifying glass for the proper location of implanted recording electrodes.
Electron microscopy.
Mutant and littermate control mice were anesthetized as indicated above, intracardially perfused with 4% PFA and 2.5% glutaraldehyde in 0.1 m PBS, and treated in the same fixative overnight. Optic nerves were then removed after several washes in PBS and the sections were postfixed with 1% osmium tetroxide in double-distilled water and 1% potassium ferrocyanide 1 h at 4°C. After 3 washes with double-distilled water, sections were treated with 0.15% tannic acid in 0.1 m PBS, pH 7.4, and block-stained with 2% uranyl acetate in distilled water for 1 h at room temperature in darkness. Sections were then washed 3 times with double-distilled water and dehydrated in an ascending series of ethanol dilutions up to 100% at 4°C. The following infiltration was made with propylene oxide: EtOH (1:1; v:v) for 5 min, propylene oxide 3 times for 15 min each, propylene oxide:Epon (1:1) (epoxy resin TAAB 812; TAAB Laboratories) for 45 min, 100% Epon 1 h, and 100% Epon overnight. Encapsulation was made in flat molds where optic nerves were correctly oriented and then polymerized 48 h at 60°C. Semithin (1 μm) sections were stained with toluidine blue. The optic nerve was cut in 70–80 nm sections on an ultramicrotome (Leica Ultracut UCT) with a diamond blade (Diatome) and collected on Cu-Pd boutonniere grids covered by Formvar. Staining of ultrathin sections was performed by drops of 2% aqueous uranyl acetate for 7 min, followed by Reynolds's lead citrate for 2 min. Ultrastructural analyses were performed with a JEM-1010 electron microscope (Jeol). For g-ratio analysis, 12 photographs were taken along the section covering the whole diameter of the optic nerve using a CMOS 4K × 4K, F416 of TVIPS camera. From these photographs, six in perfect condition that matched the mutant and control were used to measure the thickness of the myelin sheath of optic nerve axons by g-ratio analysis (the diameter of axon/the diameter of axon plus myelin sheath). All axons present in the entire image were analyzed (∼800–1000 axons per genotype). To quantify the number of fibers crossing the corpus callosum, photographs were taken in the medial corpus callosum covering its whole width and the total number of axons was quantified. Three animals per genotype were analyzed and identical results were obtained from independent analysis by three investigators.
Confocal microscopy and imaging.
Fluorescence images were obtained using a confocal multispectral Leica TCS SP8 system equipped with a white-light laser for selection of appropriate fluorochrome excitation lines (488 and 550 nm), a 405 nm diode for DAPI excitation, and HyD detectors for signal emission capture. Image acquisition was performed sequentially using 20×/0.75 numerical aperture (NA) dry and 63×/1.4 NA oil-immersion objectives with LAS X version 2.0.1 software (Leica). All images were processed and quantified using PhotoShop (Adobe Systems, RRID:SCR_014199) and ImageJ software.
Primary cell cultures and staining.
OPCs were obtained from cortex and optic nerve of P1 control and R-Ras1−/−;R-Ras2−/− littermate mice following an adapted protocol for OPC isolation by shaking (McCarthy and de Vellis, 1980; Molina-Holgado et al., 2002; Medina-Rodríguez et al., 2013; Murcia-Belmonte et al., 2014).
Purified OPCs were placed on 12 mm cover glass pretreated with 10 μg/ml poly-lysine (#P2636; Sigma-Aldrich) in 0.1 m borate buffer, pH 8.5, and laminin (L2020; Sigma-Aldrich) the same day of the culture. A total of 20,000 cells per well were cultured in differentiation buffer containing BME (41010; Invitrogen), F12 (21765; Invitrogen), transferrin (T0665; Sigma-Aldrich), putrescin (P5780; Sigma-Aldrich), progesterone (P6149; Sigma-Aldrich), sodium selenite (Sigma-Aldrich), insulin (I1882; Sigma-Aldrich), T4 (T1775; Sigma-Aldrich), glutamine (25030; Invitrogen), anti-mycotic solution, and 0.6% glucose. After 14 d in vitro (DIV) of differentiation, OLs were fixed with 4% PFA for 20 min and washed. OLs were placed in PBS containing 0.5% Triton X-100 for 20 min and then blocking solution (10% FBS in PBS containing 0.5% Triton X-100) for 30 min. After that, they were incubated for 2 h at room temperature with primary antibodies (1:500 dilution of mouse anti-CNPase, BioLegend, catalog #SMI-91R, RRID:AB_510037 or a 1:250 dilution of rabbit anti-Olig2). After washing, cells were incubated for 35 min with fluorescent-tagged secondary antibodies and DAPI (catalog #32670; Sigma-Aldrich). OLs from three different experiments were classified according to their morphologies into two different groups (Kremer et al., 2009), one in which the number and complexity of processes was very low (simple processes) and another in which the processes had a high degree of arborization (complex processes).
qRT-PCR.
RNA was extracted from optic nerves from control, R-Ras1−/−, R-Ras2−/− and R-Ras1−/−;R-Ras2−/− mice using an RNeasy kit according to the manufacturer's instructions (Qiagen catalog #74134). RNA was reverse-transcribed using random hexamers and SuperscriptIII reverse transcriptase (Superscript III First Strand Synthesis Supermix for qRT-PCR, no amperase UNG, catalog #11752–250, Thermo Fisher Scientific) according to the manufacturer's instructions. cDNA was amplified using the Bio-RadC FX 384 thermocycler and Eva Green Sso Fast (Bio-Rad), Power Sybr Green, or Taqman Master Mix. The following primers were used: For R-Ras1 (R-Ras-FW sense 5′-AAGGCAGATCTGGAGAACCA-3′, R-Ras-RV antisense 5′-TGCCTCATCGACATTCAGAC-3′), for R-Ras2 (R-Ras2-FW sense 5′-CGTGATGAGTTTCCCATGATT-3′, R-Ras2-RV antisense 5′-TAACTGCTGCCCTTCTTCCT-3′). All primers were designed to span at least one intron. Expression levels were normalized to GAPDH, ActB, HPRT1, 18S, TBP, ARBP, and GUSB expression and the fold changes were calculated by dividing normalized expression in control (value 1) by that of R-Ras1−/− or R-Ras2−/−. qRT-PCR data were analyzed with GenEx Professional version 5.3.7 software (MultiD).
Electrophysiology.
Control (n = 9), R-Ras1−/−(n = 13), R-Ras2−/− (n = 13), and R-Ras1−/−;R-Ras2−/− (n = 14) mice were prepared for chronic recording of field potentials evoked at the lateral geniculate nucleus by stimulus (flashes of light). For this, animals were anesthetized with 4% chloral hydrate and stereotaxically implanted with two recording electrodes in the dorsal part of the lateral geniculate nucleus (2.2–2.5 mm posterior to the bregma, 2.0 mm lateral to the midline and –2.5 mm depth from the brain surface; Paxinos and Franklin, 2013). Electrodes were made from 50 μm Teflon-coated tungsten wire (Advent Research Materials). Two bare silver wires were affixed to the skull as ground. Electrodes were connected to a 4-pin socket (RS-Amidata) that was latterly fixed with dental cement to the cranial bone. After surgery, animals were kept for 5 d in independent cages with ad libitum access to food and water for a proper recovery. Light stimulation was provided by a xenon arc lamp located 30 cm in front of the animals' eyes and lasted ∼1 ms (photic stimulator; Cibertec). For recordings, each alert behaving mouse was placed in a transparent box (5 × 5 × 5 cm), dark-adapted for >30 min, and presented with a total of 20 stimuli at a rate of 3/min. This box was in the center of a larger (30 × 30 × 30 cm) covered by polished aluminum walls. Photic stimulations were triggered from a programmable CS-20 stimulator (Cibertec). Each animal received two stimulation sessions.
Statistical analysis.
Quantitative data are presented as the mean ± SD. The experimental groups were compared using a two-tailed Student's t test. Statistical numeric data are provided in the figure legends (*p < 0.05; **p < 0.01; ***p < 0.001).
Results
R-Ras1 and R-Ras2 are expressed by OLs in myelinated CNS tracts
While OLs may express R-Ras1 (Olsen and ffrench-Constant, 2005), the distribution of R-Ras2 remains undetermined. Therefore, we defined the expression of R-Ras1 and R-Ras2 precisely in different myelinated areas of the CNS in adult mice (P90). Using immunoblotting, we probed samples from the main myelinated tracts of the CNS for R-Ras1 and R-Ras2, including the following: the optic nerve, which consists almost entirely of myelinated axons (Fig. 1A), the corpus callosum (Fig. 1B), and the spinal cord (Fig. 1C). Given the strong homology between R-Ras1 and R-Ras2, antibodies against these GTPases recognize both proteins. We were able to easily detect two bands of different molecular weights in Western blots: a 25 kDa band corresponding to R-Ras1 (Iwasawa et al., 2012) and a 21 kDa band corresponding to R-Ras2 (Delgado et al., 2009). In double-null mutant mice lacking both R-Ras1 and R-Ras2, no immunoreactivity was observed, confirming that the antibodies used are specific for R-Ras1 and R-Ras2 (Fig. 1A–C). We could unequivocally confirm the absence of the appropriate proteins in the single-null mutants (Fig. 1A). R-Ras3 expression was not modified in R-Ras1−/− and/or R-Ras2−/− mice, showing a band of 24 kDa (Fig. 1A–C).

OLs express R-Ras1 and R-Ras2 in the main myelinated tracts of the CNS. A, Immunoblot of adult optic nerve lysates showing R-Ras1, R-Ras2, and R-Ras3 expression. Two different antibodies against R-Ras1 or R-Ras2 recognized both proteins, a band of 25 kDa corresponding to R-Ras1 and another of 21 kDa corresponding to R-Ras2. No bands were observed in optic nerve lysates from R-Ras1−/−;R-Ras2−/− mice. R-Ras3 expression was not modified in R-Ras1−/− and/or R-Ras2−/− showing a band of 24 kDa (n = 3). B, C, Western blot of corpus callosum (B) and spinal cord (C) extracts from control mice confirmed expression of R-Ras1, R-Ras2, and R-Ras3 in primary CNS myelinated tracts (n = 3). D, Schematic representation of the targeting strategy to generate the R-Ras1-null mutant. A Neo cassette flanked by FRT sites was inserted into intron 1 together with two loxP sites flanking exons 2 and 6. The positions of the primers designed for genotyping are shown by the arrows. E, PCR genotyping. A mixture of primer 1 and primer 2 detected the R-Ras1+/+ (∼100 bp) allele by PCR and a mixture of primer 3 and primer 4 detected the R-Ras1−/− target allele (∼1000 bp). F, Generation of R-Ras2−/− mice. Shown is an illustration of the retroviral insertion site of the R-Ras2 gene in intron 1 and the positions of the three primers used for genotyping. G, Analysis of the relative expression of R-Ras1 and R-Ras2 by qRT-PCR in control, R-Ras1−/−, R-Ras2−/−, and R-Ras1−/−;R-Ras2−/− adult mice normalizing all data to control mice. Values are expressed as the mean fold change of 3 different animals, p < 0.0001. H, Longitudinal optic nerve sections from control, R-Ras1−/−, R-Ras2−/−, and R-Ras1−/−;R-Ras2−/− adult mice showing colocalization between R-Ras1 (top) and R-Ras2 (bottom, green) with Nkx2.2, an oligodendroglial cell marker (red). No staining for R-Ras1 or R-Ras2 was observed in the double-mutant mice (n = 3). All samples were obtained from adult mice (P90). Scale bar, 25 μm.
To generate R-Ras1 deletion mutants, we used a germline knock-out mouse with exons 2–6 deleted, the region that encodes most of the protein (Fig. 1D). We genotyped mice by PCR using primers 1 and 2 to detect the alleles corresponding to R-Ras1+/+ mice and a mixture of primers 3 and 4 to identify the R-Ras1−/− mutants (Fig. 1E). We also used a R-Ras2 knock-out mouse line produced from an embryonic stem cell clone with a retroviral insert in the first intron of R-Ras2 (Delgado et al., 2009) (Fig. 1F). Finally, we generated R-Ras1/R-Ras2 double-null mutant mice by backcrossing the individual R-Ras1−/− and R-Ras2−/− lines. These mice were backcrossed for 10 generations onto the C57BL/6J strain to exclude any distortions induced by background variations. qRT-PCR and immunoblot analysis of the CNS confirmed the absence of expression of these genes in R-Ras1−/−, R-Ras2−/−, and double-mutant mice (Fig. 1A–C,G).
We then determined whether OLs express R-Ras1 and R-Ras2 using double immunohistochemical staining with antibodies against R-Ras1/R-Ras2 and Nkx2.2, a homeobox transcription factor expressed by oligodendroglial cells (Qi et al., 2001). In longitudinal sections of the optic nerve from adult mice (P90), both R-Ras1 and R-Ras2 colocalized with Nkx2.2 (Fig. 1H), which was also observed in the corpus callosum and spinal cord (data not shown). Therefore, we conclude that R-Ras1 and R-Ras2 are expressed in OLs of the main myelinated CNS tracts.
OL population is diminished in R-Ras1−/−, R-Ras2−/−, and R-Ras1−/−;R-Ras2−/− mice
To determine whether the absence of R-Ras1 and/or R-Ras2 altered oligodendroglial cells, we used immunohistochemical staining of optic nerves with the oligodendroglial-specific Olig2 antibody in longitudinal sections from R-Ras1−/−, R-Ras2−/−, and double-mutant adult (P90) mice (Fig. 2A,B). Histological examination revealed a decrease in oligodendroglial cell density in R-Ras1−/− (19.1 ± 7.5% reduction; p = 0.02), R-Ras2−/− (33.5 ± 2.1% reduction; p < 0.0001), and R-Ras1−/−;R-Ras2−/− (42.8 ± 11.8% reduction; p = 0.003) mice compared with controls (Fig. 2A,C). The reduction in oligodendroglial cells was more pronounced in double mutants (p = 0.02), followed by R-Ras2−/− (p = 0.003) compared with R-Ras1−/− (Fig. 2C). We investigated whether R-Ras1 and R-Ras2 were essential to maintaining the OL population in other myelinated CNS tracts and confirmed the reduction in oligodendroglial population in the double-mutant mice compared with controls (38 ± 15.6% reduction in the corpus callosum, p < 0.0001; and 27 ± 6.1% reduction in the spinal cord, p = 0.007; data not shown). These observations demonstrate that R-Ras1 and R-Ras2 jointly maintain the OL populations in the main myelinated CNS tracts.

The OL population is significantly diminished in R-Ras1−/−, R-Ras2−/−, and R-Ras1−/−;R-Ras2−/− mice. A, Immunolabeling with anti-Olig2 (green) of longitudinal optic nerve sections from control, R-Ras1−/−, R-Ras2−/−, and R-Ras1−/−;R-Ras2−/− adult mice (P90) showing a reduction in the OL population in the mutant mice compared with the controls. B, Simplified scheme of the visual tract showing the region of analysis. C, Quantification of the density of Olig2-positive cells per square millimeter showing a 19.1 ± 7.5% decrease in R-Ras1−/− (*p = 0.02), a 33.5 ± 2.1% reduction in R-Ras2−/− (***p < 0.0001), and a 42.8 ± 11.8% reduction (**p = 0.003) in R-Ras1−/−;R-Ras2−/− mice relative to controls. Reduction of OLs in the R-Ras1−/− mutant mice was significantly less than that observed in the R-Ras2−/− (p = 0.003) and R-Ras1−/−;R-Ras2−/− (p = 0.02) mutant mice. The bar graph represents the mean and SD for the number of Olig2-positive cells per square millimeter from six different experiments (n = 6). Scale bars, 75 μm.
Absence of R-Ras1 and R-Ras2 reduces activation of PI3K/Akt and Erk1/2-MAPK signaling pathways
Given that R-Ras1 and R-Ras2 can activate PI3K/Akt signaling (McFall et al., 2001; Rosário et al., 2001; Murphy et al., 2002; Rong et al., 2002; Delgado et al., 2009) and Erk1/2-MAPK (Graham et al., 1994; Movilla et al., 1999; Rosário et al., 1999), we examined these pathways in the optic nerve of P90 mice by Western blot using antibodies against phosphorylated Akt and Erk (active versions; Fig. 3A). We found a reduction of both Akt phosphoepitopes T308 and S473 in single and double mutants (Fig. 3A), indicating a decrease in PI3K/Akt activity in R-Ras1- and R-Ras2-deficient adult (P90) mice. We then analyzed S6K activity, a kinase that regulates mTOR, by measuring S6 phosphorylation levels. We confirmed a significant decrease in the activity of the PI3K/Akt pathway in the absence of R-Ras1 and/or R-Ras2, with no change in the total levels of these proteins (Fig. 3A). We also examined the activity of the Erk1/2-MAPK pathway in our mutant mice, observing a reduction in Erk1/2 phosphorylation in the single- and double-mutant mice relative to the controls. We found that activation of the PI3K/Akt and Erk1/2-MAPK pathways was weaker in mice lacking one or both of these GTPases, which suggests that both proteins coordinate the activity of these two pathways (Fig. 3B).

R-Ras1 and R-Ras2 are necessary for OL survival driven by PI3K/Akt and Erk1/2-MAPK signaling. A, Western blot analysis of phospho-Akt (T308), phospho-Akt (S473), and phospho-S6 in optic nerve lysates of adult mice (P90) showing that the PI3K/Akt pathway was altered in the absence of R-Ras1 and/or R-Ras2. Phosphorylated proteins were significantly reduced in mutant mice compared with controls. Bottom, Western blot analysis showing decreased phosphorylated Erk1/2 (T202/Y204) in adult optic nerve lysates from R-Ras1−/−, R-Ras2−/−, and R-Ras1−/−;R-Ras2−/− mice compared with controls. Graphs show densitometric analysis of phosphorylated Akt, S6 and Erk1/2 normalized to total protein levels compared with controls (100%, n = 4): P-Akt (T308) R-Ras1−/− 78.5 ± 6.51% reduction (***p < 0.0001), R-Ras2−/− 35.3 ± 12.80% reduction (**p = 0.0035), R-Ras1−/−;R-Ras2−/− 34.5 ± 15.23% reduction (**p = 0.007); P-Akt (S473) R-Ras1−/− 49.2 ± 1.20% reduction (***p < 0.0001), R-Ras2−/− 53.2 ± 15.92% reduction (**p = 0.0044), R-Ras1−/−;R-Ras2−/− 62.9 ± 4.92% reduction (***p = 0.0001); p-S6 R-Ras1−/− 62.6 ± 6.8% reduction (***p < 0.0001), R-Ras2−/− 50.9 ± 15.2% reduction (***p = 0.0002), R-Ras1−/−;R-Ras2−/− 65.2 ± 23.5% reduction (***p = 0.0005); p-Erk1/2 R-Ras1−/− 45.4 ± 25.8% reduction (**p = 0.004), R-Ras2−/− 55.6 ± 15.3% reduction (***p < 0.0001), R-Ras1−/−;R-Ras2−/− 68.5 ± 20.3% reduction (***p < 0.0001). B, Schematic representation of the pathways downstream of R-Ras1 and R-Ras2. Discontinuous lines imply indirect activation or inhibition. C, Bar graph showing the mean number of caspase-3-positive cells per square millimeter observed in P30 optic nerves from R-Ras1−/−;R-Ras2−/− (45.28 ± 17.39) compared with controls (11.14 ± 8.01, *p = 0.0124; n = 3). D, Immunostaining of longitudinal sections of optic nerves at P30 with anti-cleaved-caspase-3 reveals increased cell apoptosis in the R-Ras1−/−;R-Ras2−/− mice compared with controls (n = 3). Scale bar, 25 μm.
Using immunohistochemical staining for Olig2 at different stages of OPC differentiation (E12.5, E14.5, P0, and P15), we did not detect differences in oligodendrogenesis between double-mutant and control mice. The Olig2 immunostaining suggested that normal OL migration occurs in double-mutant mice because OPCs born at E12.5 and E15.5 normally colonized the optic nerve and corpus callosum tracts (data not shown), as described previously (Spassky et al., 2002; de Castro and Zalc, 2013). We also evaluated OL proliferation using BrdU labeling at different developmental stages (E14.5, E18.5, P0, and P15), finding no differences between double-mutant and control mice (data not shown). These experiments show that the absence of R-Ras1 and/or R-Ras2 does not affect OPC genesis, migration, or proliferation, and that R-Ras1 and R-Ras2 contribute to postmitotic oligodendroglia differentiation to form mature OLs.
Next, we analyzed whether decreased activation of the PI3K/Akt and Erk1/2-MAPK pathways affected OL survival. We assessed the number of apoptotic cells in the optic nerve and corpus callosum with an antibody against active/cleaved caspase-3 in double-mutant and control mice. Quantification of caspase-3-positive cells in the optic nerve at P30 showed increased apoptosis in double-mutant mice relative to control mice (45.28 ± 17.39 cells/mm2 in double mutants and 11.13 ± 8 cells/mm2 in control mice: p = 0.012; Fig. 3C,D). Therefore, dampened Erk1/2-MAPK and/or PI3K/Akt signaling may diminish cell survival, producing fewer OLs in R-Ras1- and R-Ras2-deficient mice.
Expression of typical myelin proteins is also reduced in R-Ras1−/−, R-Ras2−/−, and R-Ras1−/−;R-Ras2−/− mice
Given that OLs are the only cell type responsible for myelin production in the CNS, we wanted to determine how the reduced OL populations affected the amount of myelin sheathing the axons of mutant mice. We conducted a histological analysis using coronal sections of the adult brain (P90) and discovered a decrease in the corpus callosum in double-mutant mice compared with controls (Fig. 4A). Quantification revealed a decrease in average corpus callosum thickness in R-Ras1−/−;R-Ras2−/− (168 ± 11.5 μm) compared with controls (360 ± 44.5, p < 0.0001; Fig. 4B). Because we found no significant reduction in the number of axons forming this tract (3705 ± 943 axons in control mice and 4377 ± 1137 axons in R-Ras1−/−;R-Ras2−/−), its reduced size could reflect a deficit in the amount of myelin in these double-mutant mice. We then examined the corpus callosum and optic nerve from adult (P90) mice using immunohistological staining with specific antibodies against the myelin marker protein myelin basic protein (MBP). We saw a dramatic reduction in the amount of myelin enveloping axons in double-mutant mice compared with controls (Fig. 4C,D).

Myelin decrease in the absence of R-Ras1 and/or R-Ras2. A, Coronal sections from adult (P90) mouse brains stained with DAPI showing a remarkable reduction in the thickness of the corpus callosum in the double mutant compared with the control. Lower-magnification images of the corpus callosum are shown in the boxed inset (interaural 4.40–4.76 mm and bregma 0.61–0.97 mm; Paxinos and Franklin, 2013). B, Quantification of corpus callosum thickness in these coronal sections showing a decrease in R-Ras1−/−;R-Ras2−/− compared with control. Corpus callosum thickness was analyzed in several positions: position 0 in x-axis means a measurement in middle line (R-Ras1−/−;R-Ras2−/ 169.7 ± 16.5 μm, control 428.6 ± 43.1 μm, ***p < 0.0001); position 0.5 is a measurement in cingulate cortex (R-Ras1−/−;R-Ras2−/− 158.7 ± 7.8 μm, control 321.3 ± 40.7 μm, ***p = 0.0002 in right, R-Ras1−/−;R-Ras2−/− 155.1 ± 15.8 μm, control 342.4 ± 30.2 μm, ***p < 0.0001 in left); position 1 is a measurement in secondary motor cortex (R-Ras1−/−;R-Ras2−/− 184.3 ± 18.2 μm, control 365.9 ± 59.5 μm, **p = 0.0011 in right, R-Ras1−/−;R-Ras2−/− 181.8 ± 29.9 μm, control 408.2 ± 41.6 μm, ***p < 0.0001 in left); position 1.5 is a measurement in primary motor cortex (R-Ras1−/−;R-Ras2−/− 158.9 ± 12.3 μm, control 305.9 ± 66.8 μm, **p = 0.005 in right, R-Ras1−/−;R-Ras2−/− 166.7 ± 31.2 μm, control 352.5 ± 30.3 μm, ***p < 0.0001 in left). C, D Dual staining of longitudinal sections of adult (P90) corpus callosum (C) and optic nerves (D) with anti-MBP and anti-NF200 (red) reveals myelin deficits in R-Ras1−/−;R-Ras2−/− mice relative to controls. E, Immunoblot of corpus callosum lysates from P90 double-mutant mice compared with controls also shows this reduction in MAG and MBP. Western blot of adult (P90) optic nerve lysates confirmed a significant decrease in the myelin marker protein expression like MAG and MBP in single and double mutants compared with controls (n = 3). F, Significant decrease in MAG and MBP expression in the corpus callosum. Bar graph represents mean ± SD of the change relative to the control of measurements normalized to GAPDH from three different experiments: MAG R-Ras1−/−;R-Ras2−/− 72.48 ± 15.91% (**p = 0.004); MBP R-Ras1−/−;R-Ras2−/− 44.52 ± 20.53% (***p < 0.0001). G, Significant decrease in MAG and MBP expression in the optic nerve. Bar graph represents mean ± SD of the change relative to the control of measurements normalized to GAPDH from three different experiments: MAG R-Ras1−/− 72.89 ± 13.29% (**p = 0.0083), R-Ras2−/− 63.65 ± 9.45% (**p = 0.0026), R-Ras1−/−;R-Ras2−/− 52.82 ± 13.19% (**p = 0.0035); MBP R-Ras1−/− 69.24 ± 18.41% (**p = 0.0057), R-Ras2−/− 56.36 ± 20.54% (**p = 0.0014), R-Ras1−/−;R-Ras2−/− 43.47 ± 19.03% (***p = 0.00016). n = 3. Scale bars: A, 500 μm; C, D, 5 μm.
We confirmed the decrease in myelin from adult (P90) optic nerve homogenates by Western blots using antibodies against MBP and myelin-associated glycoprotein (MAG) from adult mice lacking R-Ras1 and/or R-Ras2 and controls (Fig. 4E). Specifically, levels of MAG and MBP protein were lower in single and double mutants compared with control mice (MAG: R-Ras1−/− = 27.12 ± 13.28% reduction, p = 0.008; R-Ras2−/− = 36.35 ± 9.45% reduction, p = 0.00263; and the double mutant = 47.18 ± 13.19% reduction, p = 0.00345. MBP: R-Ras1−/− = 30.76 ± 18.40% reduction, p = 0.0057; R-Ras2−/− = 43.64 ± 20.53% reduction, p = 0.00144; and R-Ras1−/−;R-Ras2−/− = 56.53 ± 19.03% reduction, p = 0.00016 (Fig. 4G). In addition, expression of MAG and MBP in the corpus callosum (Fig. 4E) and spinal cord (data not shown) confirmed that the levels of myelin were reduced dramatically in the major myelinated CNS tracts in the absence of R-Ras1 and R-Ras2 (MAG R-Ras1−/−;R-Ras2−/− 27.52 ± 15.91% reduction, p = 0.004; MBP R-Ras1−/−;R-Ras2−/− 55.48 ± 20.53% reduction, p < 0.0001; Fig. 4F).
Myelin sheath thickness is reduced in R-Ras1−/−, R-Ras2−/−, and R-Ras1−/−;R-Ras2−/− mice
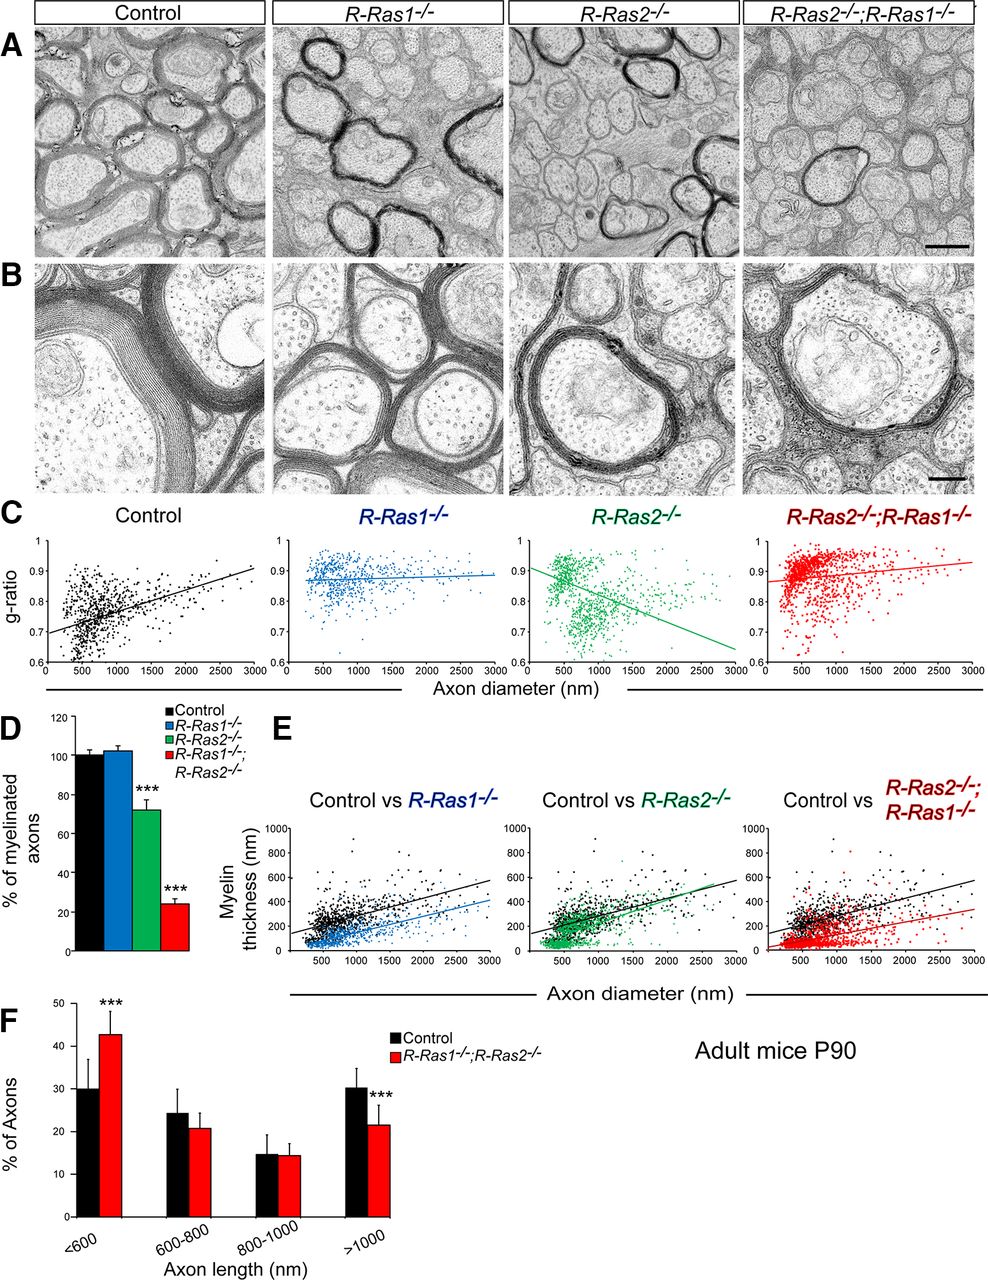
To further examine the ultrastructure of myelin tracts, we analyzed the optic nerves from R-Ras1−/−, R-Ras2−/−, double-mutant, and control (P90) mice with electron microscopy. We found that the myelin sheath was thinner in single and double mutants compared with controls (Fig. 5A). Morphometric quantification of the g-ratios for individual fibers compared with the respective axon diameter in the optic nerve (presented as scatter plots) confirmed the reduction in myelin sheath thickness in R-Ras1−/− and R-Ras2−/− mice that was more pronounced in double-mutant compared with control mice (Fig. 5C). Specifically, we quantified significant increases in the mean value of the g-ratio of single (R-Ras1−/− = 0.87 ± 0.04, p < 0.0001, and R-Ras2−/− = 0.8 ± 0.08, p < 0.0001) and double-mutant mice (R-Ras1−/−;R-Ras2−/− = 0.89 ± 0.06, p < 0.0001) compared with controls (0.75 ± 0.09).

Thinner myelin sheath in R-Ras1−/−, R-Ras2−/−, and R-Ras1−/−;R-Ras2−/− adult (P90) mutant mice. A, Transverse sections of the optic nerve from adult (P90) control, R-Ras1−/−, R-Ras2−/−, and R-Ras1−/−;R-Ras2−/− mice analyzed by electron microscopy showing a significant decrease of myelin in single and double mutants compared with controls. B, Higher-magnification images showing no differences in myelin structure, compaction, and periodicity in mutant mice compared with controls. However, R-Ras1−/−, R-Ras2−/−, and, more dramatically, R-Ras1−/−;R-Ras2−/−, show less wrapping of myelinated axons compared with controls. C, Scatter plots showing the morphometric quantification of g-ratios (y-axis) of individual fibers relative to the respective axon diameters (x-axis) from optic nerves. Significant increase in g-ratios were found in R-Ras1−/− (0.87 ± 0.04, ***p = 0.000012, n = 924 axons analyzed), R-Ras2−/− (0.8 ± 0.08, ***p = 0.000011, n = 1014 axons analyzed), and R-Ras1−/−;R-Ras2−/− (0.89 ± 0.06, ***p = 0.000072, n = 1037 axons analyzed) mice compared with controls (0.75 ± 0.09, n = 764 axons analyzed). D, Graph showing the percentage of myelinated axons present in the optic nerve of R-Ras1−/− = 102 ± 2.7%, R-Ras2−/− = 72.1 ± 5.2%, and R-Ras1−/−;R-Ras2−/− = 23.9 ± 2.5% compared with the control = 100 ± 2.8%. Significant differences were observed in the R-Ras2−/− (***p < 0.0001) and the double-mutant mice (***p < 0.0001). E, Scatter plots showing the variation of myelin thickness with respect to the diameter of axons in single and double mutants compared with the control (control = 251 ± 60 nm, n = 764 axons analyzed; R-Ras1−/− = 105 ± 53 nm, ***p < 0.0001, n = 924 axons analyzed; R-Ras2−/− = 159 ± 75 nm, ***p < 0.0001, n = 1014 axons analyzed; R-Ras1−/−;R-Ras2−/− = 73 ± 40 nm, ***p < 0.0001, n = 1037 axons analyzed). F, Graph showing the percentage of axons classified according to their diameters in control and double-mutant mice. Compared with the control, R-Ras1−/−;R-Ras2−/− mice showed a significant increase in the smallest axons, measuring <600 nm (control = 30%, R-Ras1−/−;R-Ras2−/− = 42.6% of axons, ***p < 0.0001), and a significant decrease in axons, measuring >1000 nm (control = 30.3%, R-Ras1−/−;R-Ras2−/− = 21.5% of axons, ***p = 0.0002). All samples were obtained from adult mice (P90) (n = 3). Scale bars: A, 500 nm; B, 250 nm.
To determine whether there was a change in the axonal diameter of double mutants compared with the controls, we classified the axons according to their diameter (Fig. 5F). The double mutants showed an increase in the number of axons of lower caliber associated with a decrease in axons of greater diameter (R-Ras1−/−;R-Ras2−/− = 42% increase in axons <400 nm, p < 0.0001 and 29% reduction in axons >1000 nm, p = 0.0002).
Regardless of axon caliber, we found a clear thinning of the myelin sheath in single (R-Ras1−/− = 105 ± 53 nm, p < 0.0001; R-Ras2−/− = 159 ± 75 nm, p < 0.0001) and double mutants (R-Ras1−/−;R-Ras2−/− = 73 ± 40 nm, p = 0.0001) relative to controls (251 ± 60 nm) (Fig. 5E). We quantified the number of axons that were myelinated, finding that, in the absence of R-Ras1, there was a decrease in the amount of myelin (Figs. 4E,G, 5A–C,E) without changes in the number of myelinated axons (Fig. 5D), which indicates that these axons were covered by a thinner myelin sheath. However, the absence of R-Ras2 produced a 30% reduction in the number of myelinated axons concurrent with a loss of myelin. The most drastic phenotype was presented by the double mutant, in which there was a 75% decrease in number of myelinated axons. In addition, these mice R-Ras1−/−;R-Ras2−/− showed a great decrease in the amount of myelin, indicating that these axons are coated by a very thin myelin sheath, raising the value of the g-ratio. These results demonstrate the hypomyelination of the optic nerve in mice lacking R-Ras1 and/or R-Ras2. The phenotype of the double mutant corresponds to the sum of the defects observed in the single mutants.
We then analyzed the structure, degree, and periodicity of compaction of the myelin sheaths at a higher magnification and found no differences among mutant and control mice (Fig. 5A,B). However, there were clearly fewer turns in the myelin sheaths from single mutants and even fewer in double mutants (Fig. 5B). Therefore, we conclude that the reduced myelin thickness arises from fewer myelin layers. The phenotype of the double mutant indicates that R-Ras1 and R-Ras2 play additive roles in myelination.
R-Ras1 and R-Ras2 are necessary for proper OL differentiation
To determine whether the observed myelin loss arose from altered OPC differentiation into mature OLs, we stained brain sections from mice at the most active stages of myelination in vivo (P15). The antibody used was against O4 (a sulfatide and prooligodendroblast antigen), which is a marker for cell bodies and processes from late precursors and immature premyelinating OLs (Sommer and Schachner, 1981; Dawson et al., 2000; Woodruff et al., 2001; Ramos et al., 2011). We found increased intensity in O4-labeling in the corpus callosum, which suggests an alteration in the degree of OL differentiation in double mutants compared with controls (Fig. 6A,B). We then performed dual immunohistochemistry with anti-Tcf4, a specific marker of premyelinating immature OLs (Emery, 2010), and anti-Olig2, which recognizes the complete oligodendrocytic lineage. We found a significant increase in the population of immature OLs (Tcf4+) in double-mutant mice compared with P15 control mice (Fig. 6C). The proportion of immature OLs (Tcf4+) relative to the total OL population (Olig2+) almost doubled in R-Ras1−/;R-Ras2−/− mutants relative to control mice (100 ± 7% for controls and 191 ± 39% for R-Ras1−/−;R-Ras2−/−, p = 0.016; Fig. 6C,D). We observed that the increase in Tcf4 was maintained at P30 (100 ± 20% for controls and 255 ± 14% for R-Ras1−/−;R-Ras2−/−, p = 0.002; Fig. 6D) and at P120 (100 ± 27% for controls and 170 ± 53% for R-Ras1−/−;R-Ras2−/−, p = 0.017; Fig. 6D). We found a significant increase in the population of immature OLs, not only in the early postnatal stages (P15 and P30), but also in adult mice (P120). In addition, double immunohistochemical staining in adult mice (P120) with anti-Olig2 and anti-CC1, a marker of mature OLs, showed, as expected, a significant reduction in the proportion of mature OLs in the double mutant (35.8 ± 8.6% CC1/Olig2 positive cells) compared with the control (83.8 ± 0.9% CC1/Olig2-positive cells, p = 0.0006; Fig. 6E,F). Therefore, R-Ras1 and R-Ras2 seem to be necessary for the adequate maturation of OLs.

R-Ras1 and R-Ras2 play a crucial role in OL differentiation. A, Mirror images of coronal brain sections from P15 control and R-Ras1−/−;R-Ras2−/− mice immunolabeled with an anti-O4 antibody (red). Photographs correspond to the corpus callosum (interaural 2.36–2.48 mm and bregma −1.43 mm (Paxinos and Franklin, 2013). More intense staining occurred in R-Ras1−/−;R-Ras2−/− mice, indicating an increase in the proportion of premyelinating OLs in double mutants relative to controls. B, Schematic representation of different O4 immunostaining observed in double mutants compared with controls. Right hemisphere represents R-Ras1−/−;R-Ras2−/− mice where the corpus callosum shows more premyelinating OLs (red) than controls (left hemisphere). C, Dual immunostaining with anti-Tcf4 (red) and anti-Olig2 (green) in the corpus callosum of P15 control (top) and R-Ras1−/−;R-Ras2−/− (bottom) mice. Double-mutant mice showed more premyelinating OLs than controls (Tcf4/Olig2-positive cells) in P15 mice. D, Percentage of premyelinating OLs (Tcf4-positive cells) relative to the amount of OLs (Olig2-positive cells). Double-mutant mice show a significant increase in the number of immature OLs compared with controls. Bar graph represents a significant increase in the percentage of Tcf4-positive cells in double mutants compared with controls. (P15: R-Ras1−/−;R-Ras2−/− = 91% increase *p = 0.016; P30: R-Ras1−/−;R-Ras2−/− = 155% increase, **p = 0.002 and P120: R-Ras1−/−;R-Ras2−/− = 70% increase, *p = 0.017) (n = 3). E, Double immunostaining with anti-CC1 (red) and anti-Olig2 (green) in the corpus callosum of P120 control (top) and R-Ras1−/−;R-Ras2−/− (bottom) mice. Double-mutant mice showed a drastic reduction in the proportion of mature OLs compared with the controls (CC1/Olig2 positive cells). F, Quantification of the percentage of mature OLs (CC1-positive cells) relative to the total amount of OLs (Olig2-positive cells). A significant decrease in the percentage of CC1-positive cells was found in double mutants compared with controls (R-Ras1−/−;R-Ras2−/− = 57.3% decrease ***p = 0.0006; n = 3). G, Representative confocal images of morphologies found in primary cultures stained for CNPase (green) and Olig2 (red). After 14 DIV, OLs from double mutants show simpler morphology than controls. H, Schematic representation of enriched primary OL cultures from the cortex of control and R-Ras1−/−;R-Ras2−/− mice shows a simpler morphology in double mutants. Proportion of OLs (CNPase and Olig2 positive cells) with simple and complex processes are shown for each genotype in the bar graph. Most double-mutant OLs had simple processes (72.85 ± 12.7%, n = 101 OLs quantified) that differed significantly from controls (27.15 ± 12.7%, *p = 0.0106, n = 121 OLs quantified). A few double-mutant OLs had complex processes (24.9 ± 13.3%) that differed significantly from controls (75.1 ± 13.3%, *p = 0.0106). Scale bars: A, 250 μm; C, 25 μm.
To test whether the lack of R-Ras1 and R-Ras2 dampened OL maturation, we prepared enriched OL cultures from the cortex and optic nerve of newborn R-Ras1−/−;R-Ras2−/− mice and their control littermates. We found that, by 14 DIV, OLs from the double-mutant mice expressed CNPase and formed a more simplified network of processes than those from control mice, suggesting that OL maturation is affected by loss of R-Ras1 and R-Ras2 (Fig. 6G). After labeling with anti-CNPase and anti-Olig2 antibodies, we classified OL morphology as having either simple (primary and secondary) or complex (tertiary or myelin network) processes to reflect the changes associated with OL differentiation. This quantification of cell morphology (introduced by Kremer et al., 2009) revealed distinct differences in OL maturation between R-Ras1−/−;R-Ras2−/− and control mice. OLs from R-Ras1- and R-Ras2-deficient mice had more simple processes than control mice at the expense of complex processes (45.7 ± 12.69% increase for R-Ras1−/−;R-Ras2−/− relative to the control, p = 0.0106; Fig. 6H). Therefore, we conclude that OLs in double-mutant mice acquire a simpler morphology with less complex networks of processes, indicating that R-Ras1 and R-Ras2 are essential for proper morphological differentiation in vitro.
R-Ras1 and R-Ras2 modify the size of the nodes of Ranvier and axon conduction velocity in the optic nerve
Myelin sheathes axons in segments separated by nodes of Ranvier, which are short and periodic interruptions in the myelin sheath (Fig. 7B). Given the observed hypomyelination in the optic nerve and corpus callosum of the double-mutant mice, we analyzed the gross structure of the nodal region by immunostaining against a protein located in the paranodal region, Caspr (Kamasawa et al., 2005; Murcia-Belmonte et al., 2016). Confocal microscopy of longitudinal sections of the optic nerves from adult mice (P90) immunostained with an antibody against Caspr revealed more paranodal regions in the double-mutant mice than controls (80.85 ± 19.71 paranodes/67 × 67 μm for the double mutant and 54.09 ± 14.22 paranodes/67 × 67 μm for the control, p = 0.000124; Fig. 7A,E). Indeed, we detected more Caspr protein in the adult (P90) double mutants relative to control mice after probing immunoblots of optic nerve homogenates for Caspr (p = 0.016; Fig. 7C). The paranodal increase in the double mutant indicates a shorter internodal length, generating shorter myelin sheaths compared with controls (Savvaki et al., 2008) (Fig. 7D). Altered myelination may also correlate with aberrant nodal and paranodal structures (Savvaki et al., 2008; Tanaka et al., 2009; Lee et al., 2011; Murcia-Belmonte et al., 2016). After classification of the different nodes and paranodes according to their length, we did not detect differences in paranode length (Fig. 7F). In contrast, we revealed a dramatic increase in the proportion of shorter nodes (<0.5 μm) in R-Ras1−/−;R-Ras2−/− mice relative to controls (30 ± 4.5% for double mutant and 7.4 ± 5.1% for controls, p = 0.004; Fig. 7A, boxed inset, G). Accordingly, these double-mutant mice had fewer long nodes (between 1 and 1.5 μm: 6.95 ± 4.05% for R-Ras1−/−;R-Ras2−/− and 25.65 ± 6.05% for control mice, p = 0.011; Fig. 7A, boxed inset, G). As the number of nodes of Ranvier and internodes increased, they became closer together (a decrease of ∼15% in length) in the absence of R-Ras1 and R-Ras2.

More nodes of Ranvier with shorter length generate more internodes in the absence of R-Ras1 and R-Ras2 in adult mice (P90). A, Double-staining of longitudinal sections of adult (P90) optic nerves with anti-Caspr (green) and anti-NF200 (red) reveal an increase in the number of paranodes (green) in the R-Ras1−/−;R-Ras2−/− mice compared with controls. The distance between paranodes (nodal length) in higher-magnification images (boxed insert) was shorter in double mutants than in controls. B, Simplified scheme representing the node of Ranvier between two internodes. C, Western blot of P90 optic nerve lysates showing a significant increase in Caspr protein expression in double mutants compared with controls. Bar graph shows the mean ± SD change in densitometric measurements normalized to GAPDH and relative to controls (*p = 0.016; n = 5). D, Schematic representation of the shorter nodal length and more internodes observed in the R-Ras1−/−;R-Ras2−/− mice compared with control. E, Bar graph showing a significant increase in paranodes found in double mutants (80.85 ± 19.71 paranodes/67 × 67 μm) compared with controls (54.09 ± 14.22 paranodes/67 × 67 μm) (***p = 0.000124; n = 4). F, Paranodal length classification does not reveal any differences in R-Ras1−/−;R-Ras2−/− compared with controls. G, Node classification by their length reveals more short nodes in R-Ras1−/−;R-Ras2−/− mice (30.5 ± 4.5% of nodes <0.5 μm long) than in controls (7.5 ± 5.1% of nodes <0.5 μm long, **p = 0.004) at the expense of longer nodes.
The decreased myelin sheath thickness and the presence of shorter nodes could provoke abnormal conduction of nerve impulses in the major CNS myelinated tracts (Richardson et al., 2000; Bakiri et al., 2011). Therefore, we measured the conduction velocity of nerve impulses along the optic nerve in vivo. We implanted recording electrodes into the dorsal part of the lateral geniculate nucleus of our four groups of mice (Fig. 8A–C) and stimulated the animals bilaterally with light flashes. As described previously (Wiggins et al., 1982; Meeren et al., 1998), flash stimulation evoked an early positive–negative–positive field potential, followed by some late oscillatory components. The early positive component (P1; Fig. 8C) presented latencies similar for the four groups of adult mice (P120) (9.58 ± 1.09 ms for controls; 9.73 ± 1.67 ms for R-Ras1−/−, p = 0.542; 10.32 ± 2.38 ms for R-Ras2−/−, p = 0.945; and 9.77 ± 1.35 ms for R-Ras1−/−;R-Ras2−/−, p = 0.715; Fig. 8D), which confirmed the presence of unaffected axons in the optic nerve (see above). These latencies were in the range of unitary activation of ganglion cells by photic stimulation in mice (Lintas et al., 2013). The negative component of the evoked field potential presented successive downward sags and a total long duration in mutant mice compared with controls (Fig. 8C). These successive negative waves suggest a delayed depolarization of geniculate neurons from arriving ganglion axon terminals. Indeed, quantitative analysis of the latency of visually evoked potentials showed a significant increase in their latency in single- and double-mutant mice relative to control mice (19.19 ± 2.90 ms for controls; 23.08 ± 1.51 ms for R-Ras1−/−, p = 0.00081; 24.51 ± 2.71 ms for R-Ras2−/−, p = 0.000385; and 26.36 ± 2.22 ms for R-Ras1−/−;R-Ras2−/−, p = 0.0000022; Fig. 8E). Although we found alterations in conduction velocity in the two single-mutant mice, we found the most dramatic differences in the double mutant. These results strongly suggest that R-Ras1 and R-Ras2 have cooperative and nonredundant functions. Therefore, our observed structural and electrophysiological alterations reveal that R-Ras1 and R-Ras2 are essential to achieving the correct velocity for nerve impulse conduction in myelinated CNS tracts.

Axonal conduction velocity was affected by the absence of R-Ras1 and/or R-Ras2. A, Experimental design. Alert-behaving mice received a photic stimulator (flash) through a stroboscope located 30 cm in from of them. B, Recording electrodes implanted in the left dorsal lateral geniculate nucleus. Photomicrograph illustrates recording electrode location. C, Examples of field potentials evoked by light flash stimulation at the dorsal lateral geniculate nucleus. Recordings averaged 20 times and collected from representative control, R-Ras1−/−, R-Ras2−/−, and R-Ras1−/−;R-Ras2−/− mice. Light flash presentation is indicated by an arrow. Latency to P1 and to the latest N component of the evoked field potential are indicated. D, E, Although no significant differences were observed for latency values from flash presentation to P1, latency values to the last N component of the evoked field potential were significantly larger for the three experimental groups (R-Ras1−/−, R-Ras2−/−, and R-Ras1−/−;R-Ras2−/−) compared with controls. ***p < 0.001. All mice analyzed were adults (P120).
Discussion
Here, we provide in vivo evidence that R-Ras1 and R-Ras2 play an essential role in the regulation of myelination by controlling fundamental parameters of OL survival and differentiation. Our data demonstrate that mice lacking R-Ras1 and/or R-Ras2 showed hypomyelination in major CNS tracts, reducing the conduction velocity of nerve impulses through them.
Loss of either R-Ras1 or R-Ras2 reduced the number of OLs, but a more dramatic reduction occurred with the loss of both. Therefore, R-Ras1 and R-Ras2 may cooperatively maintain the OL population. Because the double mutant induced the most severe phenotype, R-Ras1 and R-Ras2 do not seem to be functionally redundant and cannot compensate for each other. We acknowledge that the classical Ras members were not modified and did not compensate for the loss of R-Ras (data not shown).
We also detected clear differences in OL differentiation and maturation in these mutant mice. Indeed, our double-mutant mice expressed markers of premyelinating OLs more strongly, which is associated with lower expression of markers of maturity. OPCs undergo stereotyped morphological changes as they differentiate (Kremer et al., 2009). Specifically, oligodendroglial cells in dissociated cultures extend cell processes until they acquire a truly branched morphology (Ishii et al., 2012; Zuchero et al., 2015). We found that R-Ras1- and R-Ras2-deficient OLs formed a simpler network of processes than control OLs, suggesting that loss of R-Ras1 and R-Ras2 alters OL maturation in vitro and in vivo.
Defects in OL differentiation and maturation hinder myelination (Wolswijk, 1998; Kuhlmann et al., 2008; Kremer et al., 2011). When we quantified essential myelin proteins in the optic nerve and corpus callosum, we discovered distinct hypomyelination in the absence of R-Ras1 and R-Ras2. Specifically, MAG and MBP expression gradually decreased in these mutants, whereas a more significant decrease was evident in the double mutants. Electron microscopy analysis of transverse optic nerve sections from adult mice (P90) illustrated how axons possessed thinner myelin sheaths regardless of axon diameter. R-Ras1−/− and R-Ras2−/− showed different g-ratio profiles, which could suggest a specific role for each of these GTPases in specific subpopulations of OLs. Although we found a gradual decrease in myelin sheath thickness in single mutants, this decrease was more dramatic in the absence of both R-Ras1 and R-Ras2. Despite the dramatic decrease in axonal myelin thickness in our mutants, we observed no alterations in the degree of sheath compaction. These results suggest that the mechanism responsible for assembling myelin sheaths around axons is independent of R-Ras1 and R-Ras2.
The decrease in myelin production in the absence of R-Ras1 and R-Ras2 was much more drastic than the loss of OLs. This result indicates that the surviving OLs are immature and incapable of myelinating axons correctly. We discovered distinct myelin deficiency in axons of all calibers, but not all fibers had hypomyelination. We propose that CNS axons can differ in their proclivity to acquire a myelin sheath, as suggested previously (Nave and Werner, 2014). Although axon diameter was comparable between mutant and control mice, we noted a tendency toward a reduced axon caliber in mutants lacking R-Ras1 and/or R-Ras2, consistent with findings that OLs condition axon caliber (Hildebrand and Hahn, 1978; de Waegh et al., 1992; Hildebrand et al., 1993; Sánchez et al., 1996; Goebbels et al., 2010). Myelination may require communication between axons, astrocytes, and OLs to determine myelin sheath thickness (Camargo et al., 2017). However, the contributions of each cell type to sheath thickness remains unknown. The absence of R-Ras1 and R-Ras2 in neuron-free cultures suggests an essential role for these GTPases in OPC differentiation. This hypothesis accounts for our observed alterations in myelination. We note that the influence of R-Ras1 and R-Ras2 on neurons and/or astrocytes was not explored in detail in our current study.
Downregulation of the PI3K/Akt and Erk1/2-MAPK pathways could induce hypomyelination, a smaller OL population, diminished cell survival, and an increased proportion of immature OLs in the absence of R-Ras1 and R-Ras2. Increased activity of the PI3K/Akt pathway, either by inhibiting PTEN or constitutively activating Akt in OLs, does produce hypermyelination without altering OPC proliferation or the final number of mature OLs (Flores et al., 2008; Goebbels et al., 2010). Moreover, altered PI3K/Akt signaling affects OL differentiation. Specifically, inhibition of mTOR, an effector of this pathway, blocks OL differentiation and preserves them in a premyelinating state associated with no myelin production (Tyler et al., 2009; Gaesser and Fyffe-Maricich, 2016). Likewise, overactivation of the Erk1/2-MAPK pathway in OLs provokes hypermyelination in major CNS tracts (Ishii et al., 2013). Conversely, loss of Erk1/2 in mature OLs decreases the amount of myelin with a concomitant reduction in the size of OL population due to poor OL viability (Ishii et al., 2014). The phenotype that we described in R-Ras1- and R-Ras2-deficient mice could result from a combined effect of deactivation of both the PI3K/Akt and Erk1/2-MAPK pathways. The relationship between R-Ras1 and R-Ras2 to PI3K/Akt and Erk1/2-MAPK signaling activation must be addressed in future studies. However, we do propose that R-Ras1 and R-Ras2 are upstream effectors of both pathways and adequately orchestrate their signaling to maintain, not only survival, but also correct OL differentiation.
Efficacy of neural transmission occurs through specific variables such as myelin thickness or node and internode length (Waxman, 1980, 1997; Zimmermann and Dours-Zimmermann, 2008; Bekku et al., 2010). Hypomyelination correlates with slower conduction velocities, as described in other mouse models that overexpress or lack distinct myelin proteins (Robaglia-Schlupp et al., 2002; Michailov et al., 2004; Lee et al., 2011). Some studies suggest that weaker myelination yields slower nerve conduction velocities and abnormal node or paranode structures (Tanaka et al., 2009; Lee et al., 2011). A decrease in newly generated OLs may change myelin structures and induce a progressive decrease in axonal conduction velocity in the corpus callosum (Schneider et al., 2016). Our data demonstrate that, in the absence of R-Ras1 and R-Ras2, shortening of the nodes of Ranvier and internodes accompanies hypomyelination, which may cause the reduced conduction velocity that we observed in the optic tract. However, we cannot exclude that the absence of R-Ras1 and R-Ras2 affects other factors such as ion channel distribution or other structural proteins in the nodal or paranodal regions. This remains an area for future studies.
To-date, R-Ras1 and R-Ras2 activity in leukodystrophias has not been explored. The accepted animal model for multiple sclerosis, experimental autoimmune encephalomyelitis, is attenuated in R-Ras1−/− because of an increase in tolerogenic dendritic cells and natural regulatory T cells (Ray et al., 2014). Based on our current results, we strongly suggest that the roles of R-Ras1 and R-Ras2 in demyelinating diseases should be studied carefully, especially in regard to the neuropathological aspects of disease.
In summary, we identified R-Ras1 and R-Ras2 as key elements for OL survival and differentiation, acting through the synergistic activation of the PI3K/Akt and Erk1/2 signaling pathways. These results are separable from the classical Ras proteins because they were neither modified nor compensated for by the lack of R-Ras responsivity. Therefore, we conclude that R-Ras1 and R-Ras2 GTPases are necessary for proper OL-mediated myelination and regulation of correct nerve impulse transmission.
Footnotes
- Received November 28, 2017.
- Revision received March 14, 2018.
- Accepted April 10, 2018.
This work was supported by the Spanish Ministry of Economy and Competitiveness (Grants BFU2015-64829-S and SAF2012-31279 to B.C. and Grant SAF2015-70368-R to F.W.). We thank Drs. M. Izquierdo, P. Bovolenta, and B. Alarcón for helpful scientific discussions; Dr. A. Morales for providing the Nkx2.2 antibody; J.R. Perea, S. Gutierrez-Erlandsson, M. Guerra, and T. Martin for technical assistance; M. Sefton for critical reading of the manuscript; and Life Science Editors for editing assistance. The qRT-PCR experimental development and data analysis were provided by the Genomics and NGS Core Facility at the Centro de Biología Molecular Severo Ochoa, Madrid, Spain.
The authors declare no competing financial interests.
- Correspondence should be addressed to Dr. Beatriz Cubelos, Departamento de Biología Molecular, Centro de Biología Molecular Severo Ochoa, Nicolás Cabrera 1, Universidad Autónoma de Madrid, 28049 Madrid, Spain. bcubelos{at}cbm.csic.es
- Copyright © 2018 the authors 0270-6474/18/385096-15$15.00/0