
Abstract
Changes in the balance between glutamate (Glu) release and uptake may stimulate synaptic reorganization and even synapse loss. In the case of neurodegeneration, a mismatch between astroglial Glu uptake and presynaptic Glu release could be detected if both parameters were assessed independently and at a single-synapse level. This has now become possible due to a new imaging assay with the genetically encoded ultrafast Glu sensor iGluu. We report findings from individual corticostriatal synapses in acute slices prepared from mice of either sex that were >1 year of age. Contrasting patterns of short-term plasticity and a size criterion identified two classes of terminals, presumably corresponding to the previously defined IT (intratelencephalic) and PT (pyramidal tract) synapses. The latter exhibited a higher degree of frequency potentiation/residual Glu accumulation and were selected for our first iGluu single-synapse study in Q175 mice, a model of Huntington's disease (HD). In HD mice, the decay time constant of the perisynaptic Glu concentration (TauD), as an indicator of uptake, and the peak iGluu amplitude, as an indicator of release, were prolonged and reduced, respectively. Treatment of WT preparations with the astrocytic Glu uptake blocker TFB-TBOA (100 nm) mimicked the TauD changes in homozygotes. Considering the largest TauD values encountered in WT, ∼40% of PT synapses tested in Q175 heterozygotes can be classified as dysfunctional. Moreover, HD but not WT synapses exhibited a positive correlation between TauD and the peak amplitude of iGluu. Finally, EAAT2 (excitatory amino acid transport protein 2) immunoreactivity was reduced next to corticostriatal terminals. Thus, astrocytic Glu transport remains a promising target for therapeutic intervention.
SIGNIFICANCE STATEMENT Alterations in astrocytic Glu uptake can play a role in synaptic plasticity and neurodegeneration. Until now, the sensitivity of synaptic responses to pharmacological transport block and the resulting activation of NMDA receptors were regarded as reliable evidence for a mismatch between synaptic uptake and release. But the latter parameters are interdependent. Using a new genetically encoded sensor to monitor extracellular glutamate concentration ([Glu]) at individual corticostriatal synapses, we can now quantify the time constant of perisynaptic [Glu] decay (as an indicator of uptake) and the maximal [Glu] elevation next to the active zone (as an indicator of Glu release). The results provide a positive answer to the hitherto unresolved question of whether neurodegeneration (e.g., Huntington's disease) associates with a glutamate uptake deficit at tripartite excitatory synapses.
- astrocytes
- EAAT2
- Glu imaging
- glutamate clearance
- synapse pathology
- tripartite synapse
Introduction
A low level of extracellular glutamate concentration [Glu] is an important prerequisite for high spatial and temporal discrimination of afferent signals. Electrogenic transport of Glu from the environment of active synaptic terminals into astroglial cells secures resting [Glu] levels of <100 nm (Bergles et al., 1999; Marcaggi and Attwell, 2004; Tzingounis and Wadiche, 2007; Nedergaard and Verkhratsky, 2012; Papouin et al., 2017; Rose et al., 2018). Compared with other synaptically enriched proteins, including the AMPA receptors, excitatory amino acid transport proteins are very abundant (Lehre and Danbolt, 1998; Marcaggi and Attwell, 2004; Cahoy et al., 2008), forming clusters on the perisynaptic astroglial processes (PAPs) next to the sites of transmitter release (Lehre and Danbolt, 1998; Melone et al., 2011). However, the proximity between the sites of synaptic Glu release and astrocytic uptake could vary according to the type of synapse or the functional state of the involved cells (Octeau et al., 2018).
Insufficient expression/activity of Excitatory Amino Acid Transporter 2 (EAAT2) is considered among the mechanisms promoting excitotoxic damage and neurodegeneration (Pekny et al., 2016; Verkhratsky et al., 2016). As for Huntington's disease (HD), there is full agreement that the transcription of the EAAT2-encoding gene SLC1A2 and tissue uptake of radiolabeled EAAT2 substrates are reduced in comparison with healthy controls (Lievens et al., 2001; Behrens et al., 2002; Shin et al., 2005; Miller et al., 2008; Bradford et al., 2009; Faideau et al., 2010; Huang et al., 2010; Menalled et al., 2012; Grewer et al., 2014; Meunier et al., 2016). Records from striatal astrocytes (Dvorzhak et al., 2016) suggested a 20–30% decrease in the glutamate uptake activity in two mouse models of HD, R6/2 and Q175. Yet some caution is needed as it has remained unclear whether or not the well documented reduction of astrocytic Glu transport is to be regarded as a primary cause of synapse dysfunction/loss, or merely as an epiphenomenon reflecting glial adjustment to the massive pruning of glutamatergic terminals for other yet unknown reasons (Deng et al., 2013; Rothe et al., 2015). As synapse degeneration is likely to progress in a rather asynchronous manner resulting in a coexistence of dysfunctional and more or less healthy terminals, a satisfying answer regarding the adequate performance of astrocytic glutamate uptake in HD can be obtained only at the single-synapse level and under consideration of the individual uptake/release relationships (Barbour, 2001; Nahir and Jahr, 2013; Jensen et al., 2017; Reynolds et al., 2019).
The striatum as the most affected brain structure in HD (Khakh et al., 2017) is well suited for selective activation of glutamatergic synapses since it lacks intrinsic glutamatergic neurons. Glutamatergic afferents originate in the medial thalamus and the cerebral cortex (for review, see Reiner and Deng, 2018). Corticostriatal connections are formed by at least two distinct populations of pyramidal neurons, localized in layers 2/3 and 5. The axons originating in layer 2/3 establish bilateral intratelencephalic (IT) connections, while layer 5 axons enter the pyramidal tract (PT) and lack telencephalic collaterals to the contralateral side. Elegant electrophysiology studies (Kincaid et al., 1998) and electron microscopy studies (Reiner et al., 2010) discovered a number of differences between PT and IT afferents and their synaptic varicosities. In view of this diversity, one could expect some type-dependent differences in the release characteristics and, accordingly, differential sensitivity to factors that may cause an uptake/release imbalance.
Here we report the results of the first single-synapse experiments in striatal slices of adult mice performed with the ultrafast Glu sensor iGluu (Helassa et al., 2018). We have addressed the following three questions. (1) How does activation frequency affect the Glu release and uptake at corticostriatal terminals? (2) Does HD produce an uptake/release mismatch? (3) If so, could the indicators of uptake and/or release be used to identify dysfunctional synapses?
Materials and Methods
Animals.
The work described here has been performed in accordance with EU Directive 2010/63/EU for animal experiments and was registered at the Berlin Office of Health Protection and Technical Safety (G0233/14 and G0218/17). Z-Q175-KI mice were obtained from CHDI (Cure Huntington's Disease Initiative; stock #027410, The Jackson Laboratory). The number of CAG repeats ranged from 182 to 193. The recordings were performed in animals of either sex at 51–76 weeks of age.
Plasmids.
pAAV-CaMKIIa-ChR2(H134R)-EYFP (catalog #26969, Addgene) and pAAV-CaMKIIa-hChR2(E123T/T159C)-EYFP (catalog #35511, Addgene) were gifts from Karl Deisseroth (Stanford University). To create pAAV-CaMKIIa-iGluu (catalog #75443, Addgene), the iGluu gene was amplified by PCR from pCI-syn-iGluu (catalog #106122, Addgene) using Phusion polymerase (forward, 5′-CATCAGGATCCATGGAGACAGACACACTCC-3′; reverse, 5′-GTATGGAATTCCTAACGTGGCTTCTTCTGCC-3′) and cloned into pAAV-CaMKIIa-hChR2(H134R)-EYFP by restriction ligation using BamHI/EcoRI restriction enzymes (New England BioLabs) and T4 DNA ligase (New England BioLabs). AAV9-CaMKIIa.iGluu.WPRE-hGH and AAV9-CaMKIIa.hChR2(E123T/T159C)-EYFP.hGH were packaged at the Penn Vector Core of the University of Pennsylvania (Philadelphia, PA).
Drugs and antibodies.
All substances were obtained from Sigma-Aldrich/Merck, except for tetrodotoxin (TTX; Abcam) and TFB-TBOA (Tocris Bioscience). The primary antibodies included those to vGluT1 (1:1000; guinea pig; catalog #135304, Synaptic Systems) and EAAT2 (1:2000; rabbit; catalog #ab41621, Abcam). Secondary antibodies against guinea pig and rabbit, were conjugated to Alexa Fluor 488 (catalog #A-11073) or 555 (catalog #A-21429), obtained from Thermo Fisher Scientific.
Injections and brain slice preparation.
The animals were anesthetized by intraperitoneal injection of a mixture containing 87.5 mg/kg ketamine and 12.5 mg/kg xylazine before receiving four 1 μl intracortical injections of AAV9-CaMKII.iGluu.WPRE-hGH [7.34 × 10¹³ genome copies (gc)/ml] or one 1 μl intracortical injection of AAV9-CaMKIIa.hChR2(E123T/T159C)-EYFP.hGH (6.28 × 10¹² gc/ml) at the following coordinates with respect to bregma (mm): anterior 1.5, lateral 1.56, 1.8, 2.04, 2.28 and ventral 1.7. Three to six weeks later, the animals were anesthetized with isoflurane, transcardially perfused with cooled, aerated saline containing the following (in mm): N-methylglucamine chloride 92, KCl 2.5, NaH2PO4 1.25, NaHCO3 25, glucose 20, CaCl2 0.5, MgCl2 10, sodium pyruvate 3, and sodium ascorbate 5, at pH 7.35 and 303 mOsm/L. After decapitation and removal of the brains, parasagittal (10° off) sections (300 μm) containing the striatum were prepared as previously described (Dvorzhak et al., 2016). The slices were kept in artificial CSF (ACSF) containing the following (in mm): NaCl 125, KCl 3, NaH2PO4 1.25, NaHCO3 25, CaCl2 2, MgCl2 1, and glucose 10, at pH 7.3 and 303 mOsm/L. This was supplemented with the following (in mm): sodium pyruvate 0.5, sodium ascorbate 2.8, and glutathione 0.005. These perfusion and recovery solutions preserved the astrocytes better than physiological ACSF, or sucrose-containing or choline-containing solutions, the criteria being resting membrane potential at break-in (WT, less than or equal to −85 mV). Q175 homozygotes (HOMs) were also injected with ceftriaxone (CEF; 5 consecutive days before testing, 200 mg/kg, i.p.) or the respective control solution (physiological saline).
Quantification of synaptic [Glu] elevations with iGluu.
The biophysical characteristics of the new ultrafast Glu sensor (iGluu) have already been described (Helassa et al., 2018). Briefly, responses to saturating Glu concentration (10 mm) were recorded in transduced HEK293T cells. An iGluu off rate of 2.1 ms was determined using recombinant purified protein and stopped flow fluorimetry. For the imaging of synaptically released Glu, slices were submerged into a perfusion chamber with a constant flow of oxygenated ACSF at a rate of 1–2 ml/min. Temperature during the recordings was maintained at 26–27°C. In nonstimulated acute slices from mice >1 year old, corticostriatal varicosities were visualized in the dorsal striatum using a Zeiss Plan-Apochromat 63×/numerical aperture (NA) 1.0 water-immersion objective and brief (180 ms) discontinuous exposure to a 473 nm laser beam focused to a circular area of ∼4.5 μm in diameter centered on a presynaptic varicosity. The distance to the nearest other fluorescent varicosity was typically 3–5 μm. The size of nonstimulated boutons was derived from the area of suprathreshold pixels, the threshold being defined as the mean region of interest (ROI) intensity plus 3 SDs. For the evaluation of evoked responses, the iGluu fluorescence was acquired at a frequency of 2.5 kHz from a rectangular ROI of 4 × 4 μm (20 × 20 pixels, binning 2) using a scientific complementary metal-oxide-semiconductor (sCMOS) camera (Andor Zyla4.2 PLUS, Oxford Instruments) attached to a Zeiss wide-field microscope (AxioObserver). In-house written software routines controlled the laser, camera, and electrical stimulation of the axon/bouton. Each pixel of the ROI was evaluated separately for the construction of time- and space-dependent [Glu] profiles after release. The iGluu intensity values were expressed as suprathreshold pixel fluorescence ΔF in the percentage of the mean baseline fluorescence derived from the data points acquired during a 50 ms period before stimulation. The stimulus-induced changes of suprathreshold ΔF/F (change at the peak of averaged transient derived from all suprathreshold pixels) in time or space are referred to as “iGluu transients” or, simply, as “transients.”
For the quantification of iGluu at single synapses, we defined the following key parameters. The boundaries of the presynaptic bouton at rest (before any stimulation) were calculated from the F values at rest and included pixels with F values larger than the ROI mean plus 3 SDs (Fig. 1D, area outlined in blue). The area of suprathreshold pixels at rest was approximated as a circle, and the resulting virtual “Bouton diameter” was used as indicator of bouton size. The term “Peak amplitude” refers to the peak ΔF/F value of an averaged intensity transient derived from all suprathreshold pixels (Fig. 1E, distance between dotted red lines). Tau decay (TauD) is the time constant of decay derived by fitting a monoexponential function to the decay from the peak of the averaged transients (Fig. 1E, amplitude between dotted red lines). The spatial extension of the iGluu signal is described on the basis of a virtual diameter derived from the area of all suprathreshold pixels combined to form a virtual circle. The respective diameter is referred to as “Spread.” The term “Peak spread” refers to the peak value of the averaged spread transient (Fig. 1F, difference between dotted red lines). The indicator “Residual ΔF/F” is derived from fitting a double exponential function to the iGluu transient after the last stimulus. It corresponds to the ΔF/F value at the intercept between the fast and slow phases of iGluu decay (Fig. 2E, red horizontal line). “Integral ΔF/F” refers to the sum of all responses during a series of six stimuli at 100 Hz within a period of 70 ms starting with the first stimulus. Dysfunctional synapses could best be detected by analysis of single-pixel iGluu using the pixel with the highest iGluu elevation at any given terminal. The highest iGluu elevations were always found within or next to the bouton at rest. The peak amplitude of the single pixel transient with the highest iGluu elevation will be referred to as “Maximal amplitude” (see Fig. 4A–C, difference between red dotted lines). The respective TauD values are referred to as “TauDmax.” In the following text, these parameter names will be written in italics and capitals to underline that these are predefined indicators introduced for the convenience of the present single-synapse analysis.

Monitoring single-synapse Glu transients in acute slices from adult mice after expression of the genetically encoded ultrafast Glu sensor iGluu in corticostriatal neurons. A, Resting iGluu fluorescence merged to the respective 63× differential interference contrast image of a corticostriatal slice showing an axon with three adjacent varicosities and a stimulation pipette at the central bouton. B, Simplified scheme of the corticostriatal circuitry (Reiner et al., 2010), illustrating the concept of the preferential projection of PT neurons to indirect pathway SPNs (iSPNs) and IT neurons to direct pathway SPNs (dSPNs), with size differences between the IT and PT terminals. C, Bimodal distribution of bouton diameters as determined by the suprathreshold resting fluorescence before stimulation. Boutons with diameter ≥0.63 μm were defined as “Large” and assumed to be issued by PT axons. D, Example of a PT-type bouton with the respective iGluu fluorescence at rest (left) and at the peak of an AP-mediated iGluu response (right). E, F, iGluu responses recorded from the bouton shown in A and D. Experiment in 2 mm Ca2+ and 1 mm Mg2+. E, Simultaneous recording of stimulation current (top trace) and mean intensity of suprathreshold pixels (bottom trace). Peak amplitude (between dotted red horizontal lines) and a monoexponential function fitted to the decay from this peak (red overlay). TauD values are next to the fitting curves. F, Plot of spread against time (for a definition, see Materials and Methods). Peak spread is the difference between dotted red horizontal lines. G, Positive correlation between peak spread and TauD after stimulus #1. H, Peak amplitude of responses to stimulus #1. There is no difference between small and large terminals. I, Significant correlation between the PPR of peak amplitude and bouton diameter. *p < 0.05, **p < 0.01, ***p < 0.001.

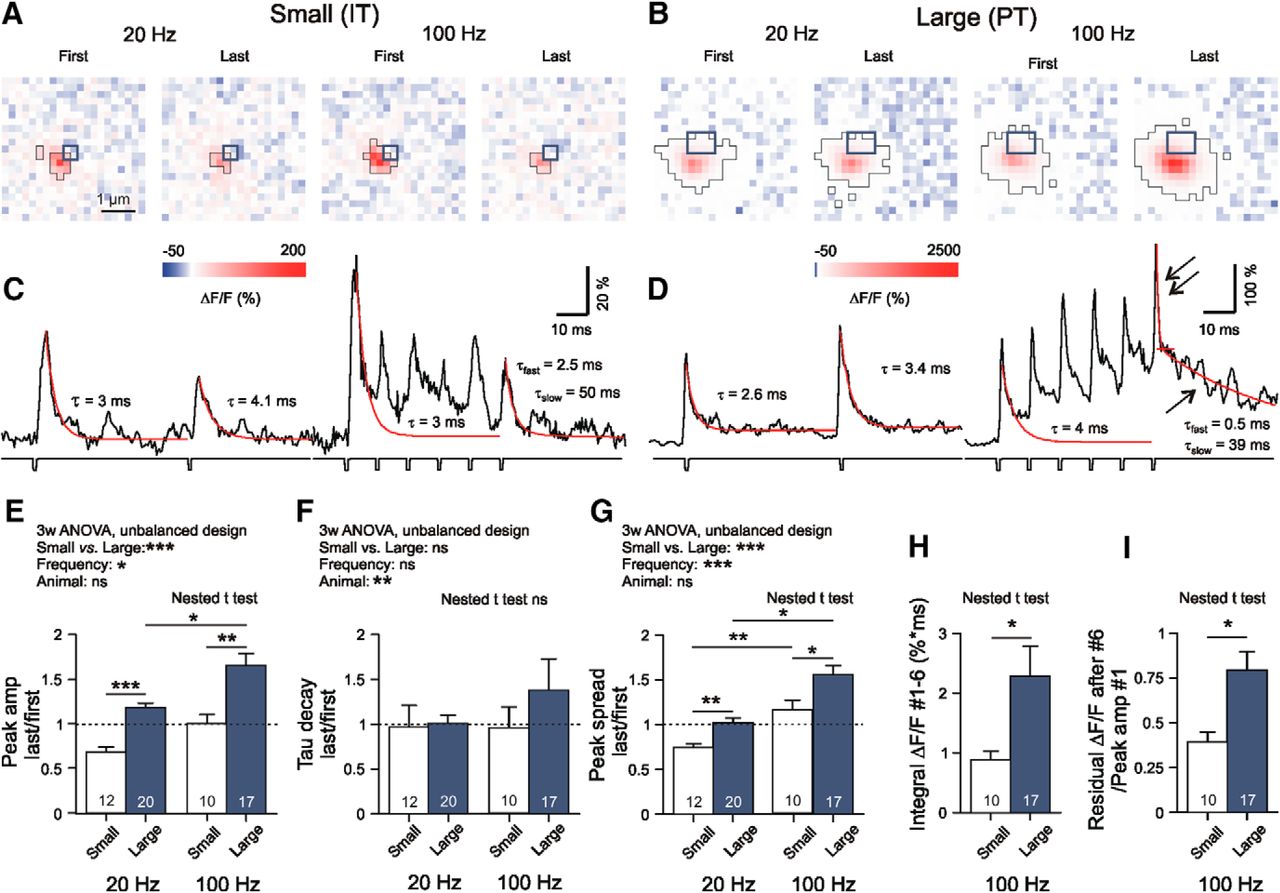
Contrasting dynamics of Glu release from small and large corticostriatal terminals. A–D, Specimen records of AP-mediated iGluu signals from small and large boutons, as obtained with 20 and 100 Hz stimulation. All iGluu transients were elicited in an AP-dependent manner in 2 mm Ca2+. Experimental conditions as in Figure 1. The large terminals produced a significant build-up of residual iGluu (single arrow). The respective fluorescence added to the fast stimulus-locked transients after #6 (double arrow)]. E–I, Quantification of results. H, Note that the time integral of all suprathreshold pixel intensities generated by a six-pulse train at 100 Hz during a sampling period of 70 ms was much bigger in large boutons. Three-way ANOVA statistics: E: Levene's test, F(df1 = 29, df2 = 29) = 3.802, p < 0.001; Small vs Large, F(1,29) = 19.507, p < 0.001; Frequency, F(1,29) = 7.207, p = 0.012; Animal, F(9,29) = 0.765, p = 0.649; Animal-Frequency, F(8,29) = 1.154, p = 0.359; Animal-Small/Large, F(5,29) = 0.46, p = 0.803; Small/Large-Frequency, F(1,29) = 0.000, p = 0.999; F: Levene's test, F(df1 = 29, df2 = 29) = 2.202, p = 0.020; Small vs Large, F(1,29) = 1.207, p = 0.281; Frequency, F(1,29) = 1.038, p = 0.317; Animal, F(9,29) = 4.330, p = 0.002; Animal-Frequency, F(8,29) = 2.398, p = 0.041; Animal-Small/Large, F(5,29) = 2.206, p = 0.82; Small/Large-Frequency, F(1,29) = 0.305, p = 0.585; G: Levene's test, F(df1 = 29, df2 = 29) = 3.202, p = 0.015; Small vs Large, F(1,29) = 11.226, p = 0.002; Frequency, F(1,29) = 21.526, p < 0.001; Animal, F(9,29) = 0.840, p = 0.575; Animal-Frequency, F(8,29) = 0.895, p = 0.533; Animal-Small/Large, F(5,29) = 0.818, p = 0.547; Small/Large-Frequency, F(1,29) = 0.155, p = 0.696; H: Nested t test, F(1,12) = 6.05, p = 0.032; I: Nested t test, F(1,25) = 6.47, p = 0.018; Hedges' g values: E: Small vs Large at 20 Hz, D = 2.4; Small vs Large at 100 Hz, D = 1.3; F: G < 0.4 in all pairs; G: Small vs Large at 20 Hz, D = 1.4; Small vs Large at 100 Hz, D = 1.1; H: D = 0.8; I: G = 1.0; H: G = 1.0. The asterisks on the horizontal bars on the graphs denote significance levels according to the nested t test. *p < 0.05, **p < 0.01, ***p < 0.001.
Single-axon/bouton activation.
To induce the Glu release from individual synaptic boutons under physiological conditions, a depolarizing current pulse was applied through an ACSF-filled glass pipette (tip diameter, <1 μm; resistance, 10 MΩ) placed next to an axon in close proximity with a fluorescent varicosity. Responses were elicited at minimal intensity at a repetition frequency of 0.1 Hz. They disappeared when the pipette was moved by as little as 1 μm. Single-bouton recording of iGluu in the presence of TTX was performed in elevated (5 mm) extracellular [Ca2+] using a biphasic stimulation. For more details on single bouton activation and the recording of unitary EPSCs (uEPSCs), see Kirischuk et al., 1999, 2002; Dvorzhak et al., 2013a.
Patch-clamp recording of unitary EPSCs.
uEPSCs were recorded in the presence of bicuculline methiodide, as previously described (Dvorzhak et al., 2013b). Briefly, the intrapipette solution contained the following (in mm): cesium methane sulfonate 100, CsCl 50, NaCl 5, CaCl2 0.5, EGTA 2.5, HEPES 25, MgATP 2, and GTP 0.3, at pH 7.2. uEPSCs were induced via optical activation of action potentials (APs) in hChR2(E123T/T159C)-EYFP-expressing corticostriatal axons. Using the point illumination system UGA-42 (Rapp OptoElectronic), the duration and size of the laser pulse was adjusted to activate a synaptic response with distinct threshold. Stimulation was accepted as minimal if the following criteria were satisfied: (1) uEPSC latency remained stable (fluctuations <20% of means, (2) lowering stimulus duration by 20% resulted in a complete failure of uEPSCs, and (3) an increase in stimulus duration by 20% changed neither the mean amplitude nor the shape of uEPSCs. To elicit AMPAR- and NMDAR-mediated components of uEPSCs, records were performed at holding potentials of −70 and +50 mV, respectively.
Synaptic EAAT2 immunofluorescence.
Using deep isoflurane anesthesia, mice were transcardially perfused with ice-cold PBS followed by a solution of 4% (w/v) paraformaldehyde in PBS. Sagittal sections (30 μm) were prepared as previously described (Rothe et al., 2015). Freely floating sections were double stained with guinea pig anti-vGluT1 (1:1000) and rabbit anti EAAT2 (1:2000), followed by respective secondary antibodies at a concentration of 1:800. Grayscale 16 bit images (1091 × 1091 pixels; pixel size, 0.073 μm; no binning) were acquired from the dorsal striatum using a Zeiss 100× oil-immersion objective (NA, 1.3) and a Spot Insight camera system (Diagnostic Instruments). All images were taken from the dorsal striatum. Areas of interest (AOIs; 400 × 400 pixels; 853 μm2) were cropped from the larger viewfields, selecting neuropil areas with a minimum of cell somata or vessels. Quantification of EAAT2 immunofluorescence (IF) was performed using ImagePro Plus (MediaCybernetics). Within the selected AOIs, smaller ROIs (25 × 25 pixels; 3.33 μm2) were then centered to individual vGluT1+ spots to determine the level of synaptic EAAT2 IF. A threshold algorithm was used to define the boundaries of the EAAT2+ area, excluding pixels with F < ROI mean plus 1.5 SDs. The data are expressed as integral intensity of suprathreshold pixels. The term “Synaptic integral EAAT2 IF” refers to the mean value from 10 individually assessed ROIs (i.e., the environment of 10 vGluT1+ terminals) within one AOI. The sections from three WTs and three Q175 HOMs were stained together, and all images were acquired with the same camera settings. A total of 300 synapses were evaluated per genotype.
Statistics.
Data analysis was performed with Prism 8 (GraphPad Software). Considering that the comparison of the means could be influenced by interanimal variance (Aarts et al., 2014), we have performed a multilevel (“nested data”) analysis, where needed. p values of <0.05 were considered statistically significant. Significance levels were marked by asterisks, as follows: *p < 0.05, **p < 0.01, and ***p < 0.001. The abbreviation “ns” in the Figures means “not significant”. The numbers indicate animals, cells, or presynaptic terminals, as mentioned in figure legends or tables. Genotype-related effects are expressed as change in percentage of mean WT values (Delta in Tables 2 and 4) or as effect strength according to Cohen's d or Hedges' g. The d or g values >0.8 suggest that the respective effect was strong. The abbreviations DFn and DFd refer to the degrees of freedom in the nested data analysis, as performed with GraphPad Prism. DFn - degrees of freedom of numerator, DFd - degrees of freedom of denominator.
Results
Evaluation of AP-mediated perisynaptic corticostriatal Glu transients using the new ultrafast sensor iGluu in acute slices from adult mice
Placement of stimulating electrodes in the vicinity of corticostriatal terminals at rest was performed under visual guidance (Fig. 1A). Bouton size was defined on the basis of resting fluorescence in the ROI (Fig. 1, thick blue outline). The deduced virtual Bouton diameter exhibited a bimodal distribution (Fig. 1C). Varicosities with a diameter ≤0.57 μm were defined as “Small” and, for the sake of brevity, tentatively referred to as IT type. Accordingly, varicosities with d ≥ 0.63 μm were classified as “Large” or PT type. The size difference between terminals classified as Small (IT) versus Large (PT) was significant at p < 0.001 (Table 1).
Comparison of iGluu signals in varicosity types Small (presumably IT) and Large (presumably PT)
After electrical stimulation of a fluorescent corticostriatal axon in the dorsal striatum, iGluu intensity increased in the pixels adjacent to the bouton at rest (Fig. 1D, thin black outline: active area). To assess the dynamic characteristics of the iGluu signal, the mean values of all suprathreshold pixel intensities (ΔF/F) generated by one synapse were plotted against time (Fig. 1E). The Peak amplitude was determined, and a monoexponential function (Fig. 1E, red line) was fitted to the averaged iGluu transient ΔF/F to determine TauD. In the case of single-pulse activation, there was no significant correlation between TauD and Bouton diameter (not illustrated).
The focus of the current experiments was placed on the time course of the iGluu signals. The position of the sensor and its low affinity for Glu naturally set limits to the detection of [Glu] elevations at larger distance from the site of vesicle exocytosis. Nevertheless, we also expected some preliminary information on the spatial characteristics of the iGluu signal. Therefore, the parameter Peak spread was deduced from the projection of the suprathreshold iGluu area to the focal plane and plotted against time (Fig. 1F, distance between dotted red lines). Under the condition of single-pulse activation, Peak spread exhibited a significant positive correlation with TauD (Fig. 1G), but there were no terminal type-related differences in the mean values of Peak amplitude, TauD, and Peak spread after single-pulse activation (Fig. 1H, Table 1).
The contrasting properties of IT- and PT-type terminals became more obvious with repeated stimulation. Activation with stimulus pairs at an interval of 50 ms revealed differences in the paired pulse ratio (PPR) of Peak amplitude, resulting in a positive correlation between PPR and Bouton diameter (Fig. 1I). This finding validated our size criterion for synapse identification and provided a first hint that IT and PT afferents may generate a differential load for Glu clearance when repeatedly activated.
Frequency-dependent potentiation of Glu release at PT but not IT corticostriatal terminals
As we aimed at exploring the limits of Glu release under conditions resembling the cortical activity during movement initiation, we applied two or six stimuli at frequencies of 20 or 100 Hz to elicit AP-mediated Glu release. At all frequencies tested, Small/IT and Large/PT terminals exhibited contrasting types of short-term plasticity (i.e., depression or no change in IT and potentiation in PT terminals; Fig. 2A–D, Table 1). The Peak amplitude observed after the last stimulus in a train normalized to response #1 were larger in PT than in IT terminals (Fig. 2E, Table 1). The normalized TauD values exhibited little difference (Fig. 2F), but the normalized Peak spread values differed, being larger at PT-type varicosities (Fig. 2G). When tested at 100 Hz, PT synapses produced larger Integral ΔF/F #1–6 than IT terminals (Fig. 2H) and accumulated more Residual ΔF/F (Fig. 2I). The data suggest that the stimulus-locked response to the last AP adds to already incompletely cleared synaptic Glu. Thus, under repetitive activation conditions, corticostriatal afferents might be affected by conditions of weak astrocytic Glu uptake.
Directly induced Glu transients in tetrodotoxin
With the AP mechanism intact, fluorescence might also originate from neighboring release sites, especially if the axon heads deeper into the z-plane of the slice. In the case of serial (en passant) type synapses (as characteristic of PT afferents), this could erroneously increase signal duration and spread. Another caveat to be faced in the case of HD preparations is a possible alteration of voltage-activated channels in the cortical afferents (Silva et al., 2017), which may affect the duration of the presynaptic depolarization, the influx of Ca2+, and, consequently, the amplitude and duration of iGluu signals, without having a direct impact on the clearance machinery of the astrocytes. Moreover, respective deficits might preferentially occur in IT or PT axons. Considering these complexities, it was decided to bypass the AP mechanism by directly depolarizing the glutamatergic terminals in TTX and to focus, initially, on just one type of terminal. We selected the Large/PT input.
To achieve, under condition of TTX, at PT terminals [Glu] elevations similar to those obtained under physiological activation conditions at 100 Hz, it was sufficient to increase [Ca2+]ec to 5 mm and to add a hyperpolarizing prepulse to the standard 1 ms depolarization used in both AP and TTX experiments. In the absence of a conditioning hyperpolarizing prepulse, the direct depolarization was insufficient to elicit release (Fig. 3A). The results shown in Figure 3, B and C, indicate that the selected protocol provided a good match between the physiologically induced #6 responses at 100 Hz and the directly induced responses in TTX. In any case, iGluu elevations were completely abolished by the Ca2+ channel blocker Cd2+ (Fig. 3D). This stimulation protocol was then expected to provide a reasonably standardized challenge of the synaptic Glu uptake in WT or HD mice. In the following experiments (Figs. 4, 5), all synapses were tested in TTX applying paired (Δt = 50 ms) biphasic pulses with a repetition frequency of 0.1 Hz.
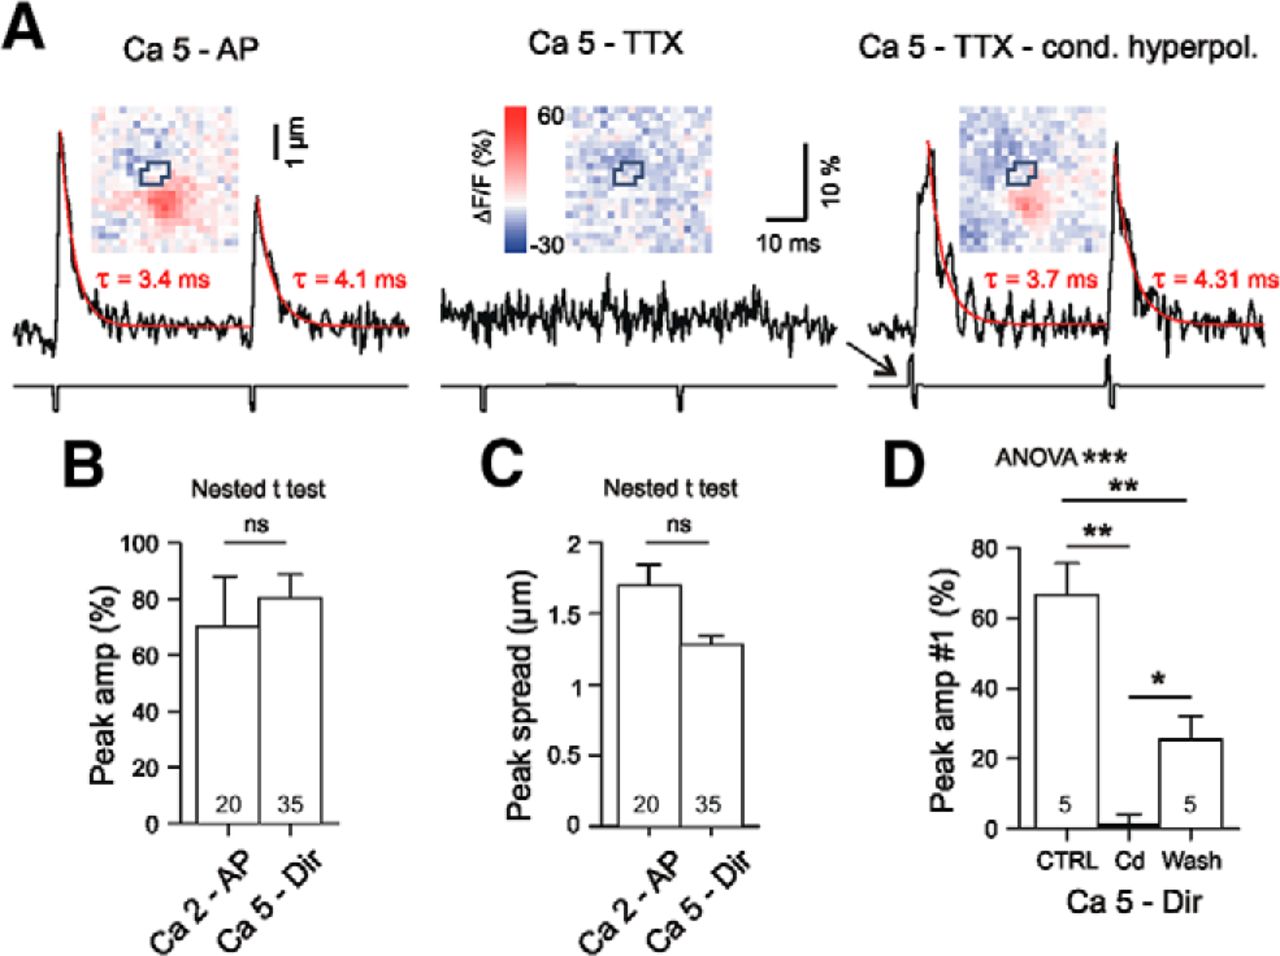
Responses to directly induced test pulses bypassing the AP mechanism in WT boutons of type PT. A, Experiment in elevated [Ca2+]ec. Left, Response to electrical stimulation in the absence of TTX elicited by a short (1 ms) depolarizing pulse. In 5 mm Ca2+, the AP-mediated response exhibits paired pulse depression. Middle, Same condition but in the presence of TTX. Note the complete block of Glu release. Right, Response in 5 mm Ca2+ and TTX, but elicited with the 1 ms depolarizing pulse preceded by a short hyperpolarizing pulse. This configuration will in the following be referred to as “Ca5-Dir”. B, C, Stimulus intensity for direct activation of Glu release in TTX (“Ca5 - Dir”) was adjusted such that the peak amplitude and peak spread of iGluu signals matched the amplitudes observed with the last (#6) 100 Hz response under physiological conditions (“Ca 2 - AP”). D, The directly induced responses were completely blocked by Cd2+ (500 μm). Cohen's d: CTRL vs Cd = 4.4, Cd vs Wash = 2, CTRL vs Wash = 2.3. *p < 0.05, **p < 0.01, ***p < 0.001.

HD-related differences in the clearance of synaptically released Glu. A–C, Superposition of suprathreshold pixel transients induced by direct activation of PT-type varicosities in the presence of TTX. Differences between dotted red horizontal lines: Maximal amplitude of a single pixel transient. In white: averaged transient from all suprathreshold pixels. Curves in gray (WT), red (HET), and magenta (HOM), monoexponential function fitted to the decay from peak amplitude. D, Averaged responses normalized to same peak amplitude; same boutons as in A–C. The respective fitting curves highlight the differences in the duration of the Glu transients. E, F, Quantification of results from the entire dataset. WTs, Gray; HETs, red; HOMs, magenta. G, Incubation of WT slices in 100 nm TFB-TBOA simulated the depression of Glu clearance observed in HOMs. H–L, Specimen images, traces, and quantification for the spread in WT and HD mice. M, Lack of genotype-related differences in spread velocity. Nested ANOVA statistics: E: F(2,26) = 4.17, p = 0.027; F: F(2,26) = 2.7, p = 0.086; I: F(3,15) = 5.5, p = 0.0095; L: F(2,26) = 0.52, p = 0.600; M: F(2,26) = 0.65, p = 0.528. *p < 0.05, **p < 0.01, ***p < 0.001. See Table 2 for more details.

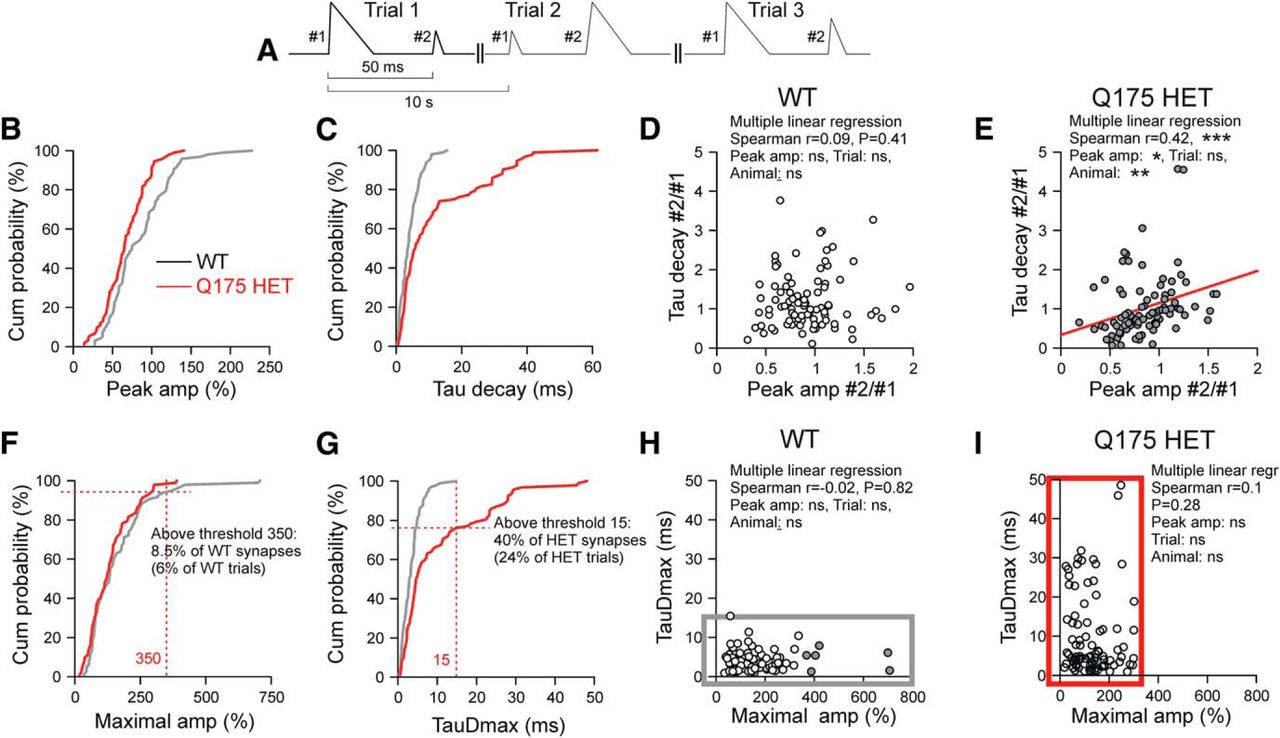
Relationship between Glu release and uptake, and the identification of dysfunctional synapses in HD. A, Basal scheme of data organization. B–I, The graphs are based on three consecutive trials from each synapse. Data are from 35 PT-type WT synapses and 32 HET synapses, except for D and E. B, C, Cumulative histograms of #1 Peak amplitude and #1 TauD values. D, E, Plots of normalized (to # of the first trial) #2 responses. Data from 31 PT-type WT synapses and 30 HET synapses. Note that HETs but not WTs exhibited a positive correlation between TauD and Peak amplitude. In E, the slope parameters of the three predictors Peak amplitude, Trial, and Animal were significant for Peak amplitude (p = 0.015) and Animal (p = 0.002). The latter suggests that in different Q175 HETs the disease has progressed to different degrees. Significance levels for other variables: Peak amp*Animal - p = 0.003, Peak amp*Trial - n.s., Trial*Animal - n.s. F, G, Cumulative histograms of #1 Maximal amplitude and #1 TauDmax. In the HET sample, all Maximal amplitude values were ≤350%. In the WT sample, all TauDmax values were ≤15 ms. A total of 40 synapses exhibited in at least one of the three trials a TauDmax value exceeding the Threshold defined by the longest TauDmax value in WTs. Twenty-four percent of the HET trials exceeded the 15 ms limit. Accordingly, 30% of the WT responses were larger than in HETs, and these suprathreshold responses were derived from 51% of the synapses. H, I, Correlograms of TauDmax and Maximal amplitude for WT and Q175 HET. These graphs emphasize the HD-related differences in the ranges of Maximal amplitude and TauDmax. Maximal amplitude values exclusively seen in WTs are shown in gray, and TauDmax values exclusively encountered in HETs are shown in red. *p < 0.05, **p < 0.01, ***p < 0.001.
Slowed Glu clearance at single PT-type corticostriatal terminals in HD mice
In the Q175 mouse model of HD, motor symptoms (hypokinesia and dyskinesia, pathological circling) develop quite slowly. However, at ≥1 year of age, both Q175 heterozygotes (HETs) and HOMs resemble the human phenotype at a symptomatic stage (Khakh et al., 2017). In Q175 HOMs, motor impairment coincided with the appearance of pathological gamma oscillations in the local field potential (LFP) recordings at quiet rest (Rothe et al., 2015). In R6/2 mice, the changes in the LFP power spectrum were less pronounced after treatment with CEF, a transcriptional activator reported to increase the level of EAAT2 protein in the dorsal striatum (Miller et al., 2012). TFB-TBOA is a blocker of Glu uptake (Shimamoto et al., 2004). Its application would therefore simulate the effect of reduced EAAT2 expression/activity in HD mice. Figure 4A–C shows representative single-synapse records from WTs, HETs, and HOMs. The black traces in Figure 4A–C are individual pixel transients; the values between the dotted lines correspond to the Maximal amplitude. The white line is the mean transients derived from all suprathreshold pixels of a synapse. The monoexponential fitting curves are shown in gray (WTs), red (HETs), or magenta (HOMs). Figure 4D presents the amplitude-scaled average responses for the three genotypes illustrating our main finding, as follows: in HD slices, the iGluu transients decay more slowly than in WT mice (also see Movie 1). Interestingly, this HD-related alteration was significant not only in Q175 HOMs but also in HETs (Fig. 4E), thereby demonstrating the usefulness of the Q175 HET model for research on astrocyte pathology in HD mice.
Slow motion video, factor 1240×. Top row, Images from WT (left), Q175 HET (middle), and HOM (right). Bottom row, Respective averaged iGluu transients from all suprathreshold pixels.
An important additional question concerns the amount of released Glu. Is it increased by HD? This was not the case, on the contrary. Despite a considerable variability in the Peak amplitude, we found a tendency for smaller amplitudes in HD (Fig. 4F, Tables 2, 3). Unfortunately, multilevel data analysis failed to verify the difference between WTs and HD due to the small number of available HOMs. Our result is, however, in line with the data from R6/2 (Parievsky et al., 2017), suggesting that the presently disclosed HD-related prolongation of the iGluu signal occurs despite a concomitant decrease in the Glu output from single PT terminals.
Comparison of WT with Q175 HET or HOM
Statistics for Table 2
The above observations do not immediately prove that the prolongation of the iGluu transients in HD mice were due to altered functionality of the astrocytes. It was at least necessary to clarify whether TauD responded to pharmacological manipulation of astrocytic Glu transport. This was the case. The iGluu transients of PT terminals exhibited a clear sensitivity to TFB-TBOA (Fig. 4G). In WTs, 100 nm antagonist prolonged the iGluu decay to the same extent as the disease (Fig. 4I), with the effect of pharmacological EAAT2 block being less pronounced in Q175 HOMs (Fig. 4H,I).
According to the presently available models of glutamatergic synapses (Zheng et al., 2008; Scimemi and Beato, 2009), a spread of >1.25 μm should be sufficient to activate extrasynaptic NMDA receptors. Although iGluu expression in the presynaptic terminals cannot provide exhaustive information on the spatial characteristics of perisynaptic [Glu], we nevertheless examined the Peak spread (Fig. 4J, black outlines). There was a tendency for increase (Fig. 4K), but this tendency failed to reach significance in nested ANOVA (Fig. 4L) and nested t tests (Tables 2, 3). The mean spread velocity (∼1.5 μm/s) did not vary with the genotype (Fig. 4M).
Positive correlation between Glu release and clearance in HD but not WT synapses
Cumulative histograms and correlograms were plotted for further analysis of HD-related synapse pathology. The graphs of Figure 5, except for panels D and E, are based on the values obtained from 35 WT and 32 HET synapses, as explained by the evaluation scheme in Figure 5A. Each synapse is represented with three consecutive trials elicited at a frequency of 1/10 Hz. The interval between the stimuli for #1 and #2 was 50 ms. All data are from experiments in TTX. Figure 5, B and C, shows the relative probability of occurrence of Peak amplitude and TauD, based on a total of 105 #1 responses from 35 WT synapses and 96 #1 responses from 32 HD synapses.
Due to the highly variable configuration of the individual synapses with respect to the surrounding tissue and the focal plane of the camera, and due to interanimal variation, the values obtained from the averaged iGluu trials of different synapses exhibited considerable variability. It was therefore necessary to normalize the data. Among several possibilities, we chose the #1 response of every trial to normalize the #2 responses. Typically #2 responses were smaller after larger #1 responses, and vice versa (Fig. 5A). The normalization reduced the impact of intersynapse variability in favor of intertrial variability. If in a given trial glutamate output touched the limits of uptake, one could expect that such a release event would produce a prolonged [Glu] transient. In contrast, if uptake capacity were sufficient for any amount of released glutamate, the fluctuating TauD values should be independent on Peak amplitude. It can be seen (Fig. 5D,E) that HD but not WT synapses displayed a positive correlation between TauD and Peak amplitude, consistent with the proposal that in HD mice some synapses exhibited signs of clearance insufficiency, with the prolongation of TauD being more pronounced in trials with enhanced Peak amplitude.
Identification of dysfunctional synapses
The pixels with the highest stimulus-induced elevations of ΔF/F were always located within or immediately next to the boundaries of the resting terminal (Fig. 1D). The Maximal amplitude derived from the highest single pixel transient can be regarded as a measure of the Glu output, while TauDmax would reflect the clearance at the site of release, minimizing the influence of Glu diffusion. Figure 5, F and G, presents the cumulative probabilities of the occurrence of Maximal amplitude and TauDmax. One can see that none of the HET entries of Maximal amplitude were >350%, and ∼24% of TauDmax entries exceeded 15 ms. Forty percent of the tested synapses generated TauDmax >15 ms in at least one of the three trials, and all of these responses were <350%. The differences in the ranges of these two indicators of release and clearance, respectively, are even more obvious in the correlograms of Figure 5, H and I. TauDmax values >10 ms were (with one exception) absent in WT synapses tested with direct depolarization. As a first approximation, one can therefore state that, according to the distribution of TauDmax in WTs and Q175 HETs aged 15–19 months, 40% of HET synapses in the dorsal striatum exhibited a pathological phenotype. Of course, this estimation is no more than an educated guess based on the assumptions that 15 ms is the largest TauDmax value to be expected in WTs, and that in WTs all synapses are fully functional. The data also hint that in dysfunctional synapses Glu may find its astrocytic transporter at greater distance, which is in line with recent FRET data from corticostriatal synapses in R6/2 (Octeau et al., 2018).
Reduced perisynaptic EAAT2 protein at corticostriatal terminals
To clarify whether the observed clearance deficit is indeed accompanied by a reduction of EAAT2 protein levels in the environment of corticostriatal terminals, we performed a quantification of EAAT2 IF in fixed sections, as described in Materials and Methods and illustrated in Figure 6A–M.

HD-related reduction of synaptic EAAT2 IF. Data from three male Q175 HOMs (CAG range, 176–191; age range, 49–54 weeks) and three male WT siblings. A, C, AOIs cropped from larger view fields for quantification of synaptic integral EAAT2 IF. Numbers on EAAT2 image: mean AOI IF intensity (no intensity threshold, same display range for WTs and HOMs). B, D, Overlay of vGluT1 and EAAT2 images (display ranges optimized for object recognition). Squares outlined in white show ROIs as used for the estimation of synaptic integral EAAT2 IF. Both WT and HOM images contain numerous EAAT2 clusters without synaptic terminals, presumably representing astrocytic end-feet in contact with blood vessels (see arrows in B). In HD, vGluT1 varicosities may occur without EAAT2 clusters (ROIs boxed in red). E–L, Enlarged ROIs showing (in this order) vGluT1, EAAT2, overlay, and the suprathreshold EAAT2, as used for the estimation of integral EAAT2 IF in the immediate vicinity of one corticostriatal vGluT+ terminal. Numbers on ROIs indicate integral suprathreshold fluorescence intensity for the EAAT2 channel. M, Histogram of AOI EAAT2 pixel intensity. Note that “holes” from somata and blood vessels would influence the mean AOI values of EAAT2 intensity. N, Small ROI quantification of synaptic integral EAAT2 intensity by nested data analysis. Each data point represents the mean from 10 rectangular ROIs within 1 AOI. Dotted lines indicate the mean level from three animals (with a total of 30 AOIs, 300 synapses) per genotype. Numbers on column: AOIs and animals (in brackets); same for all columns. Statistics (F, DFn, DFd): 9.403, 1, 58. p = 0.0033. O, Histogram of synaptic integral EAAT2 from WTs and Q175 HOMs. n = 300/group. Effect size (Cohen's d) was obtained with the t value calculated by the nested t test. #, Animal number; a.u., arbitrary units; WT, light gray; HOM, magenta. *p < 0.05, **p < 0.01, ***p < 0.001.
It has frequently been observed, and could possibly be noticed in the examples of Figure 6A–D, that in 100× images from the dorsal striatum of HD mice the areas preferentially occupied by neuropil (i.e., areas without “holes” from the somata of neurons and astrocytes) are smaller than in WT mice. Moreover, a variable fraction of vGluT1+ varicosities seemed to be devoid of synaptic EAAT2+ clusters, notably in HD mice (Fig. 6D, red boxes). Finally, due to the presence of capillaries and the attached astrocyte end-feet, there were EAAT2+ clusters without vGluT1+ counterparts (Fig. 6B, arrows). To avoid ambiguity resulting from these complexities, it was decided to quantify synaptic EAAT2 IF individually in sufficiently small ROIs (1.825 × 1.825 μm2) centered to just one vGluT1+ terminal. Figure 6E–L shows representative ROIs selected from larger AOIs in the dorsal striatum (Fig. 6, B,D, white boxes). A threshold algorithm was used to delineate the boundaries of the EAAT2 clusters from where the Synaptic integral EAAT2 IF values were actually sampled. Each data point in Figure 6N represents the mean value from 10 ROIs of 1 AOI. vGluT1+ terminals without any suprathreshold EAAT2 were avoided, which may have caused an underestimation of the actual difference. Nested data analysis showed that the synaptic integral EAAT2 IF was significantly lower in HD mice (Fig. 6N, Tables 2, 3). The Cohen's d value (0.7878) suggests a strong HD-related effect (−26%). The histogram of synaptic integral EAAT2 intensity (Fig. 6O) illustrates the overall shift toward lower values of Synaptic integral EAAT2 IF in individual ROIs.
Prolonged NMDAR components of unitary EPSCs in HD
NMDARs are sensitive indicators of [Glu] and therefore well suited to detect a potentially existing Glu clearance deficit in the environment of active synapses, provided that the analyzed responses are derived from one or few synapses only (Chiu and Jahr, 2017). CEF is known to stimulate the transcription of SLC1A2 (i.e., the gene encoding EAAT2). It is therefore used to verify a contribution of EAAT2 in a pathology or recovery effect. Functional benefits from CEF injections have already been reported (Miller et al., 2008, 2012) and were attributed to enhanced EAAT2 expression in astroglia. Here we used focal optical stimulation of individual channel rhodopsin-expressing corticostriatal axons to record uEPSCs at −70 and +50 mV. The experiments showed that the T50 value of the uEPSC recorded at +50 mV is (1) solely dependent on NMDARs; (2) prolonged in HD mice; and (3) recovered to WT levels after treatment with CEF, suggesting a sensitivity of corticostriatal input to the level of EAAT2 expression (Fig. 7A–C, Table 4). Other parameters of corticostriatal uEPSCs were found unchanged by HD (Fig. 7D–F). However, more work is needed to actually prove that the observed potentiation of NMDAR activity in striatal projection neurons (SPNs) had been a result of wider spread of synaptically released glutamate.

HD-related prolongation of the NMDAR component in uEPSCs elicited by optical stimulation of single corticostriatal afferents visualized by EYFP fluorescence after the expression of CaMKIIa.hChR2(E123T/T159C)-EYFP.hGH. A, Specimen traces as recorded at two different holding potentials in the presence of bicuculline methiodide (25 μm). B, Same traces as in A, but aligned to peak. See prolonged decay in contrast to records at −70 mV. The half-decay time of the uEPSC (T50) was sensitive to APV (not illustrated). Treatment with CEF shortened the uEPSC at +50 mV to WT level (blue traces). C–F, Quantification of results. Note the significantly larger T50 values of the NMDAR-mediated response at +50 mV and recovery after CEF treatment (C). Numbers in columns: the number of tested SPNs and animals (in parentheses). For detailed results of nested data analysis and Hedges' g values, see Table 4. *p < 0.05, **p < 0.01, ***p < 0.001.
Comparison of uEPSCs in WTs, Q175 HOMs, and Q175 HOMs treated with CEF
Discussion
The analysis of single-synapse iGluu transients in acute slice preparations from adult mice provides new information on Glu clearance in its relation to the respective transmitter load. (1) After single-pulse activation, IT and PT synapses coped with the induced [Glu] elevations, but when challenged with high activation frequencies the [Glu] elevations produced by PT and IT terminals differed significantly (factor 2.6:1 for Integral ΔF/F at 100 Hz). (2) In HD mice, PT iGluu transients were found to decay more slowly. About 40% of HD synapses (14 of 32 in HETs) can be regarded as deficient, considering the time needed for complete Glu clearance (TauD of iGluu > 15 ms). (3) At any given terminal, the responses exhibited some intertrial variability. The analysis of normalized #2 responses from three trials at the same synapse revealed that in Q175 HETs, but not WTs, iGluu transients with larger Peak amplitude were associated with larger TauD, which is evidence for a disease-related loss of independence between the indicators of uptake and release. (4) HD decreased the range of Maximal amplitude but increased the range of TauDmax. (5) Immunostaining suggests that the immediate environment of corticostriatal terminals contains less EAAT2 protein. (6) The NMDAR-mediated unitary EPSCs elicited by optical stimulation of single ChR-expressing corticostriatal axons were prolonged in Q175 HOMs.
PT versus IT terminals
The unexpected differences in the properties of PT versus IT terminals raise further questions on the mechanisms of release plasticity at the glutamatergic afferents to the dorsal striatum. Previous electrophysiological studies (Ding et al., 2008) implied that corticostriatal connections preferentially exhibit paired pulse facilitation (PPF), while thalamostriatal connections are prone to paired pulse depression (PPD). Our results confirm preferential PPF with regard to the PT subgroup of corticostriatal afferents under physiological activation conditions (Table 1). However, as in any other synapse (Kirischuk et al., 2002), a conversion from PPF to PPD is easily achieved by increasing the Ca2+ influx. There is a widely accepted rule of thumb suggesting that smaller initial responses are likely to produce facilitation, and vice versa. Considering that under the same experimental conditions PT and IT terminals produced about the same initial Glu output but opposite types of frequency-dependent plasticity, one can assume that these terminals indeed represent two classes of afferents with some differences in the presynaptic control of transmitter release.
Under condition of repetitive activation, the size of synaptic terminals and associated differences in the vesicle pool size could affect the integral Glu output, and also the degree of Glu escape (Genoud et al., 2006; Bernardinelli et al., 2014; Medvedev et al., 2014; Gavrilov et al., 2018). It has been hypothesized that thicker terminals could push the PAPs farther away from the site of exocytosis, which may result in wider signal spread if the transporters are challenged with a pronounced buildup of [Glu], as found in PT terminals.
The hypothesis of nonsaturating Glu uptake in healthy glutamatergic synapses
In view of a long history of changing opinions on the significance of astrocytic Glu transport as a possible determinant of synaptic strength, it is good to have new tools at hand to shed light on the possible limits of Glu clearance in health and disease. Our uEPSC data from synaptic connections with one or few terminals confirm the long-standing idea that a weakness of Glu uptake has little influence on the decay kinetics of the fast-desensitizing AMPA responses (Hestrin et al., 1990; Asztely et al., 1997; Goubard et al., 2011; Campbell et al., 2014). Moreover, our iGluu data from healthy mice are in line with the more controversial prediction that in “normal” glutamatergic synapses glutamate transport would cope with any amount of physiologically released Glu (Diamond and Jahr, 2000; Tzingounis and Wadiche, 2007). Nevertheless, the present iGluu-based postulate of nonsaturating Glu uptake for IT- and PT-type corticostriatal synapses will need further verification under a wider range of conditions. It was already shown that the state of astrocytes could affect the structural plasticity of PAPs (Theodosis et al., 2008; Reichenbach et al., 2010; Bernardinelli et al., 2014; Heller and Rusakov, 2015; Verkhratsky and Nedergaard, 2018). Activity- and disease-dependent PAP retraction could produce a large variety of spill-out and spill-in effects, which may not only change the access of the available transmitters to respective neuronal and glial receptors, but also influence the efficacy of the astrocytic transport machinery itself (Armbruster et al., 2016).
Evidence for impairment of Glu clearance in HD
Symptomatic HD is characterized by the loss of glutamatergic terminals in the dorsal striatum, but it is still not clear whether this disease-related process of synapse pruning is to be attributed to glutamate excitotoxicity (Reiner and Deng, 2018). While the long-term consequences of reduced Glu clearance remain to be clarified, our present experiments provide new evidence, suggesting that in symptomatic Q175 mice a significant fraction of PT (∼40%) synapses is afflicted by the disease, most likely exhibiting alterations in both uptake and release. When analyzing the normalized Peak amplitude in three consecutive trials of the same synapse, it turned out that HD but not WT synapses displayed a positive, presumably pathological correlation between Peak amplitude and TauD. Considering in addition that (1) treatment of WT synapses with TBOA produced TauD values similar to those in HD synapses, and (2) Synaptic integral EAAT2 IF was significantly less in HD synapses, it is suggested that glutamate uptake, in general, and astrocytic EAAT2 deficiency, in particular, contribute to the observed synaptic dysfunction in HD synapses.
However, this conclusion is not shared by all researchers. First of all, there is some evidence that EAAT2 is also localized on presynaptic terminals. In the R6/2 model of HD, the Rosenberg group (Petr et al., 2013) confirmed the reduced expression of EAAT2 and the beneficial effects of CEF. But experiments with partial knockdown of SLC1A2 revealed little change in the fraction of EAAT2+ terminals and, even more important, in the progression of HD. Based on these and other findings, Rosenberg et al. questioned a role of EAAT2 in the pathogenesis of HD and forwarded the intriguing hypothesis that the observed downregulation of EAAT2 applies to a nonfunctional intracellular fraction of the EAAT2 protein. We find the reported 40% reduction in the glutamate uptake activity in synaptosomes after conditional GLT1 knockout (Petr et al., 2015) somewhat surprising, comparing their results with the present material where no more than 5% of the terminals exhibited full colocalization of vGluT1 and EAAT2 IF.
Considering the novelty of our present approach, it is not so unexpected that some results from other laboratories were not confirmed, in particular those obtained with the slow glutamate sensing fluorescent reporter (iGluSNFR; Marvin et al., 2013). Parsons et al. (2016) activated glutamate release by high-frequency electrical field stimulation and used the iGluSnFR sensor to record Glu elevations in large viewfields. They found no HD-related difference in the fluorescence decay, in contrast to the findings of Jiang et al. (2016). Both studies were performed in R6/2 mice, the main difference being the site of expression of the Glu sensor (neurons vs astrocytes). Parievsky et al. (2017) applied optical field stimulation of channel-rhodopsin [ChR2(H134R)]-expressing corticostriatal axons to induce EPSCs in SPNs. This approach showed no increase in the decay times (T90-10) of NMDAR-mediated currents. On the contrary, the latter were significantly shorter in HD. However, considering the mean T90-10 values of this study (∼750 ms), it seems possible that the asynchrony of release produced by this type of optical field stimulation may not give the resolution needed for the estimation of synaptic Glu clearance. In general, time- and volume-averaging effects resulting from bulk activation of synaptic and nonsynaptic Glu release and low resolution of the electrical or fluorescent signals can be expected to influence the interpretation of results on Glu uptake and release (for review, see Jensen et al., 2017; Reynolds et al., 2019).
A question receiving growing attention in the field of synaptic plasticity and dysfunction is the role of other glutamate uptake mechanisms. Bellini et al. (2018) illuminated the role of Glu uptake from two sides: pathology and functional rescue. Their convincing evidence suggests that the neuronal Glu transporter EAAT3 (EAAC1) ensures long-term synaptic activity by reducing the activation of mGluR1 in the striatum.
The ultimate proof of Glu uptake deficiency as a cause of synapse pathology in the dorsal striatum will be the recovery of normal synaptic performance after a therapeutic intervention targeting the astrocytes. Most intriguing, intrastriatal injection of a recombinant viral Kir4.1 vector restored a normal level of EAAT2 protein (Tong et al., 2014). However, it is not yet clear whether a mere stimulation of EAAT2 expression would suffice to achieve the desired reversal of motor symptoms in HD, because synaptic targeting and the activity of Glu transporters are also influenced by local translation (Sakers et al., 2017), lateral mobility (Murphy-Royal et al., 2015), and internalization (Leinenweber et al., 2011; Ibáñez et al., 2016). Clearly, much more information is needed to understand the regulation of Glu uptake in the context of other astrocytic signaling cascades.
Footnotes
- Received November 7, 2018.
- Revision received February 5, 2019.
- Accepted February 19, 2019.
The work of the Grantyn laboratory was supported by the CHDI (Grant A-12467), the German Research Foundation (Grant Exc 257/1), and intramural Charité Research Funds. The development of iGluu in K.T.'s laboratory was funded by Biotechnology and Biological Sciences Research Council Grants BB/M02556X/1 and BB/S003894/1. N.H. is supported by a British Heart Foundation Intermediate Basic Science Research fellowship (FS/17/56/32925). We thank V. Beaumont (CHDI Foundation, Los Angeles), H. Kettenmann (Max Delbrueck Center for Molecular Medicine, Berlin), and S. Hirschberg for helpful discussions; and D. Betances, A. Schönherr, and J. Rösner (all Charité - University Medicine, Berlin) for providing skilled technical assistance.
The authors declare no competing financial interests.
- Correspondence should be addressed to Rosemarie Grantyn at rosemarie.grantyn{at}charite.de
- Copyright © 2019 the authors