Increased entorhinal–prefrontal theta synchronization parallels decreased entorhinal–hippocampal theta synchronization during learning and consolidation of associative memory
- 1 Department of Psychology, University of Toronto, Toronto, ON, Canada
- 2 Department of Cell and Systems Biology, University of Toronto, Toronto, ON, Canada
- 3 Neuroscience Program, University of Toronto, Toronto, ON, Canada
Memories are thought to be encoded as a distributed representation in the neocortex. The medial prefrontal cortex (mPFC) has been shown to support the expression of memories that initially depend on the hippocampus (HPC), yet the mechanisms by which the HPC and mPFC access the distributed representations in the neocortex are unknown. By measuring phase synchronization of local field potential (LFP) oscillations, we found that learning initiated changes in neuronal communication of the HPC and mPFC with the lateral entorhinal cortex (LEC), an area that is connected with many other neocortical regions. LFPs were recorded simultaneously from the three brain regions while rats formed an association between an auditory stimulus (CS) and eyelid stimulation (US) in a trace eyeblink conditioning paradigm, as well as during retention 1 month following learning. Over the course of learning, theta oscillations in the LEC and mPFC became strongly synchronized following presentation of the CS on trials in which rats exhibited a conditioned response (CR), and this strengthened synchronization was also observed during remote retention. In contrast, CS-evoked theta synchronization between the LEC and HPC decreased with learning. Our results suggest that communication between the LEC and mPFC are strengthened with learning whereas the communication between the LEC and HPC are concomitantly weakened, suggesting that enhanced LEC–mPFC communication may be a neuronal correlate for theoretically proposed neocortical reorganization accompanying encoding and consolidation of a memory.
Introduction
The hippocampus (HPC) is necessary to rapidly form associations between elements in an event; however, its importance for the retrieval of an acquired association is time-limited (Scoville and Milner, 1957; Squire, 1992). One paradigm that demonstrates the time-limited involvement of the HPC in memory is trace eyeblink conditioning, in which an animal learns to associate a neutral conditioned stimulus with an unconditioned stimulus (US) separated by a time, or “trace” interval. Accumulating evidence suggests that memory acquisition in trace eyeblink conditioning requires a functional HPC (Solomon et al., 1986; Moyer et al., 1990; Weiss et al., 1999) as well as medial prefrontal cortex (mPFC; Kronforst-Collins and Disterhoft, 1998; Weible et al., 2000; McLaughlin et al., 2002; Takehara-Nishiuchi et al., 2005; Kalmbach et al., 2009). Although the expression of the learned memory association initially requires the HPC (Kim et al., 1995; Takehara et al., 2002, 2003), memory expression later comes to depend on the mPFC (Takehara et al., 2003; Simon et al., 2005; Oswald et al., 2010). Furthermore, the role of the mPFC depends on NMDA-receptor dependent synaptic plasticity during the consolidation period (Takehara-Nishiuchi et al., 2006), and neuronal firing of prefrontal neurons became selective for the acquired association over the same time course (Takehara-Nishiuchi and McNaughton, 2008; Siegel et al., 2011). Modifications of the prefrontal local network through synaptic changes are therefore essential for memory expression to become independent of the HPC.
In addition to the time-limited role of the HPC and the subsequent role of the mPFC for the expression of associative memories, it is widely accepted that a neocortical area surrounding the HPC, the entorhinal cortex, is essential for the consolidation and expression of HPC-dependent memories (Eichenbaum, 2000; Fernandez and Tendolkar, 2006), including the memory acquired in trace eyeblink conditioning (Ryou et al., 2001). The entorhinal cortex is a higher-order cortical association area and consists of two subdivisions, which specifically mediate the connectivity with functionally different sets of cortical and subcortical areas (Kerr et al., 2007). Among them, lateral portions of the entorhinal cortex (LEC) receive stronger inputs from multiple association cortices arriving largely through the perirhinal cortex (Canto et al., 2008; Agster and Burwell, 2009) and are reciprocally connected with the HPC and mPFC (Jones and Witter, 2007; Kerr et al., 2007). In addition, the inactivation of the LEC, but not medial portions of the entorhinal cortex, impairs the retrieval of recently and remotely acquired memory in trace eyeblink conditioning (Morrissey et al., unpublished observation). Together, these findings suggest that the LEC may serve as a gateway of sensory information transfer into the HPC and mPFC, as well as a gateway of pattern-completed memory information from the HPC and mPFC into cortical association areas. We hypothesize that before a memory is consolidated, the LEC relays sensory information to the HPC, but relays information to the mPFC after consolidation has taken place. This hypothesis predicts that consolidation will accompany an increase in the correlated activity between the LEC and mPFC whereas correlated activity between the LEC and HPC will be high prior to memory consolidation.
To test this hypothesis, the present study examined how activity correlations between the LEC, HPC, and mPFC during memory expression change as the memory is formed and consolidated in trace eyeblink conditioning. To acquire the memory in trace eyeblink conditioning, rats need about seven daily training sessions (Takehara-Nishiuchi et al., 2005). Each training session initiates a short (i.e., about 3–4 h) consolidation process, during which de novo protein synthesis (Inda et al., 2005) and the integrity of mPFC (Takehara-Nishiuchi et al., 2005) are necessary to stabilize network changes taking place during the training session. Furthermore, after the memory is acquired, an additional long (i.e., 2–4 weeks) consolidation process further reorganizes the network supporting the memory in a manner such that the memory gradually loses the dependence on the HPC (Kim et al., 1995; Takehara et al., 2003), and in turn gains the dependence on the mPFC (Takehara et al., 2003; Takehara-Nishiuchi et al., 2006). Therefore, changes in the correlated activity during the training session may originate from network modifications during the learning process as well as the consolidation process taking place between training sessions. In addition, the comparison of the correlated activity between the last training session and retention sessions taking place 1 month later provides a measure to detect any changes in the correlated activity that originate from network modifications during the long consolidation process. Building on this notion, we detected correlated activities between the LEC, HPC, and mPFC by simultaneously measuring their local field potentials (LFPs) during learning and later retention in trace eyeblink conditioning. LFPs largely reflect the sum of local synaptic activity within the neighborhood of an electrode (Mitzdorf, 1985; Buzsaki, 2006; Nunez and Srinivasan, 2006), and synchronization of LFP oscillations has been linked to increased communication between regions (Singer, 1993; Varela et al., 2001; Jones and Wilson, 2005; Womelsdorf et al., 2007; Benchenane et al., 2010; Fell and Axmacher, 2011). Synchronization specifically of 4–12 Hz (theta) oscillations has been found to increase between regions when increased communication is thought to take place during memory acquisition (Hoffmann and Berry, 2009; Anderson et al., 2010; Wikgren et al., 2010), memory expression (Seidenbecher et al., 2003), and goal selection (Jones and Wilson, 2005; Benchenane et al., 2010). In the present study, LFP synchronization at theta oscillations was found to be consistent with the hypothesized dynamics of communication between the LEC, mPFC, and HPC.
Results
Synchronization of Theta Oscillations between the LEC, HPC, and MPFC during Acquisition of Associative Memory and Later Retrieval
We recorded local field potentials (LFPs) in the prelimbic region of the medial prefrontal cortex (mPFC), lateral entorhinal cortex (LEC), and dorsal hippocampus (HPC) of rats during trace eyeblink conditioning. The locations of all electrodes were confirmed by histological analysis at the end of experiment (Figure 1).
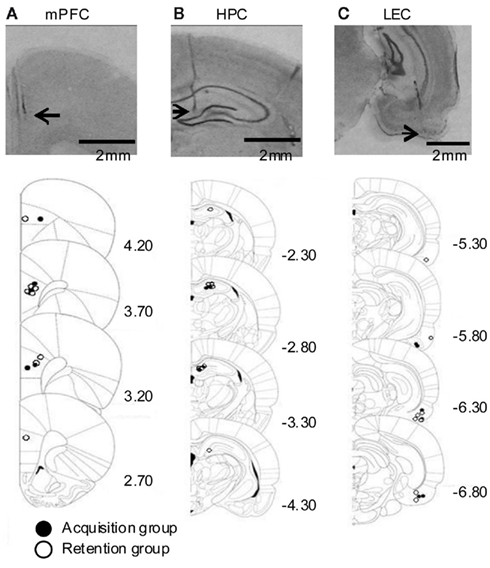
Figure 1. Histological reconstruction of recording locations. (Top) Representative photomicrographs of coronal sections containing the medial prefrontal cortex [mPFC, (A)], dorsal hippocampus [HPC, (B)], and lateral entorhinal cortex [LEC, (C)] from a rat. Arrows indicate the recording locations. (Bottom) Schematic illustration of the location of electrodes. Closed or empty circle indicates a placement in rats whose LFPs were recorded during acquisition sessions or during remote retention sessions, respectively. Numbers to the right indicate stereotaxic coordinates relative to bregma (Paxinos and Watson, 1986).
During the acquisition period, six rats received one session each day for 10 days in a testing chamber, where they were exposed to 100 pairings of a neutral tone (CS) and a mild electric shock to the eyelid (US) separated by a 500-ms stimulus-free trace interval (Acquisition group, Figure 2A). This group was used to examine how correlated activity between the regions change with learning and consolidation processes taking place between training sessions. The remaining eight rats also received 10 days of acquisition sessions, but were followed 1 month later with 5 days of remote retention sessions (Remote retention group). This group was used to examine whether the correlated activity between the regions further changes during a 1-month consolidation period without further training. After acquisition or remote retention sessions, half of the rats in each group received extinction sessions, during which the CS was presented alone. The remaining rats received pseudo-conditioning sessions, where the CS and US were separated by a random time interval (1–20 s). During acquisition sessions, both acquisition and remote retention groups gradually increased the frequency of anticipatory eyeblink responses to the CS (CR, monitored by eyelid electromyogram) over the course of 10 days of acquisition sessions (Figure 2B; Two-way repeated measures ANOVA; Group, F1, 12 = 0.604, p = 0.45; Session, F9, 108 = 9.59, p < 0.001; Group × Session, F9, 108 = 1.17, p = 0.32). When tested 1 month after the last acquisition session, the Remote retention group displayed robust retention of the learned association by exhibiting significantly higher percentage of CRs during the first retention session compared with the first acquisition session (paired t-test, p = 0.01). During extinction and pseudo-conditioning sessions, the percentage of CRs was comparable to the percentage of spontaneous eyeblink frequency, which was measured during an adaptation session prior to the first acquisition session (Paired t-test; extinction vs. adaptation, p = 0.17; pseudo-conditioning vs. adaptation, p = 0.17). During the conditioning, the rats sat quietly in the conditioning chambers. When the rats moved abruptly (detected as significant changes in EMG amplitude, see Materials and Methods) before the beginning of a trial, the trial was removed from further analysis. The number of these “hyperactive” trials was less than about 15 trials during acquisition and remote retention sessions, suggesting that locomotion level did not significantly change over the course of the conditioning sessions.
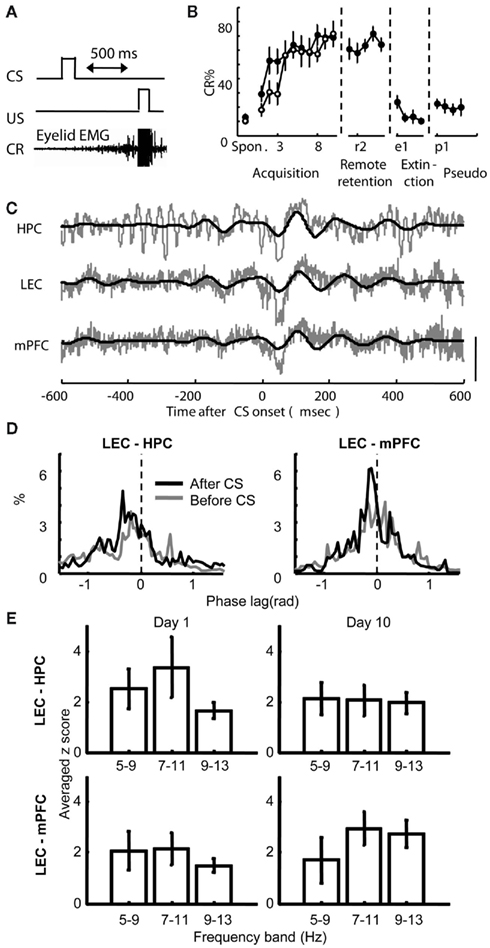
Figure 2. Behavioral performance and theta phase synchronization between the hippocampus (HPC), lateral entorhinal (LEC), and medial prefrontal cortices (mPFC) during trace eyeblink conditioning. (A) An example trial in the trace eyeblink conditioning paradigm. An auditory conditioned stimulus (CS) was paired with eyelid stimulation (US) separated by a 500-ms stimulus-free interval. A conditioned response (CR) was defined as a significant increase in the eyelid electromyogram immediately prior to the US. (B) Percentage of trials in which rats exhibited CRs increased during acquisition sessions (Acquisition group, empty circle, mean ± SEM from six rats), stayed high during remote retention sessions 1 month later (Remote retention group closed circle, mean ± SEM from eight rats), and decreased during extinction and pseudo-conditioning sessions (mean ± SEM from six rats from Acquisition or Remote retention group). Spon. indicates spontaneous eyeblink frequency. (C) Traces of simultaneously recorded local field potentials (LFPs) from the HPC, LEC, and mPFC in a rat during the fifth acquisition session. Raw traces are plotted in gray and theta-filtered traces are overlaid in black. Vertical bar indicates 0.1 mV for the LEC and mPFC and 0.15 mV for the HPC. (D) Representative histograms of the difference in instantaneous theta phase between two regions at 100 ms before CS onset (gray) and at 100 ms after CS onset (black). Phase of theta oscillations in the HPC (left) or mPFC (right) was subtracted from the phase of theta oscillations in the LEC. Narrower peaks in the histogram indicate stronger synchronization of phase between two oscillations. (E) Comparison of the strength of phase synchronization across three different frequency bands. Phase synchronization during the first 200-ms period of CS–US interval was quantified with synchronization index (see Materials and Methods) and normalized with the value before CS onset. Although phase synchronization became stronger after CS onset in three frequency bands (as suggested z-score values larger than or close to 2), synchronization of 7–11 Hz oscillations was the strongest between the HPC and LEC during the first day of acquisition session (Day 1) and between the mPFC and LEC during the last day of acquisition session (Day 10).
LFPs in the LEC, HPC, and mPFC were recorded during acquisition sessions in the Acquisition group and during remote retention sessions in the Remote retention group, as well as during extinction or pseudo-conditioning sessions in both groups. An example of recorded raw LFP traces is depicted in Figure 2C. As previously described (Munera et al., 2001; Paz et al., 2008; Darling et al., 2011), LFPs obtained from the HPC and mPFC showed stronger theta frequency oscillations after CS onset than before. A similar CS-locked increase in theta oscillation was also observed in LFPs in the LEC. To examine whether theta oscillations in these regions synchronized following CS onset, we measured phase synchronization between theta oscillations in simultaneously recorded pairs of LFPs (Lachaux et al., 1999; Fell and Axmacher, 2011; see Materials and Methods). We chose phase synchronization over other methods based on fast Fourier transformation (FFT) because phase synchronization allows for measuring synchronization independently from fluctuations of oscillation amplitude (Le Van Quyen et al., 2001; De Clercq et al., 2003), and because synchronization can be quantified at higher time resolution. Phase synchronization between the LEC and HPC and between the LEC and mPFC became high following CS onset as demonstrated by narrower peaks of the phase difference histogram (Figure 2D). In addition, the peak of phase difference histogram shifted from zero (phase shift), which indicates that two oscillations potentially originated from different sources. To further narrow down the frequency band that most strongly changed after CS onset, the strength of phase synchronization after CS onset was compared across three different frequency bands within the theta frequency band (5–9, 7–11, and 9–13 Hz; Figure 2E). The strength of phase synchronization was quantified with synchronization index (SI, see Materials and Methods) and normalized with the SI value during the period before the CS. Although the difference in the SI value among the three frequency bands was small, the SI values between the LEC and mPFC at 7–11 and 9–13 Hz bands had a tendency to be stronger compared with those at 5–9 Hz band during the last acquisition session (Day 10). Besides, during the first acquisition sessions (Day 1), LEC and HPC oscillations at 7–11 Hz band tended to be stronger than those at 9–13 Hz band. Subsequent analyses, therefore, were applied to the oscillations within 7–11 Hz band.
LEC–mPFC, but not LEC–HPC, Theta Synchronization was Correlated with Successful Expression of Acquired Associations
To examine whether theta phase synchronization changed over the course of learning, temporal patterns of theta phase synchronization was examined session by session with a sliding window technique (see Materials and Methods). Furthermore, we also examined the relationship between theta phase synchronization and the expression of the conditioned response (CR) by comparing theta phase synchronization between trials in which a rat expressed a CR (CR trials) and those in which the rat did not express CR (non-CR trials) in a within-subjects design. The results from this analysis, illustrated in Figure 3, suggested that communication between the LEC and mPFC increased during trials with CR expressions, while communication between the LEC and HPC took place during learning, independent of CR expression.
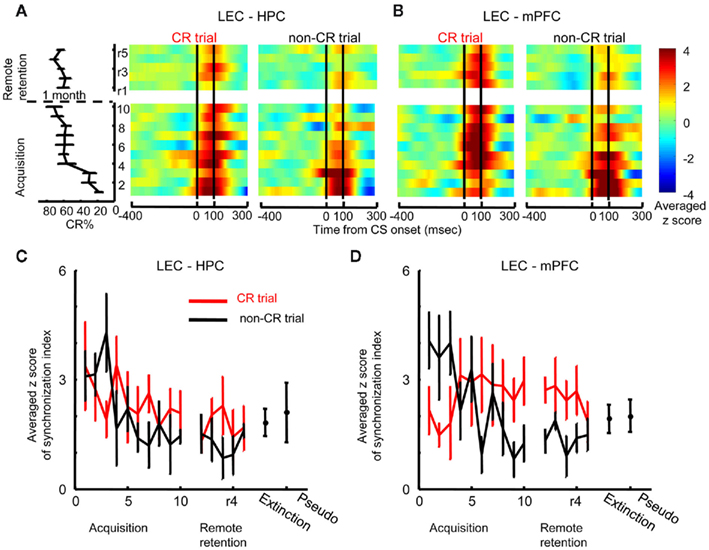
Figure 3. Dissociation of theta synchronization between the hippocampus, lateral entorhinal, and medial prefrontal cortices during learning. (A) Z-score values for theta synchronization upon CS presentation (i.e., change from baseline during an 800-ms window before the CS) were averaged across rats, and plotted over time within trials (x-axis) across days (y-axis, ascending from bottom to top; averaged percent CRs are plotted to the left). During early acquisition, theta synchronization between the hippocampus (HPC) and lateral entorhinal cortex (LEC) increased during trials when the rats expressed the conditioned response (CR, left, CR trials) as well as during trials when the rat did not expressed the CR (right, non-CR trials). Subsequently, theta synchronization decreased in both CR and non-CR trials and remained low during retention sessions 1 month later. (B) Theta synchronization between the LEC and medial prefrontal cortex (mPFC) was higher during non-CR trials (right) than CR trials (left); with training, however, it became stronger in CR trials than in non-CR trials and this strengthened theta synchronization was also observed during remote retention. (C,D) Time-dependent changes in theta synchronization were confirmed by the plots that represent averaged maximum z-score values for theta synchronization during acquisition (mean ± SEM from six rats) and remote retention (mean ± SEM from eight rats). Red and black lines indicate theta synchronization in CR and non-CR trials, respectively. LEC–HPC and LEC–mPFC theta synchronization was weak during extinction and pseudo-conditioning, during which the stimulus contingency was broken.
Theta synchronization between the LEC and HPC increased after CS onset in both CR and non-CR trials during the first acquisition session, but subsequently decreased when rats’ performance reached an asymptotic level and remained low throughout remote retention sessions (Figure 3A). To quantify this observation, the maximum value of the measure for phase synchronization after CS onset (peak SI) was compared between CR trials and non-CR trials across acquisition sessions (Figure 3C). Two-way repeated measures ANOVA on the peak SI showed a significant effect of session (F9, 45 = 2.11, p = 0.048), but no effect of CR expression (F1, 5 = 0.509, p = 0.507) or session × CR expression interaction (F9, 45 = 1.540, p = 0.163). Similarly, two-way repeated measures ANOVA on the peak SI during remote retention sessions showed no effect of session (F4, 28 = 0.343, p = 0.847), CR expression (F1, 7 = 1.474, p = 0.264), or session × CR expression interaction (F4, 28 = 0.682, p = 0.610). The averaged peak SI in CR trials during the first three acquisition sessions did not significantly differ from the averaged peak SI during sessions in which the stimulus contingency was broken (the data during extinction and pseudo-conditioning in the Acquisition group were pooled to increase the statistical power, Paired t-test, p = 0.073). This suggests that LEC–HPC theta synchronization did not signal the successful expression of CRs.
In contrast to the decreases observed in LEC–HPC theta synchronization over sessions, LEC–mPFC theta synchronization remained high during late acquisition and remote retention sessions (Figure 3B). During early acquisition, LEC–mPFC theta synchronization was higher during non-CR trials compared with CR trials. As the rats acquired the CRs, this pattern reversed: stronger LEC–mPFC synchronization became consistently observed on CR trials compared with non-CR trials. This pattern persisted for remote retention sessions. Two-way repeated measures ANOVA on the peak SI value (Figure 3D) showed a significant session × CR expression interaction during acquisition sessions (F9, 45 = 2.723, p = 0.013) and a significant effect of CR expression during remote retention sessions (F1, 7 = 12.624, p = 0.009). Furthermore, the peak SI value in CR trials during the final three acquisition sessions or remote retention sessions was higher than that during extinction sessions (the pooled data in the Acquisition and Remote retention groups; Paired t-test, p = 0.049) while it was not significantly different from that during pseudo-conditioning sessions (the pooled data in the Acquisition and Remote retention groups; Paired t-test, p = 0.067). These results suggest that the strength of LEC–PFC theta synchronization was positively correlated with the expression of CRs.
We also found that theta oscillations in the HPC and mPFC synchronized after CS onset; however, HPC–mPFC theta synchronization did not change as a function of learning and did not clearly differentiate between CR trials and non-CR trials (data not shown).
Theta amplitude in the LEC and mPFC, but not HPC, increased with learning
Changes in theta phase synchronization between two regions most likely resulted from changes in amplitude and/or phase of theta oscillations in each region. We first compared local theta amplitude between CR trials and non-CR trials session by session in each region (Figures 4A–C). During early acquisition, LEC theta amplitude increased at CS onset both during CR and non-CR trials; however, theta amplitude during CR trials subsequently increased, whereas theta amplitude during non-CR trials gradually decreased (Figure 4A). Stronger theta amplitude was also observed in CR trials compared with non-CR trials during remote retention sessions. To quantify these observations, we calculated the maximum value of theta amplitude after CS onset (peak amplitude) in each session and compared it between CR trials and non-CR trials. A two-way repeated measures ANOVA on the peak LEC theta amplitude showed a significant interaction between sessions and CR expression (F9, 45 = 2.445, p = 0.023; Figure 4D) during acquisition and a significant effect of CR expression (F1, 7 = 13.924, p = 0.007) during remote retention sessions. The averaged peak amplitude of LEC theta in CR trials during the last three acquisition sessions or remote retention sessions was not significantly different from that during pseudo-conditioning (the pooled data in the Acquisition and Remote retention groups; Paired t-test, p = 0.075) or during extinction (the pooled data in the Acquisition and Remote retention groups; Paired t-test, p = 0.486).
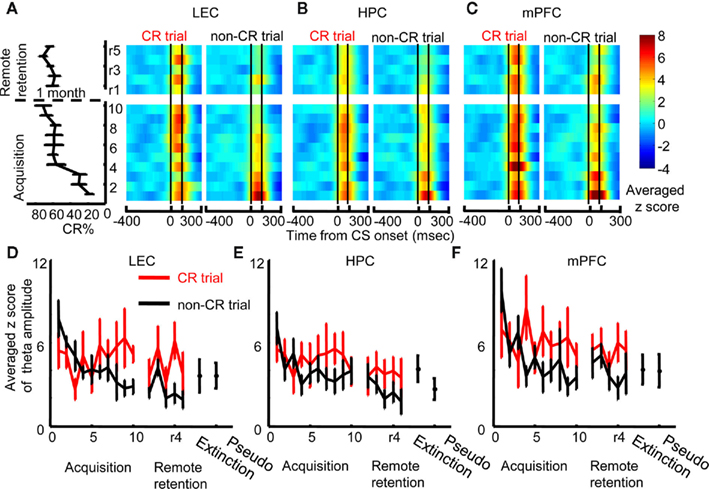
Figure 4. Changes in local theta amplitude with learning and the correlation between theta amplitude and behavior. (A) Z-score values for theta amplitude upon CS presentation (i.e., change from baseline during an 800-ms window before CS onset) were averaged across rats, and plotted over time within trials (x-axis) across days (y-axis, ascending from bottom to top; averaged percent CRs are plotted to the left). During early acquisition, theta amplitude in the lateral entorhinal cortex (LEC) increased after CS onset in trials when the rats expressed the conditioned response (CR, left, CR trials) as well as in trials when rats did not express the CR (right, non-CR trials). During the remaining acquisition sessions, CS-evoked increase in theta amplitude became stronger in CR trials and weaker in non-CR trials. (B) In contrast, CS-evoked increase in theta amplitude in the hippocampus (HPC) decreased with learning and did not differ between CR trials (left) and non-CR trials (right). (C) In the medial prefrontal cortex (mPFC), CS-evoked increase in theta amplitude was high in CR trials as well as non-CR trials. Subsequently, theta amplitude stayed high in CR trials and decreased in non-CR trials. (D–F) Time-dependent changes in theta amplitude were confirmed by plots representing the averaged maximum z-score values for theta amplitude during acquisition (mean ± SEM from six rats) and remote retention (mean ± SEM from eight rats). Red and black lines indicate theta amplitude in CR and non-CR trials, respectively. CS-evoked increase in theta amplitude in the LEC and mPFC, but not HPC, was relatively weak during extinction and pseudo-conditioning, during which the stimulus contingency was broken.
The amplitude of HPC theta oscillations was high during acquisition, but low during remote retention sessions (Figure 4B). The peak theta amplitude did not differ between CR trials and non-CR trials during acquisition or during remote retention sessions (Figure 4E, Two-way repeated measures ANOVA; no effect of sessions, F9, 45 = 1.450, p = 0.196, F4, 28 = 0.37, p = 0.826; no effect of CR expression, F1, 5 = 1.655, p = 0.255, F1, 7 = 2.907, p = 0.132; no sessions × CR expression interaction, F9, 45 = 1.334, p = 0.247, F4, 28 = 0.583, p = 0.677 during acquisition and remote retention sessions, respectively). Peak HPC theta amplitude in CR trials during the first three acquisition sessions was not significantly different from HPC theta amplitude during extinction or pseudo-conditioning sessions (the data during extinction and pseudo-conditioning sessions in Acquisition group were pooled to increase the statistical power; Paired t-test, p = 0.058).
The amplitude of mPFC theta oscillations was high during the first acquisition session and remained high during the rest of acquisition and remote retention sessions (Figure 4C). During early acquisition, theta amplitude during CR trials was similar to that in non-CR trials; however, with subsequent conditioning theta amplitude in non-CR trials gradually decreased whereas theta amplitude in CR trials stayed high (Figure 4F, Two-way repeated measures ANOVA on peak theta amplitude of mPFC theta; a significant session × CR expression interaction during acquisition, F9, 45 = 3.517, p = 0.002). There was a trend that theta amplitude was stronger in CR trials than in non-CR trials during remote retention sessions (CR expression, F1, 7 = 5.458, p = 0.052). In addition, the averaged mPFC theta amplitude in CR trials during the last three acquisition sessions or remote retention sessions was higher than that during pseudo-conditioning (the pooled data in the Acquisition and Remote retention groups; Paired t-test, p = 0.038), but it was not different from that during extinction (the pooled data in the Acquisition and Remote retention groups; Paired t-test, p = 0.370).
The CS-Induced the Resetting of Ongoing Phase of Theta Oscillations
Next, we analyzed how the phase of local theta oscillations was modulated by CS presentation. Following CS presentation, theta phase became highly consistent across trials in each of the three regions examined (Figure 5A Top). Theta signals then became strongly entrained for roughly two theta cycles (Figure 5A bottom middle and right). To quantify the magnitude of phase locking, we calculated the length of the resultant vectors of phase across trials, which becomes 1 when the phase is identical across all trials and 0 when the phase is random across trials. The resultant vector length was separately calculated in CR trials and non-CR trials at 100 ms before and 100 ms after CS onset in each session. The result was averaged across each stage of acquisition and retention sessions (Early, acquisition sessions 1–3; Late, acquisition sessions 4–7; Overtraining, acquisition sessions 8–10; Remote retention, retention sessions 1–5) and then averaged across rats (Figure 5B). In all of the three regions, phase concentration increased after CS onset in all stages (Three-way repeated measures ANOVA; CS, p < 0.001 in all three regions) and this increase was stronger in CR trials than in non-CR trials (CS × CR expression interaction, p < 0.05 in all three regions). Unexpectedly, the phase concentration before CS onset was stronger in CR trials than in non-CR trials during early acquisition, but this “anticipatory” phase locking disappeared during later stages (CS × CR expression × Stage interaction, p < 0.05 in LEC and mPFC, CR expression × Stage interaction, p < 0.05 in HPC).
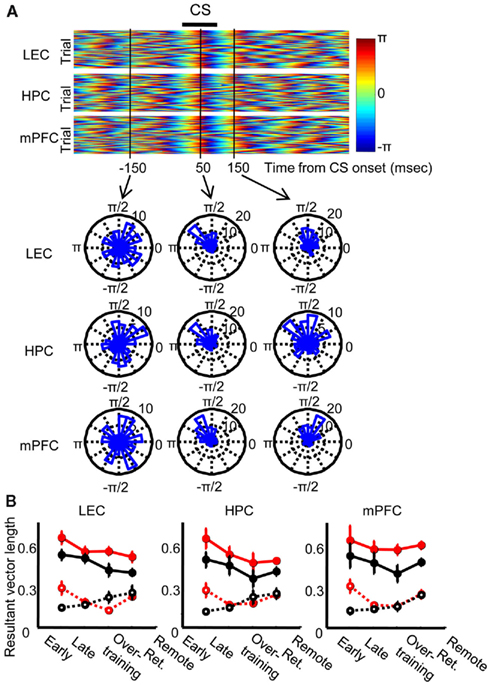
Figure 5. Theta phase locking to the conditioned stimulus. (A) A representative pseudo-color scale representation of instantaneous theta phase in each trial, which was aligned at CS onset. Theta oscillations in the lateral entorhinal cortex (LEC, top), dorsal hippocampus (HPC, middle), and medial prefrontal cortex (mPFC, bottom) were locked to the CS and subsequently entrained for about two oscillation cycles. Phase distribution across trials was random at 150 ms before CS onset (left), but it was strongly concentrated at 50 and 150 ms after CS onset (middle and right). (B) Degree of phase concentration was quantified by using the length of resultant vector for instantaneous phase across trials during which rats showed CRs (CR trials, red, mean ± SEM) or trials during which no CR was expressed (non-CR trials, black, mean ± SEM). In both CR and non-CR trials, phase entrainment became stronger after CS onset (solid line) than before CS onset (dotted line) in all stages (Early, the first-third acquisition session, six rats; Late, the forth to seventh acquisition session, six rats; Overtraining, the eighth to tenth acquisition session, six rats; Remote Ret., five retention sessions 1 month later, eight rats) in all three regions.
As suggested by the strong phase resetting, all three regions showed evoked potentials after CS onset. The waveform patterns of the evoked potentials did not significantly differ between CR trials and non-CR trials and did not generally change across days (data not shown).
Synchronization was Induced by the Resetting of Theta Phase to the CS and was Amplified by a CS-Evoked Increase in Amplitude
Lastly, to address how changes in amplitude and phase of theta oscillations in the three regions (Figures 4 and 5) contribute to changes in theta phase synchronization between the regions (Figure 3), we ran the same analyses on a number of simulations in which phase and amplitude of the LFP signals were manually adjusted (Figure 6). Single trial LFP data (n = 100) were comprised of 10 sinusoids with random (initial) phase and random frequencies in the 4- to 16-Hz range (Control). An event-related increase in amplitude and/or phase reset was imposed at a specific point in time (set to time = 0, jittered ± 5 ms) in the wide band range (4–16 Hz) or the theta band range (7–11 Hz, Figure 6A). As expected, phase synchronization did not change following an increase in oscillation amplitude in either frequency band (Figure 6B, left), whereas phase synchronization strongly increased following the resetting of ongoing oscillations in the theta, but not wide band range (middle). Synchronization was the strongest when the phase reset coincided with an increase in oscillation amplitude (right). These observations were confirmed by a significant difference in the maximum value of the synchronization measure (Figure 6C) between the control condition, theta phase reset alone, and the combination of theta phase reset and amplitude increase (Tukey HSD, all p < 0.001). Together, these simulation results suggest that theta phase reset, but not an increase in theta amplitude, can induce theta synchronization, whereas an increase in theta amplitude can amplify theta synchronization if it occurs along with theta phase reset.
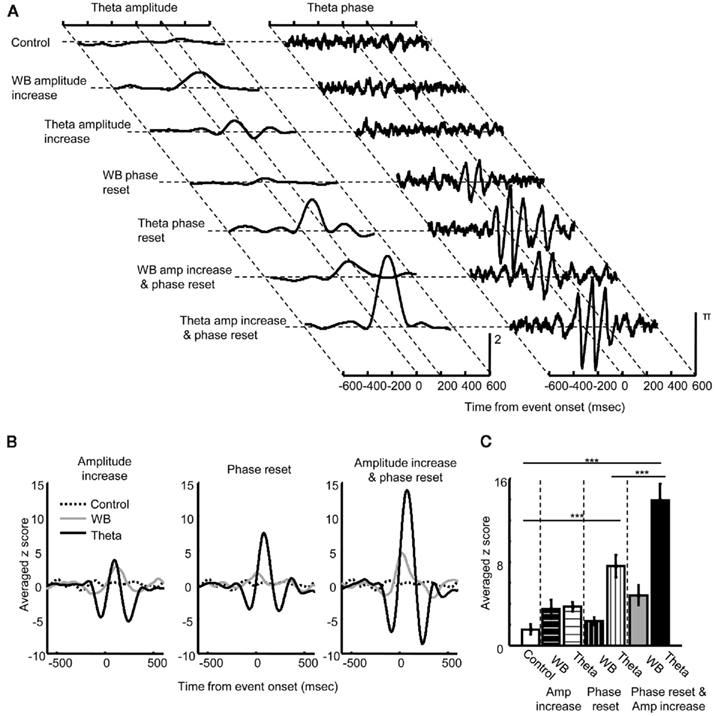
Figure 6. Results of simulations demonstrating the link between changes in local theta oscillations and theta phase synchronization. (A) Theta amplitude (left) and phase (right) of simulated LFP signals. When an event-related increase in amplitude occurred at time 0 for the wide band (4–16 Hz, WB) or theta band range (7–11 Hz, Theta in Amplitude increase), theta amplitude increased while theta phase did not change. When phase reset occurred at time 0 for the wide band range (WB) or only for theta band range (Theta in Phase reset), theta phase was strongly entrained in parallel with an increase in amplitude. When phase reset coincided with amplitude increase for the wide band (WD) or theta band range (Theta in Amp increase and phase reset), an increase in theta amplitude was augmented while degree of phase entrainment remained unchanged. (B) Effect of amplitude increase and phase reset on theta phase synchronization. An increase in amplitude in the wide (gray) or theta band range (black) did not affect theta synchronization (left). In contrast, phase reset of theta oscillation (black), but not wide band oscillation (gray) induced theta synchronization (middle). Coincidence of phase reset and amplitude increase induced a large increase in theta synchronization (right, black). (C) The peak value of the normalized measure for theta synchronization (mean ± SEM from eight simulations) was compared across different types of manipulation. Theta phase reset alone (Theta in Phase reset) and the coincidence of theta phase reset and amplitude increase (Theta in Amp increase and phase reset) produced significantly stronger theta synchronization compared with a control without any manipulation of phase or amplitude (Control). The coincidence of theta phase reset and amplitude increase produced stronger theta synchronization than theta phase reset alone. ***Indicates p < 0.001 in Tukey HSD test.
Discussion
Accumulating evidence suggests that memories for daily events are mediated by a distributed cortical network and that this network reorganizes as the memory ages (Squire, 1992; Takehara et al., 2003; Frankland and Bontempi, 2005). Our results demonstrated that this reorganization may be directly reflected in dissociated patterns of interaction between the lateral entorhinal cortex (LEC), dorsal hippocampus (HPC), and medial prefrontal cortex (mPFC) during learning and later retention of associative memory. By using phase synchronization of local field potential (LFP) oscillations as a measure for neuronal communication between two regions, we found that as the rats formed an association between a neutral tone (CS) and aversive eyelid stimulation (US), theta oscillations in the LEC and mPFC became strongly synchronized following CS presentation upon successful expression of the CR whereas synchronization of theta oscillations between the LEC and HPC gradually weakened. These results suggest that LEC–HPC communication may play a modulatory role in initial learning whereas the LEC–mPFC communication may play an essential role in the expression of acquired memory.
Synchronization of oscillatory neuronal activities across different brain regions is widely observed during many cognitive processes including the acquisition and retrieval of associative memory in animals and humans (Seidenbecher et al., 2003; Paz et al., 2008; Hoffmann and Berry, 2009; Anderson et al., 2010; Wikgren et al., 2010) and has been linked to a transient coupling of separate processes operating in two brain regions (Varela et al., 2001; Fell and Axmacher, 2011). The observed theta phase synchronization between the LEC, mPFC, and HPC revealed time windows during which these regions communicate to form and express associative memory. During 10 days of acquisition sessions mPFC–LEC theta synchronization was gradually strengthened and was correlated with successful CR expression while HPC–LEC theta synchronization was gradually weakened (Figure 3). Importantly, these changes in synchronization were detected as repeated observations within the same animals, supporting a link between strengthening in LEC–mPFC theta synchronization and network modifications taking place during learning processes and consolidation processes between training sessions. Furthermore, the strengthened LEC–mPFC theta synchronization was also observed during retention sessions 1 month after learning. This suggests that LEC–mPFC communication remained high, but was not further strengthened, during a 1-month period of consolidation after learning. The latter finding was unexpected in light of an increase in the reliance on memory expression on the mPFC (Takehara et al., 2003; Takehara-Nishiuchi et al., 2006) and a gradual development of prefrontal neuron firings selective for the acquired memory (Takehara-Nishiuchi and McNaughton, 2008) during the 1-month consolidation period. This might suggest a possibility that strengthening of LEC–mPFC communication may precede and assist subsequent changes in prefrontal neuronal firings. Another finding is that although CR expression significantly decreased during extinction and pseudo-conditioning sessions (Figure 2B), theta synchronization during these sessions did not always become significantly lower than that during acquisition or remote retention (Figures 3C,D). This may be because extinction and pseudo-conditioning sessions took place after acquisition and remote retention sessions in the present experiment.
One might argue that an apparent increase in theta synchronization between two regions could have originated from changes in an electrical field in remote areas that were conducted through the volume of neural tissue or from signals in the reference electrode. These possibilities were not likely to play a major role in the observed synchronization because phase shift was observed between regions (Figure 2D), and because amplitude of theta oscillations in the three regions fluctuated in different patterns across sessions (Figure 4). If the recorded signals were heavily contaminated with signals that originated from common sources, these results would not be possible because the signals from common sources would appear on the signals from three electrodes in the same manner. It is still possible that apparent differences in oscillations between regions are attributed to several generators with dipoles of different orientation and distance, which potentially made a volume conducted signal shift phase across regions (Sirota et al., 2008). However, phase locking of local neuronal firings to local theta oscillations (Alonso and Garcia-Austt, 1987a,b; Paz et al., 2008) provides support for the view that the detected theta oscillations and their synchronization have relevance to local neuronal processing at the recording sites. Another possibility is that CS-locked increase in theta synchronization was induced by eyelid movement (i.e., generation of CRs). This possibility is unlikely because the stronger synchronization was not always associated with CR expression: the strength of LEC–HPC theta synchronization did not differ whether or not the rats expressed CRs (Figure 3A), and LEC–mPFC synchronization was stronger when the rats did not express CRs (i.e., non-CR trials) compared with when the rats expressed CRs during the early stage of acquisition (i.e., CR trials; Figure 3B).
In parallel with CS-induced changes in theta phase synchronization between the LEC, HPC, and mPFC (Figure 3), amplitude and phase of local theta oscillation were also modulated upon CS presentation. Theta amplitude and phase in the three regions changed in a different manner over the course of acquisition sessions (Figures 4 and 5), and our simulation results (Figure 6) suggest that these changes in local theta oscillations may result in the difference in the time course and selectivity for CR expression between LEC–mPFC and LEC–HPC theta phase synchronization (Figure 6). Initial non-specific increase in LEC–mPFC and LEC–HPC theta synchronization following CS presentation can be induced by the phase resetting of theta oscillations to the CS in all three regions (Figures 5 and 6). Although theta phase reset did not become stronger on trials with CR expression during late acquisition and remote retention (Figure 5), theta amplitude in the LEC and mPFC became correlated with CR expression (Figure 4). Consequently, phase reset coincided with a stronger increase in theta amplitude on CR trials, which can result in stronger LEC–mPFC theta synchronization on these trials (Figure 6). On the contrary, HPC theta amplitude did not become correlated with CR expression over the course of learning (Figures 4B,E). This explains the lack of correlation between LEC–HPC theta synchronization and CR expression (Figures 3A,C).
It is worth noting that the degree of phase concentration before CS onset was stronger in CR trials than in non-CR trials during the early stage of acquisition sessions (Figure 5B). This result suggests a possibility that during early acquisition animals preferentially expressed CRs when strong theta oscillations were induced by factors other than the CS, such as a high state of arousal, before CS onset (Berry and Thompson, 1978; Sainsbury et al., 1987; Berry and Swain, 1989). Consistent with this possibility, previous studies showed that acquisition of CRs is facilitated when CS–US pairings are presented contingent on strong theta oscillations in the HPC in rabbits (Seager et al., 2002; Griffin et al., 2004; Darling et al., 2011). Alternatively, one may argue that some sort of preparation signals for eyelid movement in a motor system is capable of inducing phase resetting in the three regions and in turn synchronizing theta oscillations between them. This possibility is unlikely because the stronger phase concentration before CS onset was correlated with CR expression during the early, but not late, stage of acquisition sessions (Figure 5B).
Established theory of consolidation holds that elements or contents of each experience are encoded in distributed areas of the neocortex, and the HPC stores a memory index (or pointer) for a unique array of neocortical areas representing each experiential event (Teyler and DiScenna, 1986; McClelland et al., 1995; Squire and Alvarez, 1995; Rudy and O’Reilly, 2001). Subsequently, direct connections between areas in the neocortex are gradually formed, rendering the memory trace independent from HPC output (McClelland et al., 1995; Squire and Alvarez, 1995). Alternatively, a newly emerging view posits that the mPFC may take over the binding function from the HPC by storing a similar, but perhaps more efficient index code (Frankland and Bontempi, 2005; Takashima et al., 2006; Takehara-Nishiuchi and McNaughton, 2008). The present results elaborate on this view by proposing that the mPFC may serve the binding function through its communication with the entorhinal cortex. After communication between the entorhinal cortex and mPFC is strengthened, the entorhinal cortex relays cue information from the neocortex (Young et al., 1997) directly to the mPFC. This may recover a pattern of prefrontal neuronal firing selective for a previously acquired memory (Takehara-Nishiuchi and McNaughton, 2008). The recovered prefrontal firings then act back on the entorhinal cortex via back projections, and in turn reactivate a unique array of neocortical areas representing the corresponding memory. Although this idea does not eliminate the possibility that connections between other neocortical areas, such as orbitofrontal (Ross and Eichenbaum, 2006; Lesburgueres et al., 2011) and sensory cortices (Galvez et al., 2006; Miller et al., 2008; Sacco and Sacchetti, 2010), are also formed during consolidation, it emphasizes that strengthening of communication between neurons in the mPFC and entorhinal cortex is a key biological change that allows for the neocortical network to gain independence from the HPC. Consistent with this idea, consolidation requires several molecular processes in the mPFC and entorhinal cortex, which lead to strengthening of synaptic connections, including integrity of NMDA-receptor function (Takehara-Nishiuchi et al., 2006), an increase in spine density (Maviel et al., 2004; Restivo et al., 2009; Vetere et al., 2011), and the appropriate level of CaMKII activity (Yasuda and Mayford, 2006).
In conclusion, dissociated communication patterns of the LEC with HPC and mPFC provides correlational evidence for a possibility that strengthening of entorhinal–prefrontal connections plays an important role in theoretically proposed reorganization of cortical networks during memory consolidation.
Materials and Methods
Subjects
Twenty-two male Long–Evans rats (3 months old at the time of the first surgery, 385–485 g, Charles River, Montreal) were housed in Plexiglas home cages and maintained on a reversed 24 h light/dark cycle. Water and food were available ad libitum. All experiments were performed in accordance with the guidelines established by the Institutional Animal Care Committee at the University of Toronto. Every effort was made to optimize comfort and to minimize the use of animals.
Groups and Design of Experiments
Twenty-two rats were divided into two groups. The first group (Acquisition group, n = 9) received behavioral training in the trace eyeblink conditioning for 10 days, during which local field potentials (LFPs) were recorded in the hippocampus, lateral entorhinal, and medial prefrontal cortices. The second group (Remote retention group, n = 13) received behavioral training for 10 days and received the retention sessions 1 month after the last training session. LFPs in the three regions were recorded during retention sessions. The Acquisition group was used to detect changes in LFPs as animals acquire memory. The Remote retention group was used to examine whether any additional changes in LFPs occur during a subsequent consolidation period, during which the acquired memory shifts its dependence from the hippocampus to the medial prefrontal cortex (Takehara et al., 2003; Takehara-Nishiuchi et al., 2006). Using the same design, we detected lasting changes in prefrontal neuronal firing during the consolidation period without continued training (Takehara-Nishiuchi and McNaughton, 2008).
Surgery and Electrode Placement
Each rat was anesthetized with isoflurane (1–1.5% by volume in oxygen at a flow rate of 1.5 L/min; Holocarbon Laboratories, River Edge, NJ, USA), placed in a stereotaxic holder, and injected with ketoprofen (5 mg/kg, s.c.; Phoenix Scientific, Fort Dodge, IA, USA). Four Teflon-coated stainless steel wires (No. 791000; A-M Systems, Carlsborg, WA, USA) were implanted subcutaneously in the left upper eyelid for recording electromyogram (EMG) activity and presenting a periorbital shock in the same way as in a previous study (Takehara et al., 2003). Craniotomy was opened over the mPFC (PFC, 3.2 mm anterior, 0.7 mm lateral to bregma), dorsal hippocampus (HPC, 2.8 mm posterior and 1.4 mm lateral to bregma), and LEC (6.3 mm anterior and 4.7 mm lateral to bregma) contralateral (right) to the conditioned eye. Electrodes to record LFPs were fabricated by inserting a short piece of stainless steel wires (No. 791000; A-M Systems, Carlsborg, WA, USA) into a 28-G stainless steel cannula. After the dura was cut, an electrode was slowly lowered to 4.0 mm (mPFC) or 2.8 mm (HPC) from bregma. For the LEC, an electrode was tilted at 10° in the medial–lateral axis and slowly lowered to 8.2 mm from bregma. Additional craniotomy was opened over the right cerebellar cortex, and a screw electrode (stainless steel) was implanted on the surface of the right cerebellar cortex. Nine rats (Acquisition group) received the implantation of EEG and EMG electrodes. Thirteen rats (Remote retention group) received two surgeries: an EMG electrode was implanted during the first surgery, and a new EMG electrode and LFP electrodes were implanted during the second surgery. The second surgery was inevitable to record the good quality of EMG and LFPs during the retention session 1 month after the last acquisition session because the EMG and LFPs electrodes typically lasted only for about 3 weeks after the surgery.
Behavioral Procedure
The rats received daily trace eyeblink conditioning in cylindrical Plexiglas containers (20 cm in diameter and 25 cm high) that were placed in sound- and light-attenuated chambers (35 cm × 35 cm × 40 cm, Med Associates, St. Albans, VA, USA). A lightweight cable was connected to the connector pins secured on the animal’s head. The conditioned stimulus (CS) was a 100-ms tone (2.5 kHz, 85 dB) with a rise–fall time of 10 ms, and it was delivered from a speaker (16.5 cm in diameter) placed above the container. The US was a 100-ms periorbital shock (0.3–3.0 mA, 100 Hz square pulses), delivered through a pair of electrodes that were implanted in the left upper eyelid. The stimulus intensity was carefully calibrated to give the minimal current required to elicit an eyeblink/head-turn response and was adjusted daily. The animals’ head-turn response was monitored by live video during the conditioning. A stimulus-free trace interval of 500 ms was interposed between the end of the CS and the US onset. The CR was defined as an eyeblink response during the 200-ms period before the US onset, and was monitored through electromyographic (EMG) activity recorded with another pair of implanted electrodes. The conditioning started at least 1 week after the surgery to allow rats time for recovery. During the first 2 days of conditioning, the CS and US were not presented to allow the rats adapt to the conditioning procedure and environment. From the third day of recording, the CS and US were paired. A daily session consisted of 100 trials grouped into 10 blocks, which included nine CS–US paired trials followed by one CS-alone trial. The intervals of the trials were pseudo-randomized between 20 and 40 s, resulting in a mean of 30 s. The conditioning sessions continued until the 12th day for a total of 10 conditioning days. One month after the last acquisition session, retention of the acquired memory was measured by re-conditioning the rats in the same procedure as during acquisition sessions. Following acquisition or retention sessions, rats received 4 days of extinction sessions or 4 days of pseudo-conditioning sessions. Extinction sessions consisted of presentations of the CS-alone without the US, whereas during pseudo-conditioning sessions the CS and US were paired with a pseudo-randomized interval from 1 to 20 s. In the Acquisition group, behavior and neuronal activity were recorded during acquisition and extinction or pseudo-conditioning sessions. In the Remote retention group, behavior was recorded during acquisition sessions, and behavior and neuronal activity were recorded during retention and extinction or pseudo-conditioning sessions.
Data Acquisition
Local field potentials were measured as the voltage difference between a mono-polar (single tip) electrode and a ground screw placed above the cerebellar cortex, as opposed to the voltage difference between two electrode tips of a bi-polar electrode to avoid the possibility that LFP signals relevant for cortical communication would be subtracted-out (Paz et al., 2008). LFPs and electromyographic (EMG) activity were recorded using a RZ-5 recording system (Tucker-Davis Technologies, Alachua, FL, USA). LFP was amplified by 1000 times, filtered between 1 and 400 Hz, and digitized at 2 kHz. EMG activity of the eyelid was filtered between 0.3 and 3 kHz and digitized at 6 kHz.
EMG Analysis
All of the analyses were performed using custom codes written in Matlab (Mathworks, Natick, MA, USA). The method of analysis of the EMG data was the same as in a previous study (Takehara et al., 2003). Briefly, the instantaneous EMG amplitude was defined as the difference between the minimum and maximum EMG signal in a 1-ms window. Noise was removed from the EMG amplitude by subtracting the across-trial mean, plus one SD, of the amplitude during a 300-ms period before the CS onset. All trials in which the pre-CS EMG amplitude exceeded the noise level by an additional 30% of this noise level were excluded from further analyses. A trial was defined as containing a CR if the EMG amplitude during a 200-ms window prior to the US (CR amplitude) exceeded five times the pre-CS amplitude (in the case that the pre-CS amplitude was zero, CR amplitude had to be 10% greater than the noise level). The CR percent was defined as the ratio of the number of trials containing the CR to the total number of valid trials in each session.
Local Field Potential Analysis
All of the analyses were performed using custom codes written in Matlab (Mathworks, Natick, MA, USA). Both trials with pairing of the CS and US and trials with the presentation of CS-alone were analyzed and the results were pooled.
Pre-processing
To remove trials with movement artifact, a threshold was defined as the across-trial mean, plus four SD, of the raw LFP signals during a 500-ms period before CS onset. This threshold was selected based on visual inspection of several data sets. All trials in which the LFP signal during a 500-ms period before CS onset exceeded this threshold were excluded from further analyses. Subsequently, the power spectrum density was calculated to ensure that the shape of power spectrum agreed with those reported in previous studies (Munera et al., 2001; Paz et al., 2008; Deshmukh et al., 2010). If the power spectrum consistently contained a large peak at 60 Hz, we assumed connection failure and did not use the data for further analysis (n = 1 in the Acquisition group and n = 2 in the Remote retention group).
Phase synchronization
Phase synchronization computes the difference in the phase of an oscillation of a particular frequency between two regions (Varela et al., 2001). We chose phase synchronization over other methods based on FFT because phase synchronization allows for measuring synchronization independently from fluctuations of oscillation amplitude (Le Van Quyen et al., 2001; De Clercq et al., 2003), and because synchronization can be quantified at higher time resolution. The latter point is critical for the analysis of recording data during the trace eyeblink conditioning paradigm because the duration of each trial is less than 1 sec (100 ms for the CS and 500 ms for the interval between the CS and US). Recorded LFPs were first filtered between 7 and 11 Hz using Chebyshev2 filters. The selection of 7–11 Hz for theta oscillation rather than a lower or higher frequency band was made based on the strongest synchronization of 7–11 Hz oscillations upon CS onset among the neighboring frequency bands (Figure 2E). In each trial, the instantaneous amplitude and phase time series of a filtered signal were computed from the Hilbert transform. Phase synchronization is defined as locking of the phases of two oscillations:

The present study only examined the case when n = m = 1. To quantify the degree of phase locking, we used the SI defined as
where 1/Δt is the sampling rate of the discrete time series of the signal (De Clercq et al., 2003). By construction, SI will be 0 if the difference in phases of two signals are random and will be 1 when the difference of phases of two signals is constant during a short period of time. SI was calculated in a series of 200-ms windows with an increment of 0.5 ms. SIs were first averaged across trials in a rat. The averaged SI was normalized by subtracting the mean and dividing by the SD of SIs during an 800-ms period before the CS onset. These normalized SIs were averaged across rats. These analyses made it possible to calculate instantaneous amplitude and phase at resolution of 0.5 ms (equal to the sampling rate) and the SI at resolution of 200 ms.
CS-evoked change in theta amplitude
The instantaneous amplitude of theta oscillations was averaged across trials in each rat. The averaged amplitude was subsequently normalized by subtracting the mean and dividing by the SD of the amplitude during an 800-ms period before the CS onset. The normalized amplitude values were then averaged across rats.
Resetting of theta phase to the CS
The instantaneous phase of theta oscillations was computed from a filtered signal in each trial at −100 and 100 ms after CS onset. Degree of phase concentration was quantified by calculating the resultant vector length for phase across trials in each rat. The value was then averaged across rats.
Simulations
To generate LFP signals and to modify their amplitude and phase, we used similar algorithms to those reported previously (Makinen et al., 2005; Klimesch et al., 2009). Single trial EEG data (n = 100) were composites of 10 sinusoids with random (initial) phase and random frequencies in the 4- to 16-Hz range. An event-related increase in amplitude and/or phase reset was imposed at a specific point in time (set to time = 0, jittered ± 5 ms) in the wide band range (4–16 Hz) or the theta band range (7–11 Hz). To simulate an increase in oscillation amplitude, the amplitude of five sinusoids was increased to a random value in the range of 110 and 300% for 200 ms. To simulate phase reset, the phase of five sinusoids was shifted to zero. To measure the amplitude and phase of theta oscillations (7–11 Hz), the simulated data were analyzed with the same method of analyses that was used for the real data (see CS-Evoked Change in Theta Amplitude and Resetting of Theta Phase to CS Onset). To examine the effect of modulation of amplitude and phase on theta phase synchronization, two sets of signals (n = 100) were independently generated by introducing the same type of manipulation (amplitude increase alone, phase reset alone, and a combination of amplitude increase and phase reset). Theta phase synchronization was calculated with the same method that was used for the real data (see Phase Synchronization). These steps were repeated eight times, matching the sample size of the real data. The SI was first averaged across simulated data sets (n = 100). The averaged SI was then normalized by subtracting the mean and dividing by the SD of SIs during a 400-ms period before the CS onset. These normalized SIs were averaged across repetitions (n = 8).
Statistical Analysis
Statistical analysis of electrophysiological and behavioral data were carried out with two-way or three-way repeated measures ANOVA, one-way ANOVA, or paired t-tests, as applicable, using SPSS software (SPSS Inc., Chicago, IL, USA). For all tests the criterion for significance was kept at p < 0.05. All data were depicted with mean ± SEM.
Histology
After all recordings were complete, the rats were deeply anesthetized and the tips of the recording electrodes were marked by electrolytic lesions (20 μA for 45 s, positive to electrode, negative to animal ground). Each animal was intraperitoneally injected with an excess amount of sodium pentobarbital and perfused intracardially with 0.9% saline, followed by phosphate-buffered 10% formalin. The brain was removed from the skull and stored in 10% formalin for a few days. After infiltration with 30% sucrose, it was frozen, sectioned at 50 μm thickness, and stained with cresyl violet. The sections were subsequently examined under a light microscope and the locations of the electrode tips were drawn onto plates from the stereotaxic atlas of the rat brain (Paxinos and Watson, 1986). All data from the animals whose electrodes were not located in the prelimbic cortex, dorsal hippocampus and lateral entorhinal cortex were discarded (n = 2, Acquisition group and n = 3, Remote retention group).
Conflict of Interest Statement
The authors declare that the research was conducted in the absence of any commercial or financial relationships that could be construed as a potential conflict of interest.
Acknowledgments
The authors thank Nathan Insel for helpful comments on the manuscript. This work was supported by NSERC Discovery Grant, CFI Leaders Opportunity Fund (Kaori Takehara-Nishiuchi), NSERC graduate fellowship (Mark D. Morrissey), and NSERC undergraduate student research awards program (Geith Maal-Bared).
References
Agster, K. L., and Burwell, R. D. (2009). Cortical efferents of the perirhinal, postrhinal, and entorhinal cortices of the rat. Hippocampus 19, 1159–1186.
Alonso, A., and Garcia-Austt, E. (1987a). Neuronal sources of theta rhythm in the entorhinal cortex of the rat. I. Laminar distribution of theta field potentials. Exp. Brain Res. 67, 493–501.
Alonso, A., and Garcia-Austt, E. (1987b). Neuronal sources of theta rhythm in the entorhinal cortex of the rat. II. Phase relations between unit discharges and theta field potentials. Exp. Brain Res. 67, 502–509.
Anderson, K. L., Rajagovindan, R., Ghacibeh, G. A., Meador, K. J., and Ding, M. (2010). Theta oscillations mediate interaction between prefrontal cortex and medial temporal lobe in human memory. Cereb. Cortex 20, 1604–1612.
Benchenane, K., Peyrache, A., Khamassi, M., Tierney, P. L., Gioanni, Y., Battaglia, F. P., and Wiener, S. I. (2010). Coherent theta uoscillations and reorganization of spike timing in the hippocampal- prefrontal network upon learning. Neuron 66, 921–936.
Berry, S. D., and Swain, R. A. (1989). Water deprivation optimizes hippocampal activity and facilitates nictitating membrane conditioning. Behav. Neurosci. 103, 71–76.
Berry, S. D., and Thompson, R. F. (1978). Prediction of learning rate from the hippocampal electroencephalogram. Science 200, 1298–1300.
Canto, C. B., Wouterlood, F. G., and Witter, M. P. (2008). What does the anatomical organization of the entorhinal cortex tell us? Neural Plast. 2008, 381243.
Darling, R. D., Takatsuki, K., Griffin, A. L., and Berry, S. D. (2011). Eyeblink conditioning contingent on hippocampal theta enhances hippocampal and medial prefrontal responses. J. Neurophysiol. 105, 2213–2224.
De Clercq, W., Lemmerling, P., Van Paesschen, W., and Van Huffel, S. (2003). Characterization of interictal and ictal scalp EEG signals with the Hilbert transform. Conf. Proc. IEEE Eng. Med. Biol. Soc. 1, 2459–2462.
Deshmukh, S. S., Yoganarasimha, D., Voicu, H., and Knierim, J. J. (2010). Theta modulation in the medial and the lateral entorhinal cortices. J. Neurophysiol. 104, 994–1006.
Eichenbaum, H. (2000). A cortical-hippocampal system for declarative memory. Nat. Rev. Neurosci. 1, 41–50.
Fell, J., and Axmacher, N. (2011). The role of phase synchronization in memory processes. Nat. Rev. Neurosci. 12, 105–118.
Fernandez, G., and Tendolkar, I. (2006). The rhinal cortex: “gatekeeper” of the declarative memory system. Trends Cogn. Sci. (Regul. Ed.) 10, 358–362.
Frankland, P. W., and Bontempi, B. (2005). The organization of recent and remote memories. Nat. Rev. Neurosci. 6, 119–130.
Galvez, R., Weiss, C., Weible, A. P., and Disterhoft, J. F. (2006). Vibrissa-signaled eyeblink conditioning induces somatosensory cortical plasticity. J. Neurosci. 26, 6062–6068.
Griffin, A. L., Asaka, Y., Darling, R. D., and Berry, S. D. (2004). Theta-contingent trial presentation accelerates learning rate and enhances hippocampal plasticity during trace eyeblink conditioning. Behav. Neurosci. 118, 403–411.
Hoffmann, L. C., and Berry, S. D. (2009). Cerebellar theta oscillations are synchronized during hippocampal theta-contingent trace conditioning. Proc. Natl. Acad. Sci. U.S.A. 106, 21371–21376.
Inda, M. C., Delgado-Garcia, J. M., and Carrion, A. M. (2005). Acquisition, consolidation, reconsolidation, and extinction of eyelid conditioning responses require de novo protein synthesis. J. Neurosci. 25, 2070–2080.
Jones, B. F., and Witter, M. P. (2007). Cingulate cortex projections to the parahippocampal region and hippocampal formation in the rat. Hippocampus 17, 957–976.
Jones, M. W., and Wilson, M. A. (2005). Theta rhythms coordinate hippocampal-prefrontal interactions in a spatial memory task. PLoS Biol. 3, e402. doi: 10.1371/journal.pbio.0030402
Kalmbach, B. E., Ohyama, T., Kreider, J. C., Riusech, F., and Mauk, M. D. (2009). Interactions between prefrontal cortex and cerebellum revealed by trace eyelid conditioning. Learn. Mem. 16, 86–95.
Kerr, K. M., Agster, K. L., Furtak, S. C., and Burwell, R. D. (2007). Functional neuroanatomy of the parahippocampal region: the lateral and medial entorhinal areas. Hippocampus 17, 697–708.
Kim, J. J., Clark, R. E., and Thompson, R. F. (1995). Hippocampectomy impairs the memory of recently, but not remotely, acquired trace eyeblink conditioned responses. Behav. Neurosci. 109, 195–203.
Klimesch, W., Sauseng, P., and Gruber, W. (2009). The functional relevance of phase reset: a comment to Risner et al. (2009): the visual evoked potential of surface alpha rhythm phase. Neuroimage 47, 5–7.
Kronforst-Collins, M. A., and Disterhoft, J. F. (1998). Lesions of the caudal area of rabbit medial prefrontal cortex impair trace eyeblink conditioning. Neurobiol. Learn. Mem. 69, 147–162.
Lachaux, J. P., Rodriguez, E., Martinerie, J., and Varela, F. J. (1999). Measuring phase synchrony in brain signals. Hum. Brain Mapp. 8, 194–208.
Le Van Quyen, M., Foucher, J., Lachaux, J., Rodriguez, E., Lutz, A., Martinerie, J., and Varela, F. J. (2001). Comparison of Hilbert transform and wavelet methods for the analysis of neuronal synchrony. J. Neurosci. Methods 111, 83–98.
Lesburgueres, E., Gobbo, O. L., Alaux-Cantin, S., Hambucken, A., Trifilieff, P., and Bontempi, B. (2011). Early tagging of cortical networks is required for the formation of enduring associative memory. Science 331, 924–928.
Makinen, V., Tiitinen, H., and May, P. (2005). Auditory event-related responses are generated independently of ongoing brain activity. Neuroimage 24, 961–968.
Maviel, T., Durkin, T. P., Menzaghi, F., and Bontempi, B. (2004). Sites of neocortical reorganization critical for remote spatial memory. Science 305, 96–99.
McClelland, J. L., McNaughton, B. L., and O’Reilly, R. C. (1995). Why there are complementary learning systems in the hippocampus and neocortex: insights from the successes and failures of connectionist models of learning and memory. Psychol. Rev. 102, 419–457.
McLaughlin, J., Skaggs, H., Churchwell, J., and Powell, D. A. (2002). Medial prefrontal cortex and Pavlovian conditioning: trace versus delay conditioning. Behav. Neurosci. 116, 37–47.
Miller, M. J., Weiss, C., Song, X., Iordanescu, G., Disterhoft, J. F., and Wyrwicz, A. M. (2008). Functional magnetic resonance imaging of delay and trace eyeblink conditioning in the primary visual cortex of the rabbit. J. Neurosci. 28, 4974–4981.
Mitzdorf, U. (1985). Current source-density method and application in cat cerebral cortex: investigation of evoked potentials and EEG phenomena. Physiol. Rev. 65, 37–100.
Moyer, J. R. Jr., Deyo, R. A., and Disterhoft, J. F. (1990). Hippocampectomy disrupts trace eye-blink conditioning in rabbits. Behav. Neurosci. 104, 243–252.
Munera, A., Gruart, A., Munoz, M. D., Fernandez-Mas, R., and Delgado-Garcia, J. M. (2001). Hippocampal pyramidal cell activity encodes conditioned stimulus predictive value during classical conditioning in alert cats. J. Neurophysiol. 86, 2571–2582.
Nunez, P. L., and Srinivasan, R. (2006). Electric Fields of the Brain. New York: Oxford University Press.
Oswald, B. B., Maddox, S. A., Tisdale, N., and Powell, D. A. (2010). Encoding and retrieval are differentially processed by the anterior cingulate and prelimbic cortices: a study based on trace eyeblink conditioning in the rabbit. Neurobiol. Learn. Mem. 93, 37–45.
Paxinos, G., and Watson, C. (1986). The Rat Brain in Stereotaxic Coordinates, 2nd Edn. San Diego: Academic Press.
Paz, R., Bauer, E. P., and Pare, D. (2008). Theta synchronizes the activity of medial prefrontal neurons during learning. Learn. Mem. 15, 524–531.
Restivo, L., Vetere, G., Bontempi, B., and Ammassari-Teule, M. (2009). The formation of recent and remote memory is associated with time-dependent formation of dendritic spines in the hippocampus and anterior cingulate cortex. J. Neurosci. 29, 8206–8214.
Ross, R. S., and Eichenbaum, H. (2006). Dynamics of hippocampal and cortical activation during consolidation of a nonspatial memory. J. Neurosci. 26, 4852–4859.
Rudy, J. W., and O’Reilly, R. C. (2001). Conjunctive representations, the hippocampus, and contextual fear conditioning. Cogn. Affect. Behav. Neurosci. 1, 66–82.
Ryou, J. W., Cho, S. Y., and Kim, H. T. (2001). Lesions of the entorhinal cortex impair acquisition of hippocampal-dependent trace conditioning. Neurobiol. Learn. Mem. 75, 121–127.
Sacco, T., and Sacchetti, B. (2010). Role of secondary sensory cortices in emotional memory storage and retrieval in rats. Science 329, 649–656.
Sainsbury, R. S., Heynen, A., and Montoya, C. P. (1987). Behavioral correlates of hippocampal type 2 theta in the rat. Physiol. Behav. 39, 513–519.
Scoville, W. B., and Milner, B. (1957). Loss of recent memory after bilateral hippocampal lesions. J. Neurol. Neurosurg. Psychiatr. 20, 11–21.
Seager, M. A., Johnson, L. D., Chabot, E. S., Asaka, Y., and Berry, S. D. (2002). Oscillatory brain states and learning: impact of hippocampal theta-contingent training. Proc. Natl. Acad. Sci. U.S.A. 99, 1616–1620.
Seidenbecher, T., Laxmi, T. R., Stork, O., and Pape, H. C. (2003). Amygdalar and hippocampal theta rhythm synchronization during fear memory retrieval. Science 301, 846–850.
Siegel, J. J., Kalmbach, B., Chitwood, R. A., and Mauk, M. D. (2011). Persistent activity in a cortical-to-subcortical circuit: bridging the temporal gap in trace eyelid conditioning. J. Neurophysiol. [Epub ahead of print].
Simon, B., Knuckley, B., Churchwell, J., and Powell, D. A. (2005). Post-training lesions of the medial prefrontal cortex interfere with subsequent performance of trace eyeblink conditioning. J. Neurosci. 25, 10740–10746.
Singer, W. (1993). Synchronization of cortical activity and its putative role in information processing and learning. Annu. Rev. Physiol. 55, 349–374.
Sirota, A., Montgomery, S., Fujisawa, S., Isomura, Y., Zugaro, M., and Buzsaki, G. (2008). Entrainment of neocortical neurons and gamma oscillations by the hippocampal theta rhythm. Neuron 60, 683–697.
Solomon, P. R., Vander Schaaf, E. R., Thompson, R. F., and Weisz, D. J. (1986). Hippocampus and trace conditioning of the rabbit’s classically conditioned nictitating membrane response. Behav. Neurosci. 100, 729–744.
Squire, L. R. (1992). Memory and the hippocampus: a synthesis from findings with rats, monkeys, and humans. Psychol. Rev. 99, 195–231.
Squire, L. R., and Alvarez, P. (1995). Retrograde amnesia and memory consolidation: a neurobiological perspective. Curr. Opin. Neurobiol. 5, 169–177.
Takashima, A., Petersson, K. M., Rutters, F., Tendolkar, I., Jensen, O., Zwarts, M. J., McNaughton, B. L., and Fernandez, G. (2006). Declarative memory consolidation in humans: a prospective functional magnetic resonance imaging study. Proc. Natl. Acad. Sci. U.S.A. 103, 756–761.
Takehara, K., Kawahara, S., and Kirino, Y. (2003). Time-dependent reorganization of the brain components underlying memory retention in trace eyeblink conditioning. J. Neurosci. 23, 9897–9905.
Takehara, K., Kawahara, S., Takatsuki, K., and Kirino, Y. (2002). Time-limited role of the hippocampus in the memory for trace eyeblink conditioning in mice. Brain Res. 951, 183–190.
Takehara-Nishiuchi, K., Kawahara, S., and Kirino, Y. (2005). NMDA receptor-dependent processes in the medial prefrontal cortex are important for acquisition and the early stage of consolidation during trace, but not delay eyeblink conditioning. Learn. Mem. 12, 606–614.
Takehara-Nishiuchi, K., and McNaughton, B. L. (2008). Spontaneous changes of neocortical code for associative memory during consolidation. Science 322, 960–963.
Takehara-Nishiuchi, K., Nakao, K., Kawahara, S., Matsuki, N., and Kirino, Y. (2006). Systems consolidation requires postlearning activation of NMDA receptors in the medial prefrontal cortex in trace eyeblink conditioning. J. Neurosci. 26, 5049–5058.
Teyler, T. J., and DiScenna, P. (1986). The hippocampal memory indexing theory. Behav. Neurosci. 100, 147–154.
Varela, F., Lachaux, J. P., Rodriguez, E., and Martinerie, J. (2001). The brainweb: phase synchronization and large-scale integration. Nat. Rev. Neurosci. 2, 229–239.
Vetere, G., Restivo, L., Cole, C. J., Ross, P. J., Ammassari-Teule, M., Josselyn, S. A., and Frankland, P. W. (2011). Spine growth in the anterior cingulate cortex is necessary for the consolidation of contextual fear memory. Proc. Natl. Acad. Sci. U.S.A. 108, 8456–8460.
Weible, A. P., McEchron, M. D., and Disterhoft, J. F. (2000). Cortical involvement in acquisition and extinction of trace eyeblink conditioning. Behav. Neurosci. 114, 1058–1067.
Weiss, C., Bouwmeester, H., Power, J. M., and Disterhoft, J. F. (1999). Hippocampal lesions prevent trace eyeblink conditioning in the freely moving rat. Behav. Brain Res. 99, 123–132.
Wikgren, J., Nokia, M. S., and Penttonen, M. (2010). Hippocampo-cerebellar theta band phase synchrony in rabbits. Neuroscience 165, 1538–1545.
Womelsdorf, T., Schoffelen, J. M., Oostenveld, R., Singer, W., Desimone, R., Engel, A. K., and Fries, P. (2007). Modulation of neuronal interactions through neuronal synchronization. Science 316, 1609–1612.
Yasuda, M., and Mayford, M. R. (2006). CaMKII activation in the entorhinal cortex disrupts previously encoded spatial memory. Neuron 50, 309–318.
Keywords: consolidation, episodic memory, trace conditioning, EEG, rats
Citation: Takehara-Nishiuchi K, Maal-Bared G and Morrissey MD (2012) Increased entorhinal–prefrontal theta synchronization parallels decreased entorhinal–hippocampal theta synchronization during learning and consolidation of associative memory. Front. Behav. Neurosci. 5:90. doi: 10.3389/fnbeh.2011.00090
Received: 02 November 2011; Accepted: 15 December 2011;
Published online: 05 January 2012.
Edited by:
Martine Ammassari-Teule, Consiglio Nazionale delle Ricerche, ItalyReviewed by:
John F. Disterhoft, Northwestern University Medical School, USAEtienne Save, Université de Provence, France
Copyright: © 2012 Takehara-Nishiuchi, Maal-Bared and Morrissey. This is an open-access article distributed under the terms of the Creative Commons Attribution Non Commercial License, which permits non-commercial use, distribution, and reproduction in other forums, provided the original authors and source are credited.
*Correspondence: Kaori Takehara-Nishiuchi, Department of Psychology, University of Toronto, Sidney Smith Hall, Room 4033, 100 Saint George Street, Toronto, ON, Canada M5S 3G3. e-mail: takehara@psych.utoronto.ca.