Auditory grouping mechanisms reflect a sound's relative position in a sequence
- 1Human Neuroimaging Laboratory, Virginia Tech, Virginia Tech Carilion Research Institue, Roanoke, VA, USA
- 2Center for Mind and Brain, University of California, Davis, CA, USA
The human brain uses acoustic cues to decompose complex auditory scenes into its components. For instance to improve communication, a listener can select an individual “stream,” such as a talker in a crowded room, based on cues such as pitch or location. Despite numerous investigations into auditory streaming, few have demonstrated clear correlates of perception; instead, in many studies perception covaries with changes in physical stimulus properties (e.g., frequency separation). In the current report, we employ a classic ABA streaming paradigm and human electroencephalography (EEG) to disentangle the individual contributions of stimulus properties from changes in auditory perception. We find that changes in perceptual state—that is the perception of one versus two auditory streams with physically identical stimuli—and changes in physical stimulus properties are reflected independently in the event-related potential (ERP) during overlapping time windows. These findings emphasize the necessity of controlling for stimulus properties when studying perceptual effects of streaming. Furthermore, the independence of the perceptual effect from stimulus properties suggests the neural correlates of streaming reflect a tone's relative position within a larger sequence (1st, 2nd, 3rd) rather than its acoustics. By clarifying the role of stimulus attributes along with perceptual changes, this study helps explain precisely how the brain is able to distinguish a sound source of interest in an auditory scene.
Introduction
In everyday life, our auditory system confronts a dense sound mixture that must be segregated into discrete auditory streams. This process is extremely challenging computationally, and investigators have attempted to understand its mechanisms since it was first posed as the “cocktail party problem” nearly 60 years ago (Cherry, 1953). Though obviously crucial for auditory scene analysis, streaming also has general implications for understanding human cognition, particularly in disorders such as dyslexia (Petkov et al., 2005) and schizophrenia (Nielzen and Olsson, 1997) that are characterized by streaming deficits. Additionally, hearing impaired listeners struggle to form stable streams and selectively attend to a talker of interest, resulting in the feeling of isolation and depression (Festen and Plomp, 1990; Knutson and Lansing, 1990; Middelweerd et al., 1990). However, despite its importance in everyday communication, the underlying neural mechanisms remain unclear. This study seeks to expand our understanding of auditory scene analysis by directly measuring the neural signatures of auditory streaming with bistable stimuli.
Studies of streaming encompass two sub-categories: concurrent streaming, where listeners must separate two or more sounds presented at the same time (Alain et al., 2002, 2005; Carlyon, 2004; Bidet-Caulet et al., 2007), and sequential streaming, where a sequence of sounds undergoes perceptual grouping in accordance to the acoustic properties of the sequence elements (Bregman, 1994; Carlyon, 2004). The classic sequential streaming paradigm presents listeners with alternating sounds differentiated by a single acoustic property. While many features have been used, frequency and spatial separation are the most common, particularly frequency separation of pure tones (van Noorden, 1977; Bregman, 1994; Carlyon, 2004). The two sounds (referred to here as sound “A” and sound “B”) are arranged into repeating sequences that sometimes include silent gaps (-), as in the widely used ABA-pattern. Such sequences evoke fundamentally different perceptual states depending on the disparity between the two sounds. When the disparity is small listeners report hearing a single auditory stream that evokes a horse's galloping rhythm, and when it is large they report two streams comprised solely of A or B sounds (A-A-A- and B--B--). Calibrating the disparity to an intermediate level leads to a bistable percept where a listener's perception alternates spontaneously between grouped (galloping) and ungrouped perceptual states (Denham and Winkler, 2006; Pressnitzer and Hupe, 2006).
Currently, the dominant models for streaming propose that sound segregation occurs through spatially (Micheyl et al., 2007) or spatiotemporally (Elhilali et al., 2009) distinct neural populations which preferentially encode the separate streams. The common principle between these models is that streams are segregated by the same networks tuned for stimulus properties (Hill et al., 2011). This makes identifying neural correlates of perception difficult, because neural activity reflecting perception must be dissociated from activity in the same network that reflects incidental stimulus differences. However in most studies, perception and stimulus attributes are strongly correlated. Studies have thus relied on changes in a stimulus property to bias streaming perception, such as frequency separation (Fishman et al., 2001, 2004; Yabe et al., 2001; Micheyl et al., 2005; Sussman, 2005; Snyder et al., 2006; Wilson et al., 2007), pitch separation (Gutschalk et al., 2007), timber changes (Deike et al., 2004), time from sequence onset (Micheyl et al., 2005; Snyder et al., 2006), sequence timing (Sussman et al., 1999; Fishman et al., 2001, 2004; Wilson et al., 2007), or prior stimulus adaptation (Snyder et al., 2009). To date only four imaging studies, one using magnetoencephalography (MEG) (Gutschalk et al., 2005) and three others employing functional magnetic resonance imaging (fMRI) (Cusack, 2005; Kondo and Kashino, 2009; Hill et al., 2011), have looked at the effect of perception in the absence of confounding stimulus changes. However, none have analyzed the effect of both stimulus properties and perception independently, limiting their ability to assimilate results from past work.
In order to show an unambiguous neural correlate of streaming, analysis must account for perceptual state in the absence physical stimulus changes. Conversely, to best interpret prior experiments that relied on changes in stimulus attributes, one must address effects due solely to those changes without a corresponding change in percept. To this end we recorded electroencephalographic (EEG) activity in human subjects while they explicitly categorized perceptually bistable sound mixtures as segregated or grouped. By tightly controlling stimulus disparity and measuring perceptual grouping independently, we report neural evidence of perceptual modification of processing of tones that is independent of stimulus attributes, but instead reflects the relative location of a sound within a sound sequence.
Materials and Methods
Participants
Thirty-one subjects participated in the study (mean age 20.97 years ± 1.83 years SD). All subjects were native English-speakers, had self-reported good hearing and no history of neurological disorders. Participants gave written informed consent in accordance with procedures approved by the University of California Institutional Review Board and were paid for their participation. The group of 31 was broken into two cohorts. The first cohort (16 participants) received only the low-high-low triplet sequence while the second cohort (15 participants) was presented with both low-high-low and high-low-high triplet sequences. See following sections for details on the stimulus sequences.
Stimulus Design
The stimulus consisted of repeating sequences of two sets of pure tones (A and B) and gaps (-), presented diotically at a comfortable level, approximately 70 dB(A). The tones were arranged in an “ABA-” triplet pattern. Tones in the ABA triplets had a stimulus onset asynchrony (SOA) of 100 ms, with a 10 ms linear ramp and a total tone length of 95 ms. The long gap (-) had a duration of 100 ms to ensure that the tones in segmented A and B streams were isochronous (Figure 1). The A and B tones were separated in frequency by either 1.5 or 3 semitones (referred to as small and large separation, respectively), determined in a pilot study to yield perceptual bistability (see “Behavioral Task” below). To ensure that the resulting event-related potentials (ERPs) in a particular time window were not determined by the frequency of a particular tone, but rather it's position within a triplet, we presented two sets of triplet sequences: a low-high-low triplet where the A tones were 1000 Hz and the B tones either 1.5 or 3 semitones above, and a high-low-high triplet where the B tone had a frequency of 1000 Hz and the A tone frequency was 1.5 or 3 semitones above. Each stimulus block consisted of a combination between the sequence type (low-high-low or high-low-high) and a frequency separation (small or large) played continuously for 1 min. As mentioned above, the first cohort (16 subjects) received only low-high-low sequences, while the second cohort (15 subjects) received both low-high-low and high-low-high triplet sequences.
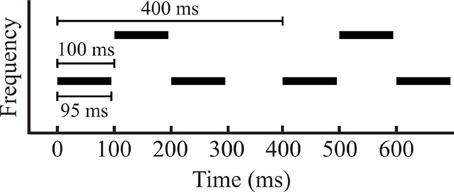
Figure 1. A diagram of stimulus parameters that shows two triplets. The length between each triplet was 400 ms, with 100 ms stimulus onset asynchrony (SOA) between each tone, and a tone length of 95 ms. In the two conditions, the middle tone of the triplet was separated from the first and third by either 1.5 or 3 semitones.
Behavioral Task
Subjects completed a short training session demonstrating how to distinguish the two percepts, which typically alternated spontaneously and categorically between a single stream containing both the A and B tones (referred to as grouped) and two separate streams of the A tones alone and the B tones alone (referred to as split). Once they were comfortable with the distinction, subjects began the experimental portion of the study. Subjects heard 80 blocks of a 1 min long segment of the stimuli described above. Subjects were instructed to press a button with their middle finger whenever their perception changed from split to grouped or their index finger for grouped to split changes. All subjects were assumed to begin each block in the grouped percept (Pressnitzer and Hupe, 2006). Between each block, subjects were allowed a self-timed break.
EEG Recording and Pre-Processing
Electrical potentials were recorded from 64 scalp electrodes using a Biosemi Active Link 2 system (http://www.biosemi.com/) and digitized at 1024 Hz. Data were analyzed in MATLAB using in-house scripts and EEGLAB (Delorme and Makeig, 2004). All data was referenced to the common average reference of all 64 scalp electrodes. Data was filtered with a band-pass, zero-phase FIR filter with lower and upper cutoff frequencies of 2 and 30 Hz, respectively, and a roll-off of 30 dB/octave.
ERP epochs were created around each triplet (ABA-) from 50 ms prior to the start of the first tone (−50 ms) to 50 ms after the end of the last tone (350 ms). Any epoch that began within 1500 ms before or after a button response was discarded to ensure that triplets used in further analysis were unambiguously of one percept or another, even when accounting for variable reaction time and motor planning. This also ensured that motor-related EEG activity did not corrupt the triplet perception data. Finally, the first two triplets at each block onset were rejected to ensure that the data were free of characteristically larger responses to the first tones in a sequence (Jarvilehto et al., 1978; Hari et al., 1982), which would have otherwise been assigned to the grouped category. After these epochs were rejected, the remaining epochs were sorted into one of eight categories based on a conjunction of sequence type (low-high-low or high-low-high), frequency separation (small or large) and percept (grouped or split). Subjects in the first cohort did not receive both sequence types, and therefore all tests involving sequence type reflect only the data from cohort two. All other tests reflect data pooled across cohorts. For these eight triplet categories, a voltage threshold of ±80 μV was used to reject epochs with artifacts. No baseline correction was performed, as the repeating nature of the paradigm does not allow for a substantial quiet period before the onset of the epoch, and voltages in the putative baseline portion most likely reflect the neural correlates relating to tones at the end of the previous triplet. We should emphasize, however, that because of our conservative method of rejecting trials near perceptual switches, the previous triplet and accompanying responses that extend into the next trial fall into the same condition as that next trial. The stimulus regimen (80 blocks of 60 s of stimuli with triplets repeating every 400 ms) leads to 12,000 trials being presented to each subject. Even with this conservative method of rejecting trials, we included an average of 1298 trials per subject per condition (with four conditions for the first cohort and eight conditions for the second cohort). This corresponds to a 64% acceptance rate for trials across the entire experiment.
ERP Analysis
In order to detect main effects of our two stimulus factors, single perceptual factor, and interactions between factors, we performed three-factor (2 × 2 × 2) repeated measures analysis of variances (ANOVAs). A separate ANOVA was performed for each time point at each channel. The ANOVAs used the single subject averages for each of the eight triplet categories as the dependent measure. To correct for the number of tests needed to analyze each time point and channel independently, we used a false discovery rate (FDR) threshold with an alpha = 0.05. This ensures that at most 5% of the reported time points were false positives (Benjamini and Hochberg, 1995; Benjamini and Yekutieli, 2001). FDR correction was applied to all main effects and interactions collectively, ensuring a common F-score threshold across all tests. To further ensure that the reported findings reflected broad processing changes accompanying the stimulus or perceptual factor, only time windows with more than 15 significant channels in all time windows, and at least one time point within the window with more than 20 significant channels were considered.
Results
Behavior
Mean streaming proportion and buildup over time for all conditions are shown in Figure 2. The proportion of streaming, buildup time (measured as the time needed to reach 90% of the mean streaming proportion for the final 30 s of the block), and median time between switches in percept differed significantly between frequency separations of stimuli. The small and large conditions showed, respectively: a mean streaming percentage of 42.7% and 65.5%, a mean buildup time of 16.85 and 7.64 s and a group mean of each subject's median inter-switch interval of 7.34 and 5.98 s. All behavioral measures were subjected to a 2 × 2 repeated measures ANOVA with the factors of frequency separation (small and large) and sequence type (low-high-low and high-low-high). There was a main effect of frequency separation on streaming proportion [F(1, 88) = 203.32, p < 10−23], buildup time [F(1, 88) = 136.95, p < 10−18], and inter-switch interval [F(1, 88) = 13.34, p < 0.0005]. There were no main effects of triplet type, or significant interactions between the two factors.
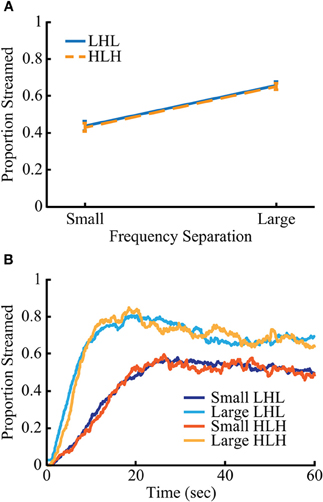
Figure 2. Behavior for the two sequence types is nearly identical. Streaming rates (A) and buildup (B) are nearly identical between the two sequence types (low-high-low and high-low-high) but differ significantly between frequency separation (small and large) (p < 0.005). Error bars in (A) represent SEM.
Description of ERPs
The triplets produced a complex ERP waveform. In order to succinctly describe the response to the triplets across the scalp, global field power (GFP) (Lehmann and Skrandies, 1980) local minima were used to identify time regions that possessed stable scalp topographies. Analysis of the GFP resulted in six time windows with clear topographic structure. Because triplets repeat continuously, and tones within the triplet are spaced at close intervals (100 ms), it is likely that the amplitude at any one time point is influenced by the neural signal resulting from multiple tones, and the interaction among the neural activity underlying these signals may not be linear. The GFP, time windows, and mean scalp topography over each time window are plotted in Figure 3. In the time window from −40 to 40 ms, there is a frontal negative topography, most likely due to slow wave signals from the preceding trial. Because of the epoching procedure (see “Materials and Methods” for details), this previous trial's influence is exclusively from triplets under the same perceptual state, and time over the epoch can effectively be thought of as circular. At both of the time windows of 50–110 ms and 130–190 ms a frontal positivity is observed. This positive frontal distribution is reminiscent of a canonical P1 auditory response. However, the timing of these components is uncharacteristic of the P1 response, and should not be assumed to reflect the same neural activity that generates the P1. This is followed by two short time windows, 210–230 ms and 240–280 ms where the voltage over the scalp rapidly switches polarity to frontal negative and then back to frontal positive both with idiosyncratic topographies that do not correspond to canonical auditory responses. Finally, the scalp exhibits a final frontal negativity that lasts from 290 to 345 ms.
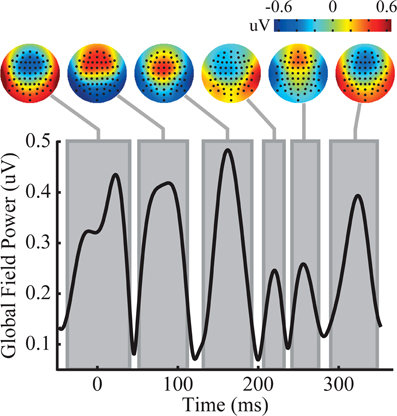
Figure 3. Analysis of the triplet epoch reveals six time windows with distinct topography. The temporal evolution of global field power (GFP) is shown on the y-axis. Each gray box represents the time window of a distinct topography shown above. See the main text for exact specifications of the time windows.
Effects of Stimulus Changes and Perception
Because of the non-canonical nature of some or all of the components, we had no a priori hypotheses about which channels would hold meaningful information about either stimulus effects or perceptual state. Consequently, we analyzed each time point from each channel with a 2 × 2 × 2 ANOVA with the factors of triplet type (low-high-low and high-low-high), frequency separation (small and large), and perceptual state (grouped and split), with voltage as the dependent measure. To control for false positives, a FDR threshold was used with an alpha = 0.05. See “Materials and Methods” section for details.
While no time windows were detected with significant interactions between our factors, multiple significant time windows were found for all three main effects (Figure 4). These time windows roughly corresponded to peaks in the GFP of the difference waves, and have been shown in the figures relative to the temporal progression of GFP in order to give the reader a sense of the temporal evolution of the measured effects across all channels. However, voltage at individual channels, not GFP across channels, was used in all statistical tests as laid out above. In order to plot these effects we have shown the sequence type effect as HLH minus LHL, the frequency separation effect as large minus small, and the perceptual effect as split minus grouped. Perception had four significant time windows: the first from −20 to 77 ms, the second from 150 to 164 ms, the third from 187 to 245 ms, and the fourth from 270 to 314 ms. These windows showed a fronto-central negativity, a possibly asymmetric frontal negativity, a frontal positivity, and an extreme-frontal positivity, respectively. Triplet type had two significant time windows: the first is from 192 to 227 ms, and the second is from 298 to 353 ms. The topographies within these time windows showed a frontal positivity and a central negativity, respectively. Frequency separation had three significant time windows: the first is from 43 to 64 ms, the second from 97 to 140 ms, and the third from 235 to 289 ms. The first two time windows show topography of a frontal negativity followed by a frontal positivity in the third time window.
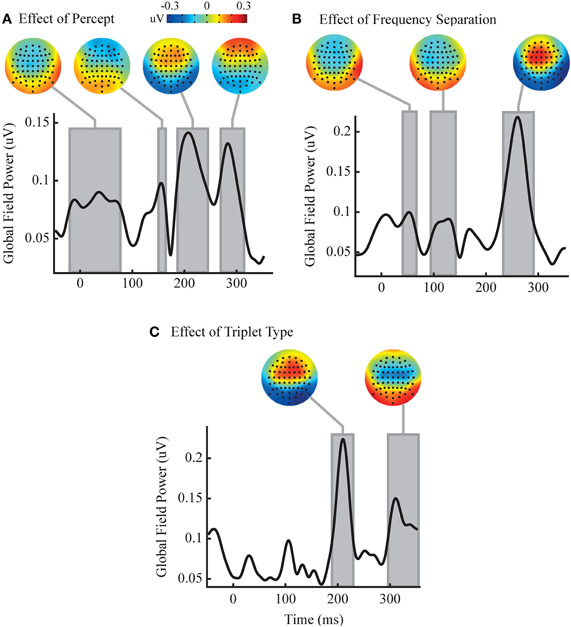
Figure 4. Analysis reveals independent effects of percept and stimulus changes. Each of the three axes shows the temporal evolution of the GFP of the group perceptual (split minus grouped, A), frequency separation (large minus small, B) and triplet sequence (HLH minus LHL, C) difference waves. Gray boxes represent significant time windows where an ANOVA finds a significant main effect for the relevant factor in a large number of channels (p < 0.05, FDR corrected. Note that voltage on individual channels, not GFP across channels, was used as the dependent measure. See main text for details). Corresponding topographies of the mean difference wave over the time windows are shown above. No time windows contained significant interactions between factors.
Discussion
The motivation for this work was the concern that many previous streaming studies reported a mixture of both perceptual effects and differences driven by changes in the stimulus used to influence perception. We have found large differences that are due solely to changes in the stimulus parameters used. These findings should strongly affect our interpretation of previous work that relied on stimulus changes, and should inform future studies which aim to study streaming. The effects are large in magnitude and centered between 200 and 300 ms latency, in the range of effects reported in previous studies that used stimulus changes to induce changes in perceptual state (Snyder et al., 2006).
It has been suggested that stream segregation relies on a general neural substrate to segment sounds using forward suppression, regardless of the streaming paradigm (Gutschalk et al., 2007). The stimulus-independent perceptual effects found in this study provide an avenue to test this theory by determining whether the perceptual difference wave is invariant to different forms of streaming. In the current study, we used a standard pure tone streaming paradigm, but streaming can be accomplished with a wide variety of stimulus differences such as Huggins pitch (Akeroyd et al., 2005), timber (Cusack and Roberts, 2000), interaural level difference (Boehnke and Phillips, 2005), and amplitude modulation rate (Grimault et al., 2002). Determining if the observed independent perceptual effect of streaming is constant across multiple stimulus categories may indicate the extent to which the networks responsible for auditory streaming are shared across a diverse set of auditory objects. Our findings of clear independent effect of perceptual state, together with the lack of interactions between stimulus configuration and perceptual processing should be taken as a positive sign for the ability to generalize the findings of individual studies on perceptual streaming across multiple stimulus configurations.
The stability of the effect of perception across changes to the frequency of the A and B tones also suggests that neural consequences of perceptual shifts are tied more closely to the relative position of tones within a sequence (1st, 2nd, 3rd) than to their frequency content (A or B). Had the neural consequence of streaming related more closely to the frequency of the tone, the effects of perceptual state would have been detected as interactions between perceptual and stimulus factors, rather than an independent effect of perception. With three time windows and three tones, it is tempting to attribute each of the final three time windows driven by perceptual state to the change in processing accompanying a single tone. However, there are numerous indicators to the contrary. The latencies from the tones and topographies are not consistent from tone to tone, or within streams or any simple grouping. The second significant time window beginning 150 ms after the onset of the first tone, while the 3rd and 4th time windows begin approximately 90 and 70 ms after the 2nd and 3rd tones, respectively. The topographies for those three time windows are a frontal negativity followed by two mid to frontal positivites. A natural assumption is that the effect of auditory grouping would be symmetric with respect to the two streams and that each sequence would undergo the same measurable change when merged. However, the idiosyncratic nature of the perceptual driven differences suggests that some more complex process is taking place, and that this process reflects a sounds relative position within a sequence rather than the sounds low level stimulus properties. Further study is needed to understand the relationship between these low latency effects and the patterns of tones within a sequence. Obviously the natural world does not present itself into tightly controlled tone sequences, and therefore a concrete definition of “relative position within a sequence” holds less meaning for naturalistic stimuli. Regardless, understanding how simple sequences are processed may pave the way for understanding more complex sequences, and the probabilistic sequences common in nature.
The current report also highlights several important technical considerations. First, our choice not to baseline-correct our epochs was critical to the prevention of an incorrect interpretation of our data. While baseline correction has certain benefits, it relies on the assumption that the net activity over the baseline portion is zero. Violating this assumption can strongly affect interpretation of paradigms such as ours. The activity recorded during our baseline period most likely reflects long latency ERP waves from the previous epoch. This activity has a distinct topography, and attempting to “correct” this baseline would propagate the signal throughout the trial and distort all subsequent topographies and difference waves. These slow waves may reflect an important aspect of streaming which has so far gone unnoticed due to the tendency of ERP analysis to include baseline correction. The negativity we report could have latency anywhere from 100 ms if it is triggered from the offset of the last tone in the triplet, to 400 ms if it is locked to onset of the first tone.
None of the previously mentioned differences driven by percept or stimulus clearly resemble canonical auditory components. This should not be surprising, as the rapid presentation rate required to elicit a streaming percept likely causes a strong level of adaptation of auditory components, particularly of the auditory N1 (Prosser et al., 1981). It is unclear, however, if this form of adaptation is uniform for all auditory components with the rates used in this experiment. It may be that these observed differences represent canonical components whose amplitude and latency have been modified by the process of adaptation, or emergent phenomena unique to presentation of sounds at rates compatible with streaming. A previous MEG study found effects of streaming that more closely resemble canonical MEG auditory components (Gutschalk et al., 2005), but it is unclear if these findings are due to subtle differences in the stimuli between that study and ours or a result of the two methods' sensitivities to different auditory components (Siedenberg et al., 1996).
By highlighting the design constraints of investigating streaming with EEG, this study may provide some guidance for future approaches. Clear interpretation of the functional role of changes in neural processing due to perception is difficult due to the tightly spaced repeating patterns of sounds required to elicit a segregated percept. In all studies of ERPs, there is an issue of discerning the latent components from the local minima and maxima of voltage waves, but this problem becomes more pronounced when multiple stimuli are presented in rapid succession. However, the careful manipulation of tone length and spacing within a similar paradigm may help tease apart the causal elements in the paradigm that generate the observed components. The specific question raised by this and other work is relating the observed differences with specific members of a tone sequence. One could gain additional insight into this question by using shorter tone lengths, similar to the 20 ms tone lengths used in the work by Snyder et al. (2006), and then varying the inter-tone intervals between tones while keeping the same overall triplet length. Utilizing careful manipulations of a basic and standardized paradigm is likely the best way to both make progress within the field, and to find agreement between studies.
Conclusions
Using a paradigm that allows for explicit monitoring of streaming perception, we have demonstrated independent contributions of stimulus and perceptual changes to ERP recordings. Specifically, we provide evidence that modifications to the neural processing of tones are not tied to low-level stimulus properties, but instead reliant on a sound's relative location within a sound sequence. This provides a foundation for future experiments addressing cognitive models of auditory scene analysis.
Conflict of Interest Statement
The authors declare that the research was conducted in the absence of any commercial or financial relationships that could be construed as a potential conflict of interest.
Acknowledgments
This work was supported by the National Institutes of Health: National Institute on Deafness and other Communication Disorders [R01-DC8171 to Lee M. Miller, T32-DC8072-01A2 to Kevin T. Hill, and F31-DC011429 to Christopher W. Bishop].
References
Akeroyd, M. A., Carlyon, R. P., and Deeks, J. M. (2005). Can dichotic pitches form two streams? J. Acoust. Soc. Am. 118, 977–981.
Alain, C., Reinke, K., He, Y., Wang, C., and Lobaugh, N. (2005). Hearing two things at once: neurophysiological indices of speech segregation and identification. J. Cogn. Neurosci. 17, 811–818.
Alain, C., Schuler, B. M., and McDonald, K. L. (2002). Neural activity associated with distinguishing concurrent auditory objects. J. Acoust. Soc. Am. 111, 990–995.
Benjamini, Y., and Hochberg, Y. (1995). Controlling the false discovery rate: a parctical and powerful approach to multiple testing. J. R. Stat. Soc. Series B Stat. Methodol. 57, 289–300.
Benjamini, Y., and Yekutieli, D. (2001). The control of the false discovery rate in multiple testing under dependency. Ann. Stat. 29, 1165–1188.
Bidet-Caulet, A., Fischer, C., Besle, J., Aguera, P. E., Giard, M. H., and Bertrand, O. (2007). Effects of selective attention on the electrophysiological representation of concurrent sounds in the human auditory cortex. J. Neurosci. 27, 9252–9261.
Boehnke, S. E., and Phillips, D. P. (2005). The relation between auditory temporal interval processing and sequential stream segregation examined with stimulus laterality differences. Percept. Psychophys. 67, 1088–1101.
Bregman, A. S. (1994). Auditory Scene Analysis: The Perceptual Organization of Sound. Cambridge, MA: MIT Press.
Cherry, E. C. (1953). Some experiments on the recognition of speech, with one and with two ears. J. Acoust. Soc. Am. 25, 975–979.
Cusack, R. (2005). The intraparietal sulcus and perceptual organization. J. Cogn. Neurosci. 17, 641–651.
Cusack, R., and Roberts, B. (2000). Effects of differences in timbre on sequential grouping. Percept. Psychophys. 62, 1112–1120.
Deike, S., Gaschler-Markefski, B., Brechmann, A., and Scheich, H. (2004). Auditory stream segregation relying on timbre involves left auditory cortex. Neuroreport 15, 1511–1514.
Delorme, A., and Makeig, S. (2004). EEGLAB: an open source toolbox for analysis of single-trial EEG dynamics including independent component analysis. J. Neurosci. Methods 134, 9–21.
Denham, S. L., and Winkler, I. (2006). The role of predictive models in the formation of auditory streams. J. Physiol. Paris 100, 154–170.
Elhilali, M., Ma, L., Micheyl, C., Oxenham, A. J., and Shamma, S. A. (2009). Temporal coherence in the perceptual organization and cortical representation of auditory scenes. Neuron 61, 317–329.
Festen, J. M., and Plomp, R. (1990). Effects of fluctuating noise and interfering speech on the speech-reception threshold for impaired and normal hearing. J. Acoust. Soc. Am. 88, 1725–1736.
Fishman, Y. I., Arezzo, J. C., and Steinschneider, M. (2004). Auditory stream segregation in monkey auditory cortex: effects of frequency separation, presentation rate, and tone duration. J. Acoust. Soc. Am. 116, 1656–1670.
Fishman, Y. I., Reser, D. H., Arezzo, J. C., and Steinschneider, M. (2001). Neural correlates of auditory stream segregation in primary auditory cortex of the awake monkey. Hear. Res. 151, 167–187.
Grimault, N., Bacon, S. P., and Micheyl, C. (2002). Auditory stream segregation on the basis of amplitude-modulation rate. J. Acoust. Soc. Am. 111, 1340–1348.
Gutschalk, A., Micheyl, C., Melcher, J. R., Rupp, A., Scherg, M., and Oxenham, A. J. (2005). Neuromagnetic correlates of streaming in human auditory cortex. J. Neurosci. 25, 5382–5388.
Gutschalk, A., Oxenham, A. J., Micheyl, C., Wilson, E. C., and Melcher, J. R. (2007). Human cortical activity during streaming without spectral cues suggests a general neural substrate for auditory stream segregation. J. Neurosci. 27, 13074–13081.
Hari, R., Kaila, K., Katila, T., Tuomisto, T., and Varpula, T. (1982). Interstimulus interval dependence of the auditory vertex response and its magnetic counterpart: implications for their neural generation. Electroencephalogr. Clin. Neurophysiol. 54, 561–569.
Hill, K. T., Bishop, C. W., Yadav, D., and Miller, L. M. (2011). Pattern of BOLD signal in auditory cortex relates acoustic response to perceptual streaming. BMC Neurosci. 12, 85.
Jarvilehto, T., Hari, R., and Sams, M. (1978). Effect of stimulus repetition on negative sustained potentials elicited by auditory and visual stimuli in the human EEG. Biol. Psychol. 7, 1–12.
Knutson, J. F., and Lansing, C. R. (1990). The relationship between communication problems and psychological difficulties in persons with profound acquired hearing loss. J. Speech Hear. Disord. 55, 656–664.
Kondo, H. M., and Kashino, M. (2009). Involvement of the thalamocortical loop in the spontaneous switching of percepts in auditory streaming. J. Neurosci. 29, 12695–12701.
Lehmann, D., and Skrandies, W. (1980). Reference-free identification of components of checkerboard-evoked multichannel potential fields. Electroencephalogr. Clin. Neurophysiol. 48, 609–621.
Micheyl, C., Carlyon, R. P., Gutschalk, A., Melcher, J. R., Oxenham, A. J., Rauschecker, J. P., Tian, B., and Courtenay Wilson, E. (2007). The role of auditory cortex in the formation of auditory streams. Hear. Res. 229, 116–131.
Micheyl, C., Tian, B., Carlyon, R. P., and Rauschecker, J. P. (2005). Perceptual organization of tone sequences in the auditory cortex of awake macaques. Neuron 48, 139–148.
Middelweerd, M. J., Festen, J. M., and Plomp, R. (1990). Difficulties with speech intelligibility in noise in spite of a normal pure-tone audiogram. Audiology 29, 1–7.
Nielzen, S., and Olsson, O. (1997). Perceptual grouping due to pitch and amplitude in hallucinating schizophrenics. Psychopathology 30, 140–148.
Petkov, C. I., O'Connor, K. N., Benmoshe, G., Baynes, K., and Sutter, M. L. (2005). Auditory perceptual grouping and attention in dyslexia. Brain Res. Cogn. Brain Res. 24, 343–354.
Pressnitzer, D., and Hupe, J. M. (2006). Temporal dynamics of auditory and visual bistability reveal common principles of perceptual organization. Curr. Biol. 16, 1351–1357.
Prosser, S., Arslan, E., and Michelini, S. (1981). Habituation and rate effect in the auditory cortical potentials evoked by trains of stimuli. Arch. Otorhinolaryngol. 233, 179–187.
Siedenberg, R., Goodin, D. S., Aminoff, M. J., Rowley, H. A., and Roberts, T. P. L. (1996). Comparison of late components in simultaneously recorded event-related electrical potentials and event-related magnetic fields. Electroencephalogr. Clin. Neurophysiol. 99, 191–197.
Snyder, J. S., Alain, C., and Picton, T. W. (2006). Effects of attention on neuroelectric correlates of auditory stream segregation. J. Cogn. Neurosci. 18, 1–13.
Snyder, J. S., Holder, W. T., Weintraub, D. M., Carter, O. L., and Alain, C. (2009). Effects of prior stimulus and prior perception on neural correlates of auditory stream segregation. Psychophysiology 46, 1208–1215.
Sussman, E. S. (2005). Integration and segregation in auditory scene analysis. J. Acoust. Soc. Am. 117(3 Pt 1), 1285–1298.
Sussman, E., Ritter, W., and Vaughan, H. G. Jr. (1999). An investigation of the auditory streaming effect using event-related brain potentials. Psychophysiology 36, 22–34.
van Noorden, L. P. (1977). Minimun differences of level and frequency for perceptual fission of tone sequences ABAB. J. Acoust. Soc. Am. 61, 1041–1045.
Wilson, E. C., Melcher, J. R., Micheyl, C., Gutschalk, A., and Oxenham, A. J. (2007). Cortical FMRI activation to sequences of tones alternating in frequency: relationship to perceived rate and streaming. J. Neurophysiol. 97, 2230–2238.
Keywords: auditory, grouping, streaming, EEG, perception, bistable
Citation: Hill KT, Bishop CW and Miller LM (2012) Auditory grouping mechanisms reflect a sound's relative position in a sequence. Front. Hum. Neurosci. 6:158. doi: 10.3389/fnhum.2012.00158
Received: 15 March 2012; Accepted: 17 May 2012;
Published online: 08 June 2012.
Edited by:
John J. Foxe, Albert Einstein College of Medicine, USAReviewed by:
Kimmo Alho, University of Helsinki, FinlandWalter Ritter, University of Western Sydney, Australia
Copyright: © 2012 Hill, Bishop and Miller. This is an open-access article distributed under the terms of the Creative Commons Attribution Non Commercial License, which permits non-commercial use, distribution, and reproduction in other forums, provided the original authors and source are credited.
*Correspondence: Lee M. Miller, Center for Mind and Brain, University of California, 1544 Newton Court, Davis, CA 95618, USA. e-mail: leemiller@ucdavis.edu