1
Department of Psychology and Princeton Neuroscience Institute, Princeton University, Princeton, NJ, USA
2
Department of Psychological and Brain Sciences, Dartmouth College, Hanover, NH, USA
3
Center for Cognitive Neuroscience, Dartmouth College, Hanover, NH, USA
Perceptual categorization is a fundamental cognitive process that gives meaning to an often graded sensory environment. Previous research has subdivided the visual pathway into posterior regions that processes the physical properties of a stimulus, and frontal regions that process more abstract properties such as category information. The superior temporal sulcus (STS) is known to be involved in face and emotion perception, but the nature of its processing remains unknown. Here, we used targeted fMRI measurements of the STS to investigate whether its representations of facial expressions are categorical or noncategorical. Multivoxel pattern analysis showed that even though subjects were performing a categorization task, the left STS contained graded, noncategorical representations. In the right STS, representations showed evidence for both stimulus-related gradations and a categorical boundary.
Perceptual categorization is a fundamental cognitive ability because it underlies the recognition of abstract, behaviorally relevant classes in an often graded sensory environment. In the brain, there is evidence for a frontal-posterior division of labor for visual categorization (Freedman et al., 2001
, 2003
; Op de Beeck et al., 2001
). Experiments on the inferior temporal cortex (ITC) of nonhuman primates have shown that as the shape of a stimulus moves parametrically away from the a neuron’s preferred shape, the neuron’s response decreases in a graded manner (Op de Beeck et al., 2001
). In contrast, when primates are trained to separate stimuli varying along a morph continuum into categories, there is evidence that neurons in prefrontal cortex (PFC) tend to represent the categories of the stimuli, instead of their position along the continuum (Freedman et al., 2001
, 2003
). Consistent with the evidence from nonhuman primates, fMRI adaptation studies on humans have shown mostly noncategorical tuning for specific shapes in lateral occipital cortex (LOC), but tuning for categories in lateral PFC (Jiang et al., 2007
). Idealized illustrations of categorical and noncategorical representations are shown in Figure 1
.
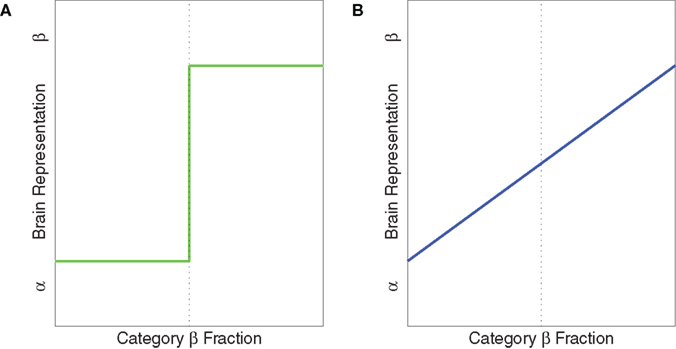
Figure 1. Idealized illustrations of two possible ways a brain area could represent stimuli, when categories α and β have been learned. (A) Categorical representations. (B) Graded, noncategorical representations. The y-axis could be measured in several ways. Low values indicate the brain is in the “α” state. High values indicate the brain is in the “β” state.
In this functional magnetic resonance imaging (fMRI) study, we used spatially targeted measurements to study representations of facial expressions in the superior temporal sulcus (STS), an area that it is poorly understood (Hein and Knight, 2008
). While the STS is known to respond to facial expressions (Hasselmo et al., 1989
; Andrews and Ewbank, 2004
; Leslie et al., 2004
; Engell and Haxby, 2007
; Montgomery and Haxby, 2007
; Thielscher and Pessoa, 2007
), little is known about how facial expressions are represented. In particular, the STS is thought to have both “high level” and “low level” properties (Binder et al., 1997
; Allison et al., 2000
; Grossman and Blake, 2002
; Noguchi et al., 2005
; Calder et al., 2007
; Hein and Knight, 2008
), and thus could plausibly be hypothesized to have either categorical or noncategorical representations of facial expressions. The goal of this study is to test whether STS representations of facial expressions are categorical or noncategorical, while subjects are performing a categorization task.
Instead of observing the responses of individual neurons or individual voxels, we investigate the distributed representations of populations of voxels (Haxby et al., 2001
; O’Toole et al., 2005
; Norman et al., 2006
; Haushofer et al., 2008
; Op de Beeck et al., 2008
). Thus, in this study, neural representation is operationally defined as a spatial map of parameter estimates on each trial. The similarity structure of neural representations is not necessarily the same as the similarity structure obtained from fMRI adaptation. Indeed, in experiments not related to categorization, it has been shown that the distributed representations are more faithful to the physical similarity structure of the stimuli in some brain areas, whereas the adaptation-based representations are more faithful in other areas (Drucker and Aguirre, 2009
).
Subjects viewed videos of facial expressions, where each video occupied a point along a continuum between fear and anger. Subjects were required to indicate whether the expression was closer to fear or anger. We enforced the category boundary with feedback in order to minimize potential changes in boundary positions caused by adaptation (Webster et al., 2004
).
Subjects
Seventeen participants (9 females; mean age 20.6 years) with normal or corrected-to-normal vision participated in the fMRI study. No subjects were excluded from the experiment, and all maximal head displacements were within 5 mm in any cardinal direction. All subjects gave informed consent prior to the experiment and were debriefed at its completion in accordance with the policies of Princeton University’s Institutional Review Panel.
Video Stimuli
Subjects viewed computer generated videos of emotional expressions. Each video was either anger, fear, or an intermediate expression taken from a morph continuum between anger and fear. All videos started with a neutral expression held for 167 ms, and then moved for 767 ms towards an endpoint expression, which was then held for an additional 767 ms. The full range of morph levels for the endpoint frame was 0%, 10%, 20%, 30%, 40%, 60%, 70%, 80%, 90% and 100% anger. For brevity, the phrase “k% anger” here and henceforth implicitly designates an expression that is also (100-k)% fear. In order to maintain subject engagement in the task, the expressions were posed by five different identities. An example of the different morphing levels for one identity is shown in Figure 2
.
Each video frame was created with the FaceGen program
1
and custom VBA code. As stated above, endpoint frames were linear morphs between the 100% anger setting and the 100% fear setting in FaceGen. The remaining frames in each video were linear morphs between the neutral setting and the endpoint. Frames were stitched together in QuickTime Pro and played at 30 frames per second.

Figure 2. Final frames of the movies from all ten different morph levels for one particular identity. From left to right: 0%, 10%, 20%, 30%, 40%, 60%, 70%, 80%, 90%, and 100% anger.
fMRI Paradigm
Subjects were presented with a Type 1, Index 1 sequence (Finney and Outhwaite, 1956
), so that each morph level preceded and followed every other morph level a balanced number of times. This type of sequence allows for the efficient, rapid presentation fMRI designs (Buracas and Boynton, 2002
; Aguirre, 2007
). A different sequence was used for each subject. Pure emotions (0% anger and 100% anger) appeared three times as often as any other morph level in order to increase the classifier training set. Each of the five identities posed each morph level a balanced number of times. The sequence of identities was different for each subject. A total of 420 stimulus trials were shown, along with 30 rest trials during which a fixation cross was shown. Like the stimulus trials, rest trials were included in the Type 1, Index 1 order counterbalancing. Subjects were free to move their eyes around the stimuli. Each trial was preceded by a 3300 ms intertrial interval consisting of a fixation cross (Figure 3
).
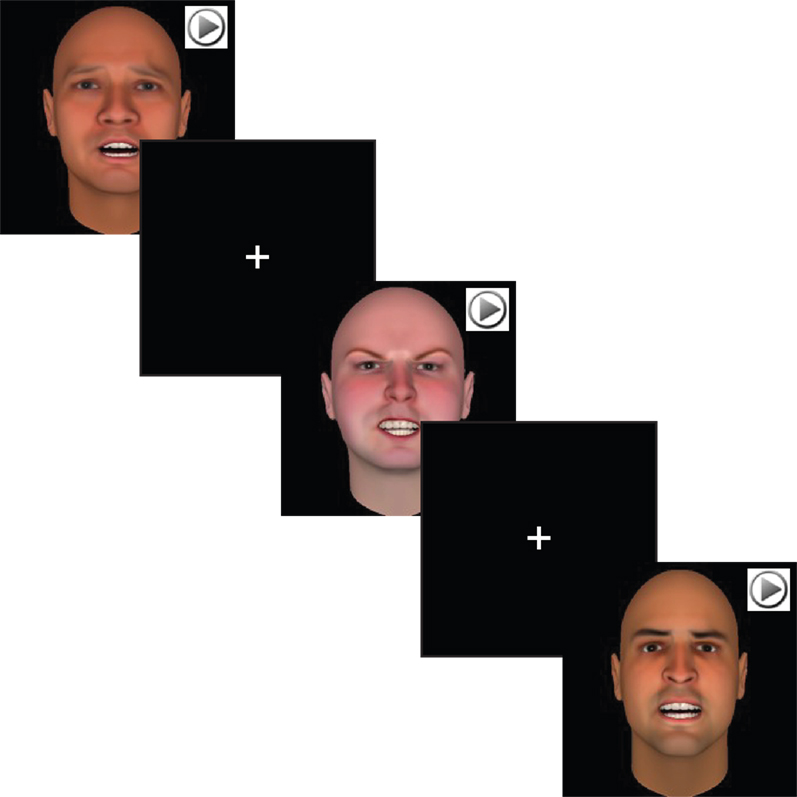
Figure 3. Example of the sequence subjects observed. Each face was separated by a 3-s intertrial interval, and the sequence was Type 1, Index 1 counterbalanced (see Materials and Methods). Video play buttons are shown here for illustration, and were not seen by the subjects. From left to right: 20%, 100%, and 60% anger from three different identities.
To allow subjects to take breaks, the sequence was broken up into five “runs” of 6:50 min each. Each run began with an additional 10 s of fixation to allow the scanner to stabilize, and ended with another 10 s of fixation to allow time to measure the BOLD response from the last trial of the run.
Subjects used their right hand to indicate with a button press whether each stimulus was closer to fear or closer to anger. One button corresponded to fear and the other to anger. To enforce the category boundary, a red X was flashed after any incorrect response and after any miss. These trials were not included in the main fMRI analysis, and were analyzed separately. Subjects were trained on the categories during the anatomical scan, which preceded the functional scans.
fMRI Acquisition
The BOLD signal was used as a measure of neural activation (Ogawa et al., 1990
; Kwong et al., 1992
). EPI images were acquired with a Siemens 3.0-T Allegra scanner (Siemens, Erlangen, Germany) and a Nova Medical head transmit coil with receive-only bitemporal array coils (Nova Medical, Inc, Wilmington, MA, USA). The receive-only array coils were positioned directly on the lateral surface of the head to achieve high signal-to-noise ratio (SNR) from the STS. We acquired 34 interleaved 3.6-mm axial slices with an interslice gap of 0.36 mm (TR = 2000 ms, TE = 20 ms, flip angle = 90°, FoV = 192 mm). Voxel dimensions were 3 × 3 × 3.96 mm3. At the beginning of each scan session, a high-resolution anatomical image was acquired (T1-MPRAGE, TR = 2500 ms, TE = 4.38 ms, flip angle = 8°, FoV = 256 mm).
fMRI Preprocessing
Image preprocessing was performed in Analysis of Functional NeuroImages, commonly known as AFNI (Cox, 1996
). After discarding the first five EPI images from each run to allow the MR signal to reach steady-state equilibrium, the remaining images were despiked using the AFNI program 3dDespike. Images were then slice time corrected and motion corrected to the third image of the first run using a six-parameter 3-D motion correction algorithm. A 3-mm full width at half maximum smoothing kernel was then applied to the images before conversion to percent signal change from the mean.
Neurons in monkey and human STS are sensitive to both facial expression and facial identity (Hasselmo et al., 1989
; Winston et al., 2004
; Calder and Young, 2005
). Thus, analysis of facial expression is made difficult because of extra variance due to effects of facial identity. We removed the effects of facial identity by modeling the BOLD time series with a General Linear Model (GLM) consisting of regressors for each of the six identities, each convolved with a gamma function, as well as six regressors for motion parameters. The residual time series was then extracted for further analysis. We also controlled for the effect of task difficulty by creating a GLM with regressors for very easy (0% and 100% anger), easy (10% and 90% anger), moderate (20% and 80% anger), difficult (30% and 70% anger), and very difficult (40% and 60%) trials.
Next, we modeled the residuals with a GLM consisting of a regressor for every stimulus trial, each convolved with a gamma function. Thus, each trial became associated with a map of parameter estimate values (one parameter estimate for each voxel and trial), which could then be submitted to a classifier. Since we used gamma convolved regressors, the parameter estimate for a particular voxel and a particular trial can be thought of as the weighted sum of fMRI signals shortly after trial onset. We operationally define the neural representation for each trial as this map of parameter estimates.
Anatomical Regions of Interest
Anatomical masks were created by bringing the T1-weighted images into a standard space using the @auto_tlrc program to match the TT_N27 template (Holmes et al., 1998
). The left STS and right STS were hand drawn on coronal slices (Figure 3
) from –64.5 mm to –1.5 mm posterior to the anterior commisure. All anatomical masks were then brought back into original space, multiplied by a separate mask of brain versus non-brain areas, and then applied to the functional data (Figure 4
).
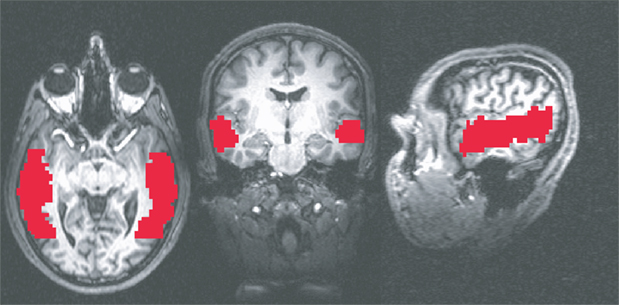
Figure 4. Example of anatomical ROIs from one of the subjects. From left to right: axial, coronal, and sagittal cross sections.
Classifier
Classification was performed on the parameter estimates using the Princeton Multi-Voxel Pattern Analysis Toolbox for Matlab
2
. For both ROIs, a Sparse Multinomial Logistic Regression (Krishnapuram et al., 2005
) classifier was used to measure the neural representations. SMLR is based on logistic regression, but uses a sparsity- promoting Laplacian prior λ to limit the norm of the weight vector and therefore selects only a subset of relevant voxels during training. Based on our observations of classifier performance in a previous study on the STS, we set λ to 0.01 for this experiment. This reduced the number of used voxels by 6% from the total available in the anatomical ROI. To avoid circularity, all decisions about classifier parameters were made before training, and all feature weights were computed before testing.
The classifier was trained to distinguish the neural representations associated with 0% anger from the representations associated with 100% anger. The classifier was then tested on the intermediate morph levels, and its logit output was used as a measure of how much the neural representation for each morph level was similar to the representation of pure anger relative to pure fear. (High logit values indicate the neural representation is similar to the pure anger representation. Low values indicate it is similar to the pure fear representation.) The logit is the weighted sum of the voxel values, where the weights are the regression coefficients. As such, it provides a continuous measure of the classifier’s belief at each trial. It is more appropriate than other measures of a classifier’s belief – such as guess rate – since it is not passed through any nonlinearity, which will bias the results towards categorical representations
3
.
Testing for Categorical and Noncategorical Effects
For each morph level, the classifier provided a measure of the degree to which the brain state was similar to anger relative to fear. Under the strictest hypotheses, the function relating this measure and morph level could either be either a step function (Figure 1
A), implying categorical representations, or a linear function (Figure 1
B), implying graded, noncategorical representations. We fit both of these models to the data using a least squares approach. To compare the models we computed the likelihood ratio, which is a ratio of the probabilities of the data given the two models. The likelihood function for a particular model is
where x is an eight element vector of morph levels, y is an eight element vector of observed brain representation measures, w is an eight element weight vector corresponding to the particular model (either step or linear), β is the inverse variance of the residuals, N is the normal distribution with a mean of zero and a variance of β−1, and T is the transpose operator (Bishop, 2006
). The likelihood ratio is the likelihood for the linear function divided by the likelihood for the step function. Since the functions were not nested, we could not perform the likelihood ratio significance test.
Finally, to ensure that our results were not caused by idiosyncratic properties of our SMLR classifier, we repeated the analysis with a two-layer (no hidden layer) neural network classifier trained with backpropagation (Rumelhart et al., 1986
). The average net input to the anger output unit was used as the measure of neural representation. Higher input values indicated the brain was closer to the pure anger representation. Lower values indicated the brain was closer to the pure fear representation. Unlike output unit activation values, which are passed through a nonlinear activation function, input values provide a measure of neural representations that are unbiased towards categorical representations. In order to minimize the noise effects caused by the random initial weight assignments, we ran the classifier 20 times and averaged the net input values across those 20 iterations.
Behavioral Results
Subjects correctly categorized faces (mean d’ = 2.75) significantly better than chance, t(16) = 23.7, p < 0.05. Discrimination was impaired near the category boundary on the 40% anger and 60% anger faces, but was still well above chance (mean d’ = 1.29, t(16) = 12.58, p < 0.05). Responses are plotted in Figure 5
.
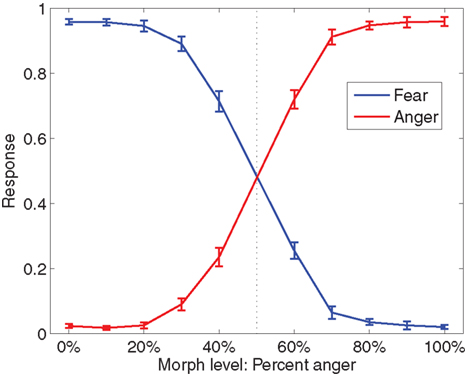
Figure 5. Fraction of anger decisions (red) and fear decisions (blue) at each morph level. The vertical dotted line is the category boundary. Error bars are the standard error of the mean over subjects. Throughout this report, k% anger implicitly means (100-k)% fear.
Reaction times increased as morph levels became more difficult, t(16) = 11.7, p < 0.05, and are reported in Table 1
.
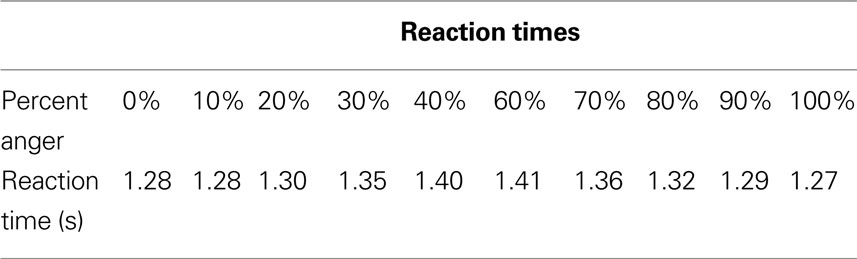
Table 1. Reaction times for each morph level.
fMRI Results
We trained a SMLR classifier to distinguish the neural representation associated with 0% anger from the neural representation associated with 100% anger. We then tested the classifier on intermediate morphs. In this analysis we only considered trials on which the subject made the correct response. Compared to chance classification accuracy (0.500, determined by separately shuffling the labels of the training data and the labels of the testing data 1000 times per subject), overall classification accuracy of intermediate morphs in the bilateral STS was low but significant (M = 0.527, t(16) = 2.57, p < 0.05). This was the case in both the left STS (M = 0.521, t(16) = 2.48, p < 0.05) and the right STS (M = 0.523, t(16) = 2.56, p < 0.05). Finer grained information contained in the logits provided enough signal to test for categorical versus noncategorical representations. Logits are the weighted sums of the features in logistic regression and, unlike classifier guess rates, provide a measure of neural representations that is not biased towards the categorical hypothesis (see Materials and Methods).
In the left STS, there was a significant linear fit relating morph level to neural representation (Figure 6
A; t(16) = 2.67, p < 0.05) as well as a significant step function fit [t(16) = 2.39….]. However, the fact that the step function fit was significant does not imply that it is the best model for the data. To compare the linear function to the step function, we computed a likelihood ratio of 303.7, which means that the observed data was 303.7 times more likely under the linear model than under the step model, thus providing strong evidence for the linear model in this ROI. To confirm that our results were not due to idiosyncratic properties of SMLR, we repeated the analysis using a two-layer (no hidden layer) neural network classifier instead. During testing, the net input of the output unit was used as a measure of the classifier’s belief, with higher values indicating neural representations closer to anger. Again, a high likelihood ratio of approximately 141.7 provided strong evidence for the linear function (Figure 7
A).
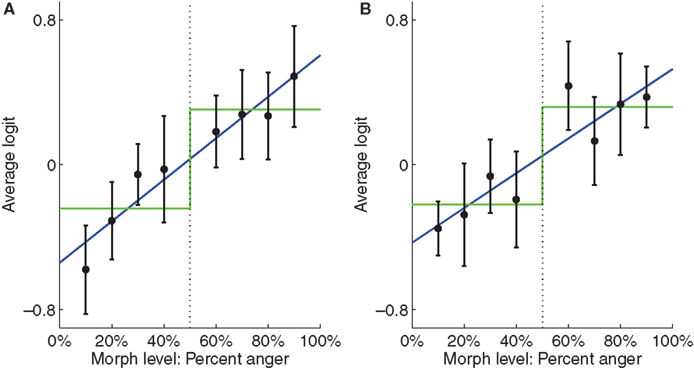
Figure 6. Plots of average SMLR-based logit, which is used as a measure of neural representation against morph level. Low logit values indicate the brain pattern is close to the fear representation. High logit values indicate it is close to the anger representation. Best fit linear and step functions are shown in blue and green, respectively. Error bars are standard error of the mean across subjects. Throughout this report, k% anger implicitly means (100-k)% fear. (A) Left STS. (B) Right STS.
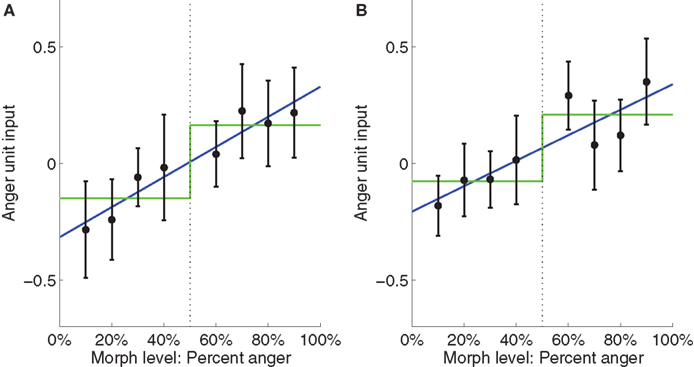
Figure 7. Plots of average neural network input to the anger unit, which is used as a measure of neural representation against morph level. Low activation values indicate the brain pattern is close to the fear representation. High activation values indicate it is close to the anger representation. Best fit linear and step functions are shown in blue and green, respectively. Error bars are standard error of the mean across subjects. Throughout this report, k% anger implicitly means (100-k)% fear. (A) Left STS. (B) Right STS.
In the right STS the SMLR analysis revealed a significant linear fit [t(16) = 2.22, p < 0.05] and a marginally significant step function fit [t(16) = 2.00, p < 0.10]. However, the likelihood ratio computed on the group average data was 0.34, which is weak evidence for the step function (Figure 6
B). In contrast, the neural network analysis showed a weak preference for the linear function, with a likelihood ratio of 2.44 (Figure 7
B). Collectively, the evidence is inconclusive as to whether a step function or linear function best fits the data in the right STS. In both cases, the relationship between neural representation and morph level appeared to show stimulus-related gradations as well as a category boundary.
Error Trials
It is also important to ask whether the representations in the STS track the actual stimulus or the perceived stimulus, as reflected in task responses. To try to answer this, we measured the neural representations during trials in which subjects made an error. Hardly any errors were made for most morph levels, although somewhat more were made near the category boundary at 40% anger and 60% anger (see Figure 5
). We restricted our analyses to these morph levels but, perhaps in part due to the small number of samples, none of these analyses yielded significant results. Using the results from SMLR we found that in the left STS, logits for error trials at 40% anger and 60% anger were both not significantly different from zero (M = −.49, SD = 2.29, t(16) = −.88, p > 0.05 for 40% anger; M = −0.24, SD = 4.21, t(16) = −0.24, p > 0.05 for 60% anger.) The logits for errors at these two morph levels were not significantly different from each other either (dependent t = −0.19, p > 0.05). Similarly for the right STS, neither of the two boundary morph level logits were significantly different from zero (M = −0.52, SD = 3.8, t(16) = −0.56, p > 0.05 for 40% anger; M = −0.52, SD = 3.14, t(16) = −0.69, p > 0.05 for 60% anger.) Again, the logits for errors at these two morph levels were not significantly different from each other either (dependent t = 0.004, p > 0.05). Therefore, due to the relatively small number of error trials, the data may be underpowered to answer whether the STS tracks the actual stimulus or the perceived stimulus.
Univariate Analysis
It is also possible to compare linear and step function fits using a univariate approach. Unlike multivoxel pattern analysis, this approach determines the effect of stimulus level on each voxel individually. For each subject, we used the general linear model to determine the effect of each stimulus level on every voxel. Then, after spatially registering each map of parameter estimates to Talairach space, we tested for linear and step function fits to each voxel’s set of parameter estimates. At a voxelwise cutoff of p < 0.001, no clusters were large enough to pass correction for multiple comparisons for either the linear fit or step function fit. (The largest cluster of 6 voxels was lower than the 16 required for a corrected alpha of 0.05, as determined by Monte Carlo simulations of null hypothesis data with the AFNI program AlphaSim.) Thus, differential responses to stimulus level was best detected with the multivariate approach, and not the univariate approach.
In this study we showed that the multivoxel representations of facial expressions in the left STS are graded and noncategorical. In the right STS, we found evidence for both stimulus-related gradations and a category boundary. We obtained these results in an experiment in which subjects viewed videos of facial expressions, ranging on a continuum from pure fear to pure anger. Subjects were asked to categorize each expression as either fear or anger. A classifier was first trained to distinguish the fMRI patterns of activation for pure fear from the patterns for pure anger, and was then tested on the intermediate morphs. In the left STS, both a SMLR classifier and a neural network classifier showed a linear relationship between morph level and neural representation. In the right STS, the fits were generally more intermediate between a linear function and step function, suggesting both stimulus-related gradations and a category boundary. To the extent that there are differences in laterality, they are similar to recent work on the fusiform gyrus, which shows categorical representations for faces in the right, but not left hemisphere (Meng et al., 2008
). It is unlikely that the emergence of some category information in the right STS was driven by motor responses, since all subjects used their right hand (and therefore their left motor cortex) to control the button box.
The finding that representations in the left STS are noncategorical is similar to findings from research on other posteriors areas (Freedman et al., 2003
; Jiang et al., 2007
) including a multivariate pattern analysis study on moving dots stimuli (Li et al., 2007
). This is also consistent with multivariate work on nonhuman primates showing mostly graded responses in IT cortex to high level stimuli (Meyers et al., 2008
). Here, for the first time, we have demonstrated this multivariate effect in humans using high level stimuli.
One recent paper using fMRI adaptation and bird stimuli has found clusters in the left STS that appear to show stronger categorical representations than we have shown here (van der Linden et al., 2009
). The differences between the results in that study and present study could be due to a number of causes, which are not mutually exclusive. First, the categorical clusters reported in that study were relatively small, with a total volume of 2262 mm3, which is about 7% of the volume of our average anatomical ROI. It is possible that an analysis of that data in the entire left STS would show representations that are less categorical, as we have found here. Indeed, different regions of the STS may include more categorical or less categorical representations than others. Second, subjects in that study received longer training periods than in ours. Perhaps the neural representations in our study would become increasingly categorical with longer training. Future studies could attempt to address this issue. Finally, it is possible that some types of stimuli with natural categories, such as bird species, are represented categorically in the STS, while other types of stimuli that are often found along a continuum in nature, such as facial expressions, are represented less categorically (Susskind et al., 2007
).
In this study, subjects were not required to fixate while viewing the stimuli. While this provides a more ecologically valid setting to study facial expression perception, it opens up the possibility that differential responses to different stimuli were driven in part by the location at which subjects fixated. However, this concern is tempered to some extent by the fact that visual scanning of fearful faces is very similar to visual scanning of angry faces (Wong et al., 2005
). Another potential explanation for our findings is that differences in arousal levels between fear and anger could have driven the differential responses in the STS. In general, fear and anger are associated with similarly high levels of arousal (Russell, 1980
), and so any differences in arousal levels in this experiment are likely to be small. Nevertheless, it is possible, in principle, that this explanation could still explain the data. If so, our main finding of noncategorical representations would remain valid, but the interpretation would shift from one about visual representations to one about arousal levels.
Motion or Biological Motion?
Our study showed mostly linear functions between morph level and distributed representations in the STS. In principle, the population responses could reflect distinctions among facial expressions as well as lower-level aspects of visual motion. Previous fMRI studies have shown STS sensitivity both to motion coherence (Braddick et al., 2000
), and to static facial expressions as compared to neutral expressions (Engell and Haxby, 2007
). The population responses for variations of facial expression may show gradations that reflect subtle variations within coarsely-defined categories, such as anger or fear.
Categorical Representations
If the STS contains mostly noncategorical representations of facial expressions, the question arises of where they are represented categorically, if anywhere. Our targeted surface coil measurements prevented us from obtaining good SNR in brain areas beyond the STS, and so the investigation of other brain areas remains a topic for future research. However, if the results of previous studies on other types of stimuli can generalize to emotional expressions, then it is likely that categorical representations will be found in the PFC (Freedman et al., 2001
, 2003
; Jiang et al., 2007
). At least in the macaque, there are known projections from the STS to frontal cortex (Luppino et al., 2001
).
The authors declare that the research was conducted in the absence of any commercial or financial relationships that could be construed as a potential conflict of interest.
We thank Greg Detre, Joe McGuire, Per Sederberg, Sam Gershman, and Mike Todd for helpful discussions. This work was supported by National Science Foundation Grants BCS-0446846 and BCS-0823749.
- ^ www.facegen.com .
- ^ http://www.pni.princeton.edu/mvpa/ .
- ^ To measure the similarity of neural representations, one of the alternatives to the logit is the fraction of times the classifier guesses anger at each morph level, where on each trial the classifier guesses anger if the logit is greater than zero, and fear if the logit is less than zero. This measure is biased towards categorical representations: Consider a brain with representations that move linearly (and reliably) from fear to an anger as the morph level moves from fear to anger. In this case, the logit will also increase linearly, providing a good measure of the neural representations. However, if these brain states are reliable, the fraction of anger guesses will be a highly nonlinear function of morph level, with a sharp uptick at the threshold, and would artifactually imply categorical representations when none exist.
Kwong, K. K., Belliveau, J. W., Chesler, D. A., Goldberg, I. E., Weisskoff, R. M., Poncelet, B. P., Kennedy, D. N., Hoppel, B. E., Cohen, M. S., Turner, R., Cheng, H., Brady, T. J., and Rose, B. R. (1992). Dynamic magnetic resonance imaging of human brain activity during primary sensory stimulation. Proc. Natl. Acad. Sci. U.S.A. 89, 5675–5679.