1
Department of Psychology, Temple University, Philadelphia, PA, USA
2
Center for Cognitive Neuroscience, University of Pennsylvania, Philadelphia, PA, USA
Perceived distance in two-dimensional (2D) images relies on monocular distance cues. Here, we examined the representation of perceived object distance using a continuous carry-over adaptation design for fMRI. The task was to look at photographs of objects and make a judgment as to whether or not the item belonged in the kitchen. Importantly, this task was orthogonal to the variable of interest: the object’s perceived distance from the viewer. In Experiment 1, whole brain group analyses identified bilateral clusters in the superior occipital gyrus (approximately area V3/V3A) that showed parametric adaptation to relative changes in perceived distance. In Experiment 2, retinotopic analyses confirmed that area V3A/B reflected the greatest magnitude of response to monocular changes in perceived distance. In Experiment 3, we report that the functional activations overlap with the occipito-parietal lesions in a patient with impaired distance perception, showing that the same regions monitor implied (2D) and actual (three-dimensional) distance. These data suggest that distance information is automatically processed even when it is task-irrelevant and that this process relies on superior occipital areas in and around area V3A.
An enduring question in human visual processing is how we recreate a three-dimensional (3D) representation of the environment from the pattern of light on two-dimensional (2D) retinae. Instrumental in this process is the interpretation of distance to estimate object size and to facilitate motor planning. Distance perception
1
is determined by the integration of monocular and binocular cues. Artists have long taken advantage of monocular distance cues to produce realistic depictions of the world in 2D. Landscape paintings have clear representations of the foreground and the distant hillsides. More dramatically, trompe l’oeil paintings such as the compelling ‘dome’ of Rome’s Saint Ignatius church are actually painted on nearly flat surfaces. Thus, the perception of distance can exist when no actual distance information is present.
However, our perception of distance is shaped by more than what meets the eye. Distance perception is modulated by the observer’s ability to traverse such a distance, varying with such things as the weight that is being carried (Proffitt et al., 2003
). Perceptual distance may inform and shape other forms of distance such as temporal distance and social distance (Liberman and Trope, 2008
).
The cortical mechanisms of distance processing have overwhelmingly been studied in the context of stereopsis, or binocular disparity. Disparity-tuned neurons exist in macaque early visual areas (reviewed in Gonzalez and Perez, 1998
), although the extent to which different visual regions contribute to stereopsis is not known. In humans, stereoscopic processing activates a cluster of retinotopic areas in the superior occipital lobe: areas V3A (Backus et al., 2001
; Tsao et al., 2003
), V7 (Tsao et al., 2003
; Brouwer et al., 2005
), and V4d-topo (Tsao et al., 2003
; Brouwer et al., 2005
). More anterior regions such as the caudal intraparietal sulcus, show increased activations as the degree of binocular disparity increases (Rutschmann and Greenlee, 2004
). In some reports, these regions demonstrate greater adaptation to egocentric distance, rather than allocentric distance (Neri et al., 2004
; Neggers et al., 2006
), suggesting that these areas are especially tuned to the relationship between the viewer and the perceived object, as opposed to the relationship between the objects themselves. Convergence and accommodation activate a superior dorsal stream area around the parieto-occipital sulcus (Quinlan and Culham, 2007
). This region also exhibits preferential activity for near objects as compared to far objects, perhaps for the guidance of actions towards targets in peripersonal space (Quinlan and Culham, 2007
).
For objects at farther distances, the visual image remains the same for both eyes and binocular disparity is eliminated, thus stereopsis, convergence and accommodation, are unavailable as distance cues. In this scenario, distance perception is determined by monocular distance cues such as familiar size, occlusion, perspective, texture, motion parallax, and shading. It is not known whether the same cortical regions processing binocular cues also process monocular cues. In one of the few neuroimaging studies to examine this issue, subjects were presented with either a Necker cube or pictorial stimuli lacking depth information, such as two overlapping squares (Inui et al., 2000
). The results showed that depth information in the Necker cube activated lateral temporal-occipital regions, the inferior and superior parietal lobes (see also Nishida et al., 2001
; Iwami et al., 2002
; Naganuma et al., 2005
; Preston et al., 2008
). Single unit studies in monkeys report that interdigitated neural populations in the caudal part of the lateral bank of the intraparietal sulcus are sensitive to the extraction of distance from linear perspective (Tsutsui et al., 2001
) and texture (Tsutsui et al., 2002
). Overall, the literature provides hints that 2D distance processing relies on dorsal stream regions that may be slightly more anterior and superior to those involved in stereopsis.
Although this brief review suggests that the neural substrates of distance perception are well understood, a closer look at neuroimaging data reveals that there is surprisingly low coherence across studies. In Figure 1
, we plotted the peak activations from published studies on binocular and monocular distance perception. Activations are shown throughout the dorsal visual stream, particularly in the occipital lobe and around the intraparietal sulcus.
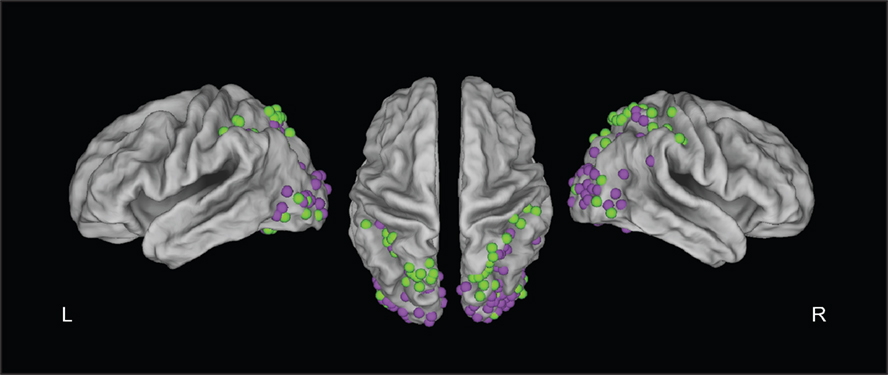
Figure 1. Summary figure of PET and fMRI studies testing monocular (green dots) or binocular (purple dots) stimuli. This figure was constructed by plotting peak activations in CARET software from studies of distance perception that (a) reported peak activations in dorsal stream regions; and (b) reported the results of whole-brain (not ROI-based) analyses. This resulted in 18 studies (Gulyas and Roland, 1994
; Mendola et al., 1999
; Nishida et al., 2001
; Shikata et al., 2001
; Gilaie-Dotan et al., 2002
; Iwami et al., 2002
; Negawa et al., 2002
; Acosta-Mesa et al., 2004
; Richter et al., 2004
; Rutschmann and Greenlee, 2004
; Brouwer et al., 2005
; Naganuma et al., 2005
; Tyler et al., 2005
; Hayashi et al., 2007
; Quinlan and Culham, 2007
; Georgieva et al., 2008
; Hegdé et al., 2008
).
In the present study we asked: is object distance automatically processed during object perception tasks? This question is important because in a typical object, scene, or face perception task, items are used that vary in their perceived 2D distance. For example, a classic fMRI task is to compare faces to houses (e.g., Kanwisher et al., 1997
). To capture the full image of a house, a considerably greater viewing distance is necessary than when photographing a face. It is possible that this difference in perceived distance is processed automatically – shorter distance for faces, further for houses – potentially explaining some of the differing activations observed in such tasks.
To investigate this we used a continuous carry-over adaptation design (Aguirre, 2007
). Previous work has focused on the main effects, the direct responses to stimulus variables such as stereoscopic disparity. In contrast, the continuous carry-over method permits analysis of the effect of one stimulus on a subsequent stimulus. This allows us to identify cortical areas that respond to changes in perceived distance rather than cortical areas preferentially responding to particular distances. In two neuroimaging experiments we measured the effect of neural adaptation on response modulation to a continuous stream of visual stimuli (Grill-Spector et al., 1999
; Kourtzi and Kanwisher, 2001
). In Experiment 3, we compare our neuroimaging findings with the lesion loci of a patient with impaired distance perception. This allowed us to assess whether the activated regions are causally related to 3D distance perception.
Experiment 1: Relative Distance Perception
Participants
Twelve subjects (mean age: 24.2 years, range 21–31; six males) participated. The data from one subject were excluded due to excessive movement. Prior to scanning, the TNO test for stereoscopic vision (Lameris Ootech, Nieuwegein, The Netherlands) was administered in order to ensure that all subjects had normal stereopsis. All subjects performed within the normal range of stereopsis (15–240 min of arc). Subjects in Experiments 1 and 2 were pre-screened to ensure that they were suitable for scanning and all signed informed consent documents. The University of Pennsylvania Internal Review Board approved all experimental protocols.
Stimuli
Forty objects were photographed on a table with a naturalistic background at four different distances from the camera, corresponding to four conditions: 50 cm – Close, 100 cm – Middle Close, 200 cm – Middle Far, 300 cm – Far. An additional condition, the Blank condition consisted of the table and background alone, without any object. Objects were common household items (e.g., toys, office supplies, utensils, pans). These items were identifiable at all distances, this limited objects to approximately 30 cm in height. The average vertical and horizontal visual angle for the objects at each position were the following: Close: 5.1 × 5.1, Middle Close: 2.8 × 2.8, Middle Far: 1.4 × 1.4, Far: 1.0 × 1.0.
The stimuli were tested in four pilot subjects to ensure that viewers perceived the egocentric distance. In 40 trials, two images of different distances (Close, Middle Close, Middle Far, or Far) were presented sequentially for 1000 ms/image. Stimulus distance and order were counterbalanced. The task was to select the item farthest from the viewer. Subjects performed with above 97% accuracy, suggesting that distance information was readily perceived. In a second test consisting of 20 trials (5 times per position), a single image was presented for 1000 ms. Subjects were asked to estimate the perceived viewing distance. Subjects underestimated the distance, but showed appropriate scaling (M Close: 32.3 cm, M Middle Close: 95.3 cm, M Middle Far: 171.5, M Far 249.9 cm).
Procedure
The stimuli were presented continuously. Each stimulus was presented for 1300 ms, followed by the Blank image for 200 ms (see Figure 2
A). The order of stimulus presentation was determined by a five-element m-sequence with fourth-order counterbalancing (Buracas and Boynton, 2002
). The value of the m-sequence indicated which of the four distances would be presented on a given trial, with the fifth element of the sequence indicating the presentation of a blank trial, in which the empty table stimulus was presented for 3000 ms. Blank trials were doubled in duration, as compared to the other stimuli and as such, occupied a complete repetition time (TR, Aguirre, 2007
). An optimal assignment of m-sequence labels to the four distance levels was determined by selecting the greatest predicted statistical efficiency for detection of linear adaptation effects (Appendix A in Aguirre, 2007
). Object presentation was randomly determined.
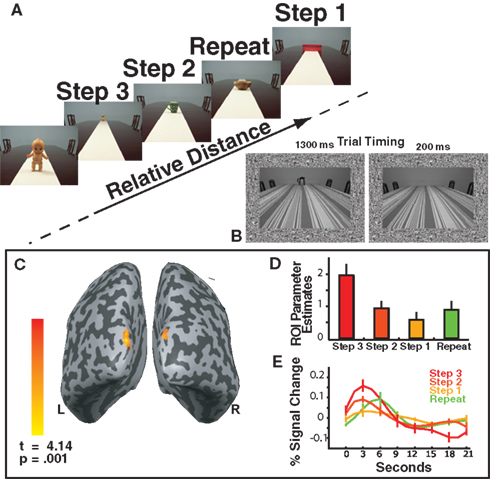
Figure 2. (A) Experiment 1 Task Design. Objects appeared sequentially at four different positions in depth. The labels include the predictors modeled by the relative distance GLM: Repeat, Step 1, Step 2 and Step 3. Note that these conditions exist only in relationship to each other. The inset shows the timing parameters for each trial using example stimuli from Experiment 2. (B) The inset depicts an example of the stimuli used in Experiment 2 and the timing of each stimulus presentation: stimulus (1300 ms) followed by blank (200 ms) for Experiments 1 and 2. (C) The main effect of relative distance as shown by the Step 3 > Repeat contrast. Activations were observed in bilateral superior occipital gyrus (approximately in retinotopic area V3). (D) Bar plots reflect the parameter estimates (beta weights) for the ROI shown in (B) in order to demonstrate the parametric pattern of responses. (E) The time courses for each condition within the ROI defined in (B).
The full m-sequence was divided into three, 6-min 35-ms runs that were each repeated for a total of six runs. There were 250 trials at each distance. Perfect repetitions of distance were presented in 210 trials (Repeat). In 292 trials, the presented distance was within one step of the previous trial (Step Size 1). In 202 trials there was a two-step transition (Step Size 2) and in 100 trials there was a three-step transition (Step Size 3). More trials were one step apart, because there were more sequences of two trials that fit this definition. Only two possible combinations (Close–Far, or Far–Close) were three steps apart.
During scanning, subjects performed an attentional task orthogonal to the variable of interest. Subjects were instructed to indicate on each trial by button press whether the object was kitchen related (20 objects) or non-kitchen related (20 objects). All experiments were conducted using ePrime software (Psychology Software Tools, Pittsburgh, PA, USA).
MRI acquisition
Neuroimaging sessions were conducted at the Center for Functional Neuroimaging at the University of Pennsylvania on a 3.0 T Siemens (Erlangen, Germany) Trio using an eight-channel multiple-array Nova Medical (Wilmington, MA, USA) head coil. Functional T2*-weighted images sensitive to blood oxygenation level-dependent contrasts were acquired using a gradient-echo echo-planar pulse sequence [TR, 3000 ms; echo time (TE), 30 ms; FOV = 22 cm, voxel size, 3 mm × 3 mm × 3 mm; matrix size, 64 × 64 × 45, flip angle = 90°]. Forty-two interleaved axial slices with 3 mm thickness were acquired to cover the whole brain. High-resolution anatomical T1-weighted images were acquired using a 3D magnetization-prepared rapid-acquisition gradient echo pulse sequence (TR, 1620 ms; TE, 3 ms; FOV = 192 mm × 256 mm, inversion time, 950 ms; voxel size, 0.9766 mm × 0.9766 mm × 1 mm, matrix size, 192 × 256 × 160, flip angle = 15°, 160 contiguous slices of 1.0 mm thickness). Stimuli were rear projected onto a Mylar screen at the end of the scanner bore with an Epson (Long Beach, CA, USA) 8100 3-liquid crystal display projector equipped with a Buhl long-throw lens (Navitar, Rochester, NY, USA). Subjects viewed the stimuli through a mirror mounted to the head coil. Responses were recorded using a four-button fiber optic response pad system, of which the outer left and outer right buttons indicated responses.
MRI preprocessing
The fMRI data were analyzed using statistical parametric mapping (SPM2) software (Wellcome Department of Cognitive Neurology, UK implemented in Matlab, Math Works, Natick, MA, USA). The functional images were pre-processed using standard procedures. Functional images were corrected for differences in slice timing then realigned with respect to the first image of the scan and spatially normalized to the Montreal Neurological Institute template. Images were spatially smoothed with an 8-mm full-width at half-maximum Gaussian smoothing kernel. Images were low and high pass filtered. Data were analyzed using a random effects analysis general linear model. Contrasts were false detection rate corrected on the individual subjects’ whole brain data. Threshold was set at p < 0.001 and clusters of 10 voxels were considered significant.
Experiment 2: Same Retinal Size at Different Distances
Participants
Eight subjects (mean age: 26.3 years, range 21–36; five males) participated. Two subjects who participated in Experiment 1 also participated in Experiment 2. Subjects were pre-screened for scanning and all signed informed consent documents.
Stimuli
New stimuli were created to control for retinal subtense. A stereoscopic condition was added to assess cross-adaptation between monocular and binocular distance processing. Conditions 1–4 consisted of object stimuli varying in perceived (monocular) distance. Fourteen series of objects were developed which preserved the retinal size across each distance. Thus, the largest object of a stimulus set was placed at the greatest distance and the smallest item at the closest. Efforts were made to keep each set uniform. For example, one set of kitchen-related items consisted of circular bread-like items: a mini-pita, a bagel, a tortilla and a pizza shell, a second set consisted of four spoons of different sizes. Examples of non-kitchen-related items include handbags and teddy bears of four different sizes. Object photographs were taken on the same table at the same distances used in Experiment 1. A striped tablecloth was used to enhance the sense of distance. The Blank condition consisted of the background alone with no object on the table. Stimuli were converted to grayscale to accommodate the stereoscopic condition.
A fifth condition consisted of stereoscopic stimuli. These were objects depicted in the Close position. There was no background table or tablecloth information; the objects were presented on a 30% gray background for the stereo condition stimuli. Red and green layers were created in Adobe Illustrator CS3 and offset to create anaglyphs. As the purpose of this manipulation was to determine whether the same cortical regions are involved in monocular and binocular distance perception, only one offset was used. All of the stereoscopic stimuli were presented at the same binocular distance cue to the viewer. A grayscale noise border was placed around all the images in all conditions. This promoted a sense of distance for the stereoscopic stimuli. Subjects wore red-green glasses during scanning. The data from these stimuli are not further discussed.
Four participants performed a stimulus test to determine the perceived distance of the stimuli. During each of 40 trials, two images were sequentially presented (1000 ms/image). Stimulus distance and order were counterbalanced. The task was to select the item that was farthest from the viewer. Subjects performed with 94% accuracy, suggesting that distance information was easily determined. In a second test consisting of 25 trials, a single image was presented for 1000 ms. Subjects estimated the perceived viewing distance five times for each stimulus position in randomized order. The results suggested that subjects generally underestimated the distance (M Stereo: 50.1 cm, M Close: 21.5 cm, M Middle Close: 95.6 cm, M Middle Far: 161.5, M Far 432.8 cm), but appropriately ordered the stimuli. This stimulus check confirmed that stimuli were perceived at different distances.
Procedure
A new m-sequence was divided into six 7-min 15-s runs. For each subject, the order of positions remained constant, but the object presentation was randomized. There were 156 Repeat trials, 238 Step Size 1 trials, 161 Step Size 2 trials and 74 Step Size 3 trials. The transitions between stereoscopic and flat images were tallied separately. The stereo and Close stimuli consisted of the same objects at the same size. Subjects performed the kitchen (7 sets, 28 objects)/non-kitchen (7 sets, 28 objects) categorization task used in Experiment 1.
MRI acquisition
One modification was applied to the parameters described for Experiment 1. Because we included a fifth stimulus type, the duration of each run was increased to 145 TRs.
MRI preprocessing
The neuroimaging data were analyzed using Brain Voyager QX software (Brain Innovation, Maastricht, The Netherlands). Preprocessing included correcting functional images for differences in slice timing. Images were realigned with respect to the first image of the scan and spatially normalized to the Talairach template. The coregistration process was conducted manually for retinotopic scans and functional scans. Images were not spatially smoothed. Images were low and high pass filtered. Two runs were eliminated due to movement.
MRI retinotopy
For this experiment, an additional series of scans showing expanding rings, clockwise or counterclockwise wedges were collected in order to perform retinotopy. For these scans, the TR was 2000 ms and 33 slices were collected. An expanding ring (2 Hz flickering, black-and-white checkerboard presented on a black background) was used to map the representation of eccentricity. Each ring subtended approximately 1° of visual angle. Subjects maintained central fixation, while the ring expanded into the periphery, in 10 eccentricity steps, each lasting 2000 ms (one TR). The annulus completed 14 cycles of expansion during each scan, each cycle commencing with the smallest, central annulus. Each subject performed at least three runs of 4 min 50 s in duration. Rotating 45° bow-tie shaped wedges (also 2 Hz flickering checkerboard) were used to map the polar angle of both hemispheres simultaneously. Subjects observed at least three runs with the wedges moving clockwise, and at least three runs with the wedges moving counterclockwise; runs lasted 4.50 min. The wedges completed 34 cycles per run. The runs for rings, clockwise wedges and counterclockwise wedges were averaged separately. The retinotopic runs were collected following the functional runs.
The gray-white matter boundaries were automatically determined by BrainVoyager (BrainInnovation) then amended by hand. Flattened cortical meshes were produced and activations projected on these flat maps for the ring, clockwise and counter-clockwise wedge data. The ring runs were averaged together and a correlation map identified the degree of correlation between ring phases. This process identified the cortical representation of the fovea. The correlation maps between the phases of the clockwise wedge runs were used to identify seven retinotopic areas (V1, V2d, V2v, V3d, V3v, V4, V3A/B); the counterclockwise wedge series was used to verify these regions. Retinotopic areas were defined as masks on the basis of standard criteria (Sereno et al., 1995
). We assumed a contralateral quadrant representation for V1, V2d, V2v, V3d, and V3v and a contralateral hemifield representation for V4v and V3AB (Tootell et al., 1997
). We could not reliably separate areas V3A and V3B and are referred to as area V3A/B.
Experiment 3: Comparing Neuroimaging and Neuropsychology Findings
Participants
Patient EE555 is a 40-year-old former teacher who suffered three infarcts in the watershed between the posterior and middle cerebral arteries. She has symmetrical bilateral occipito-parietal lesions that do not impinge on the calcarine sulcus or ventral visual stream. She demonstrates grossly abnormal utilization of binocular and monocular distance cues for estimating distance (Berryhill et al., 2009
); see Table 1
. In contrast, she has normal visual acuity and object recognition. Two healthy control subjects were tested (mean age: 45.5 years, mean years of education: 17; one male).
Stimuli and procedure
The stimuli from Experiment 1 were used. During each trial, two images were presented sequentially for 1000 ms each. In one block of 20 trials, the task was to report which item was a kitchen-related object. In a second block of 40 trials, the task was to report which item was placed farther away. The correct response was equally likely to be the first or the second image (chance = 50%). All changes in step size (Step Sizes 1, 2, 3) were present in both blocks, however repetitions of object position were not included. Three of EE555’s distance judgment trials were lost. Patient EE555 performed a preliminary series of kitchen judgments (40/40 correct) demonstrating that she was able to see both objects presented in a trial.
Experiment 1: Relative Distance Perception
Behavioral performance
The accuracy in the object categorization task was high (mean accuracy = 95.4%) and rapid (mean RT = 652.1 ms) indicating that subjects attended to the object. A t-test comparing the first and second halves of the session showed no differences in performance (p-values >9.18) indicating that subjects remained attentive throughout the session.
Perceived distance
The purpose of this analysis was to identify regions sensitive to changes in perceived distance as shown by adaptation (see Aguirre, 2007
for a comprehensive discussion). In a whole-brain analysis examining adaptation effects, four regressors modeled trial-wise neural responses as a function of context. Trials were modeled as Repeats (e.g., Close–Close), Step Size 1 (e.g., Close–Middle Close), Step Size 2 (e.g., Middle Far–Close) or Step Size 3 (e.g., Close–Far). Additional covariates modeled the main effect of stimulus presentation, subject response, and the context effect of stimuli following Blank trials. This model collapses across the absolute distance, as well as the visual features of each object, to determine which cortical regions track changes in perceived distance. In other words, it measures relative distance.
As only monocular distance cues were available the main effect of relative distance is demonstrated by the Step 3 > Repeat contrast. This contrast identified areas showing reduced neural activity when the perceived distance signal was repeated. Two bilateral activation clusters were identified in the superior occipital gyrus (see Figure 2
B). The retinotopic overlay estimates that these activations correspond to retinotopic area V3d dorsal (V3d, MNI coordinates: right 12, −98, 24; left −12, −93, 21). This assessment is verified by inspection of Dougherty et al.’s (2003)
description of V3d. When the threshold was reduced to p < 0.01 (FDR corrected), activations extended into more dorsal regions including area V3A.
Region of interest analysis
The two clusters of dorsal superior-occipital activations (Figure 2
B) were defined as a region of interest (ROI). Within this ROI, we determined the parameter estimates (beta weights), a measure of effect size for the conditions of the perceived relative distance model (Figure 2
C). The ROI reflected a parametric response pattern as a function of step size. The height of the peak response for each step size increased as the change in perceived distance increased. Voxels in the ROI responded to the perceived relative distance model in a parametric manner based on the change in perceived distance (Figures 2
D,E).
Experiment 2: Same Retinal Size at Different Distances
Behavioral performance
The overall accuracy in the behavioral object categorization task was good (mean accuracy = 88.63%) and rapid (mean RT = 639.42 ms) indicating that subjects attended to the stimuli. There was no significant difference between the first and second halves of the session in performance (p-values >0.25) indicating that subjects remained alert.
Perceived distance
To identify which retinotopic areas tracked changes in perceived distance a set of four regressors modeled trial-wise neural responses as a function of context. Regressors modeled trials as Repeats, Step Size 1, Step Size 2, or Step Size 3. Additional covariates modeled the subject response, and the context effect of stimuli following Blank trials. This model was evaluated in each of the defined retinotopic regions (V1, V2d, V2v, V3d, V3A/B, V3v, V4), collapsing across hemisphere. The resulting parameter estimates (beta weights) were corrected for serial correlations then normalized per person per retinotopic region to eliminate between-subject variability. Thus, the bar plots shown in Figure 1
reflect the relative pattern of responses to the four key conditions and sum to the value of 1. Negative values do not reflect deactivations. These normalized parameter estimates (z-scores) were subjected to a repeated measures ANOVA per region.
This analysis identified which retinotopic regions in early visual cortex were sensitive to changes in perceived distance as shown by adaptation. Although there were similar patterns in areas V1 (F3, 18 = 2.30, p = 0.11), V2d (F3, 18 = 2.73, p = 0.15), and V3d (F3, 18 = 3.42, p = 0.14), only area V3A/B showed a significant difference between carry-over effects (F3, 18 = 4.75, p = 0.01); see Figure 3
. Bonferroni corrected pairwise comparisons revealed a significant difference such that Step Size 3 > Step Size 1 (p = 0.05). Little modulation was observed in ventral regions V2v (F3, 18 = 0.12, p = 0.74), V3v (F3, 18 = 1.15, p = 0.36), and V4 (F3, 18 = .43, p = 0.73). Time courses were also derived and can be viewed in Figure S1 in Supplementary Material.
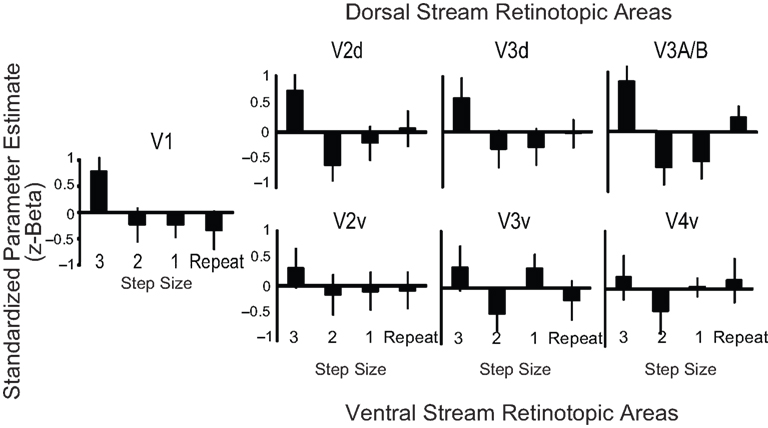
Figure 3. Retinotopic analysis of monocular cue adaptation. The bar plots indicate the normalized parameter estimates (z-beta weights) for the Step Size 3, Step Size 2, Step Size 1 and Repeat conditions for each of the seven retinotopic regions we defined. The plot reveals the pattern of responses to each condition.
Experiment 3: Comparing Neuroimaging and Neuropsychology Findings
The results shown in Figure 4
demonstrate that although patient EE555 was not impaired at determining whether the object belonged in a kitchen (95%, z = 0.24), she was clearly impaired when determining which of two objects was farther (70%, z = −33.88). Control subjects performed both tasks with high accuracy (kitchen: 92.5%; distance: 98.8%).

Figure 4. (A) Patient EE555’s lesions and the clusters that demonstrated adaptation to repetitions of perceived depth. The activation threshold has been lowered to p = 0.01 for illustration purposes. (B) Experiment 3 performance for the object selection task on the left, and the distance selection on the right.
In two neuroimaging experiments we investigated cortical responses to monocular distance cues in 2D images. We applied the continuous carry-over adaptation design, which permits analyses of main effects of a stimulus dimension as well as the effect of one stimulus on another (Aguirre, 2007
). In Experiment 1, subjects observed a sequential series of objects appearing at one of four perceived distances and performed an orthogonal object categorization task. The same objects appeared at all locations to keep visual stimuli constant. In Experiment 2, new stimuli were used to control for retinal subtense. In a series of whole brain and retinotopic analyses we addressed experimental questions assessing cortical responses to changes in perceived distance processing in the brain. In Experiment 3, we demonstrated convergence between the whole-brain neuroimaging activations and neuropsychological findings in a patient who cannot accurately estimate object distance.
In Experiments 1 and 2, we identified brain regions adapting to changes in perceived distance. The logic of this analysis is that stimuli processed by a common neural population can be expected to show partial adaptation to similar stimuli, in proportion to the amount of representational overlap (Aguirre, 2007
). In the whole-brain analysis of Experiment 1 and in the retinotopic analyses of Experiment 2, parametric adaptation effects were found for changes in perceived distance. For example there was greater adaptation for Step 1 trials than Step 2 trials, regardless of whether the transition was from Close to Far or Far to Close. We found robust bilateral superior occipital gyrus activations, corresponding to an area tentatively described as V3d/V3A. Retinotopic analyses in Experiment 2 identified a trend in earlier visual areas, with the greatest magnitude of response adaptation in V3A/B. This finding shows that collections of neurons (Reddy and Kanwisher, 2006
) represent continuous changes in perceived distance. As such, these neurons do not appear to be narrowly tuned to distance changes of a particular magnitude, but rather, they are more broadly tuned (Dobbins et al., 1998
).
In Experiment 3, we provided a qualitative comparison between the clusters of interest and the lesions of a patient with bilateral occipito-parietal damage due to stroke. It has long been known that bilateral occipito-parietal lobe damage can disrupt distance judgments, whether using monocular or binocular distance cues (Holmes and Horrax, 1919
; Critchley, 1953
). The superior occipital clusters of activity observed in Experiment 1 overlapped with occipital portions of the patient’s lesion. The overlap provides two key pieces of information. It suggests that superior occipital regions play a causal role in distance perception. It also suggests that virtual distance perception, as assessed in the present fMRI study and those of others using 2D displays, and physical 3D distance perception, as assessed clinically in patient EE555, occurs within the same cortical regions. These predictions are borne out by EE555’s poor performance when judging the perceived distance of objects in 2D displays.
Updating Distance Information: Monocular and Binocular Distance Cues
The present findings allowed us to assess the process by which distance information is updated. The present findings indicate that an area previously implicated in stereopsis, retinotopic area V3A (Dougherty et al., 2003
), maintains a representation of changes in perceived distance between monocular to monocular and between monocular and binocular cues. This finding accords well with findings in the primate literature. In macaques, V3d sends projections upstream to area V6, in humans the putative homolog of this is now also termed V6 and is located in the medial parieto-occipital sulcus (Pitzalis et al., 2006
) caudal to the intraparietal sulcus (Adams, 1997
). In a recent article, Tsutsui et al. (2005)
suggest that binocular and monocular cues converge in caudal intraparietal areas. This caudal intraparietal area responds in a parametric manner with increasing binocular disparity (Rutschmann and Greenlee, 2004
). The present study suggests that monocular and binocular distance information is integrated in a slightly inferior area, area V3A/B. We note that our retinotopic paradigm was unable to distinguish between areas V3A and V3B. Further work will be important in distinguishing between these two closely associated regions.
Last, we would like to note that distance information in both tasks was largely unattended and irrelevant to the behavioral task yet was processed automatically. This is consistent with the view that the visual system weighs available distance cues and then incorporates them into a single representation of distance, regardless of whether they are monocular or binocular (Bruno and Cutting, 1988
; Landy et al., 1995
). The mechanism and location of these interactions remains unclear.
Alternative Explanations
The present data are not confounded by cortical activity related to motor preparation or eye movements because the same motor response was required for all trials, and eye movements were freely made to objects and/or backgrounds on every trial. The contrasts presented here always compared presentations with objects, so it is not the case that the results are confounded by different patterns of eye movements for the blank condition. It should also be noted that the observed activations are inferior to dorsal parietal regions associated with motor planning and execution (Corbetta and Shulman, 2002
; Buneo and Andersen, 2006
).
Some other concerns deserve more scrutiny however. For instance, in Experiment 1 it is possible that changes in object size, which correlated with some object’s perceived distance, accounted for the observed pattern of activations. A strength of the continuous carry-over model is it generally removes the effect of a confounded variable, such as object size. This is because the analysis collapses across these factors by examining relative changes in perceived distance as opposed to absolute changes. For example, the change from Close to Middle Close was considered a Step 1 trial, but so was the change from Far to Middle Far. The bilateral superior occipital-gyrus clusters may be responding to changes in perceived distance, and not size, across trials. However, a lingering concern remains due to the Step Size 3 condition, which only included Close and Far transitions. This condition showed the greatest change in stimulus size and the least adaptation. To counter these deficits, the stimuli in Experiment 2 removed the size confound by maintaining the retinal size of object sets. Experiment 2 confirmed the importance of area V3A/B, but also demonstrated a steady increase in the magnitude of the response to large changes in distance progressing in the dorsal stream from V1 to V3A/B. Further research is needed to determine the contributions of early visual areas to distance perception.
There are also concerns related to attention. In adaptation paradigms, it is important to examine whether a reduction in activation is due to a reduction in attention to the second stimulus. The present study generally avoids this confound, mostly because the distance manipulation was task irrelevant. Subjects were instructed to attend to the object, but were not told to attend to the location of the object. Moreover, the repetition trials repeated the perceived distance but not the object. Because different objects were presented in sequential presentations it is unlikely that the subjects’ attention waned.
Repeat trials can at times paradoxically serve to attract attention because they are uncommon events (Summerfield et al., 2008
). As noted earlier, our Repeat condition varied the object, but maintained the object location, thus in our task, location repetition may have captured attention. This may explain why there was a relatively larger response to Repeat trials, as compared to Step Size 1 trials in Experiments 1 and 2 for certain ROIs. Current theories of adaptation disagree as to the contribution of top-down and bottom-up attention (reviewed in Grill-Spector et al., 2006
).
Representing Distance
The present data suggest that perceived distance is represented in dorsal visual areas. This conclusion is drawn because we observed a scaled degree of habituation responses corresponding to the level of change in perceived distance (Aguirre, 2007
). In the non-human primate literature, neurons in regions in V3d are tuned to binocular disparity (Poggio et al., 1988
; reviewed in Gonzalez and Perez, 1998
; Roe et al., 2007
). We speculate that this tuning may be based on the integrated binocular/monocular distance signal and that this signal extends to perceived distance. Responses across millions of neurons can then encode the perceived distance of the 2D image.
The authors declare that the research was conducted in the absence of any commercial or financial relationships that could be construed as a potential conflict of interest.
We thank Geoffrey Aguirre, Russell Epstein and Sean McEvoy for helpful discussions. We also thank Ze Wang, Daniel Drucker, Alison Harris, Gideon Caplovitz and Seth Bouvier for help with analyses, and Marianna Stark and Branch Coslett for assistance in testing patient EE555. We thank Cara Shay for help with CARET software. This project was supported by the National Institutes of Health: RO1 MH071615 to Ingrid R. Olson and NRSA NS059093 to Marian E. Berryhill as well as NS045839 to the Center for Functional Neuroimaging at the Hospital of the University of Pennsylvania.
The Supplementary Material for this article can be found online at http://www.frontiersin.org/humanneuroscience/paper/10.3389/neuro.09/043.2009/
- ^ We use distance to refer to the perception of space between the viewer and the object viewed. This is in contrast to depth, which refers to the dimensions of the object viewed.
Acosta-Mesa, H.-G., Cruz-Ramírez, N., Frisby, J. P., Zheng, Y., Buckley, D., Morris, J., and Mayhew, J. E. W. (2004). Digital image processing of functional magnetic resonance images to identify stereo-sensitive cortical regions using dynamic global stimuli. In Advances in Artificial Intelligence - IBERAMIA 2004, C. Lemaître, C. A. Reyes and J. A. González, eds (Berlin, Springer), pp. 572–581.
Tsao, D. Y., Vanduffel, W., Sasaki, Y., Fize, D., Knutsen, T. A., Mandeville, J. B., Wald, L. L., Dale, A. M., Rosen, B. R., Van Essen, D. C., Livingstone, M. S., Orban, G. A., and Tootell, R. B. (2003). Stereopsis activates V3A and caudal intraparietal areas in macaques and humans. Neuron 39, 555–568.