Article Text

Abstract
Background Mutations in endothelin 3 (EDN3) and endothelin B receptor (EDNRB) genes cause terminal colonic aganglionosis in mice, and mutations in these genes have also been linked to the terminal aganglionosis seen in human Hirschsprung’s disease. However, details of EDN3 expression during embryogenesis are lacking, and consequently the cellular mechanism by which EDN3 regulates innervation of the terminal gut is unclear.
Aims To localise the expression of EDN3 and EDNRB in the embryonic mouse gut.
Methods Expression of EDN3 and EDNRB mRNA was analysed by reverse transcription polymerase chain reaction and in situ hybridisation.
Results High levels of EDN3 mRNA expression were restricted to mesenchymal cells of the caecum before and after the arrival of neural crest cells. In contrast, EDNRB expression along the gut displayed a time dependent pattern similar to those of the protein tyrosine kinase ret and the neural crest cell marker PGP9.5.
Conclusions Mesenchymal cells of the caecum express high levels of EDN3 mRNA during embryogenesis and hence the production of EDN3 at the caecum is likely to act on neural crest cells as a paracrine factor necessary for subsequent innervation of the terminal gut.
- endothelin 3
- embryogenesis
- enteric nervous system
- neural crest cells
- gene expression
Abbreviations
- EDN1
- endothelin 1
- EDN2
- endothelin 2
- EDN3
- endothelin 3
- EDNRA
- endothelin A receptor
- EDNRB
- endothelin B receptor
- ENS
- enteric nervous system
- GDNF
- glial cell line derived neutrotrophic factor
Statistics from Altmetric.com
During embryogenesis, the precursor cells of enteric neurones migrate from the vagal neural crest into the foregut, from where they move caudally through the mesenchyme of the gut tube.1 ,2Some of the factors regulating development of the enteric nervous system (ENS) have recently been identified by both natural and experimental gene mutations. Thus, deletion of the mouse gene for the tyrosine kinase receptor RET3 or its ligand GDNF (glial cell line derived neutrotrophic factor)4 both lead to intestinal aganglionosis, whereas a more restricted aganglionosis limited to the distal gut occurs after inactivating mutations of the genes coding for the endothelin B receptor (EDNRB) or its ligand, endothelin 3 (EDN3).5 ,6 The terminal aganglionosis in these mutant mice is similar to that seen in human Hirschsprung’s disease, and mutations in human EDNRB and EDN3 genes have been linked to the disease (for review see Kusafuka and Puri7). Lethal spotted and piebald lethal mice have naturally occurring mutations in EDN3 and EDNRB, respectively,5 ,6 and it has been shown that the progression of the neural crest cells through the gut appears normal up to the ileocaecal junction in these mice. At this point, however, there is a delay in cell migration and the retarded colonisation of the colon proceeds in an abnormal and incomplete fashion, leaving the terminal gut aganglionic.1 ,8 ,9
The endothelins are a family of at least three 21 amino acid peptides coded by distinct genes and are synthesised as larger precursor molecules that have to be cleaved to produce the biologically active peptides, endothelins 1, 2, and 3 (EDN1, EDN2, and EDN3, respectively) (for review see Rubanyi and Polokoff10). At least two receptors have been identified, the endothelin A receptor (EDNRA) that predominantly binds EDN1, and the endothelin B receptor (EDNRB) that has similar affinities for EDN1, EDN2, and EDN3.10 In the adult, the distribution of EDN3 is widespread, having been detected in brain, kidney, lung, spleen, stomach, and intestine.11Although EDN3 affects ENS embryological development, there are no reports documenting its prenatal localisation. Recently, EDN3 and EDNRB mRNA expression has been reported in fetal human enteric mesenchyme and neural crest cells, respectively.12 However, the EDN3 and EDNRB were not expressed in the same region of gut during the restricted developmental period studied, limiting the inferences that may be made from these observations. Here we present the results from in situ hybridisation and reverse transcription polymerase chain reaction (RT-PCR) studies in mouse, showing that high levels of expression of EDN3 are restricted to mesenchymal cells of the caecum prior to, during, and after neural crest cells have reached this part of the gut. As EDNRB is expressed by enteric neural crest cells, taken together these observations support a paracrine role for EDN3 by which a transient interaction with neural crest cells at the caecum regulates subsequent development of the ENS in the distal colon.
Materials and methods
ANIMALS
Six to eight week old CD1 mice were time mated and the plug date counted as day 0 post coitum (dpc). Pregnant mice were killed by cervical dislocation and after dissection, the uteri were kept in ice cold Dulbecco modified Eagle (DME) tissue culture medium (Life Technologies, Paisley, UK) for in situ hybridisation, or in DME medium at 37°C for RT-PCR and immunohistochemistry, until all the embryos were dissected. Embryos were subsequently handled in three ways: (1) for whole mount in situ hybridisation, specimens were fixed in 4% (wt/vol) paraformaldehyde in 0.1 M phosphate buffered saline (PBS) for four to six hours, then rinsed in PBS for 18 hours prior to dehydration though a graded series of methanols (25%, 50%, 75%, 100% methanol) and storage in methanol at −80°C; (2) for immunohistochemistry, specimens were fixed as above and then cryoprotected by immersion in 15% (wt/vol) sucrose in PBS for 24 hours and embedded in 7.5% (wt/vol) gelatine,13 prior to freezing with isopentane/liquid nitrogen; (3) for RT-PCR, the gut was divided into proximal and distal segments. As vagal neural crest cells reach the ileocaecal junction and colonise the caecum by 12 dpc,9the proximal segment consisted of small intestine and caecum and the distal segment consisted of the colon to allow comparison of gut samples with and without vagal neural crest cells. Specimens were immediately frozen on dry ice and stored at −80°C until RNA extraction.
IMMUNOHISTOCHEMISTRY
Cryostat sections (10 μm) were incubated for 18 hours with antiserum to PGP 9.5 (Ultraclone Ltd, UK) diluted 1/4000 in PBS as a marker for neuroblasts.14 After washing in the same buffer, bound antibodies were detected using biotinylated goat antirabbit immunoglobulin and FITC labelled streptavidin (Vector Ltd, London, UK).
REVERSE TRANSCRIPTION POLYMERASE CHAIN REACTION
Gut segments of 1–10 mg wet weight were homogenised in 0.5 ml Trizol reagent following the manufacturer’s instructions (Life Technologies Ltd, Paisley, UK). Glycogen 10 μg (Boehringer Mannheim, Lewes, UK) was added to the extracted aqueous phase RNA as a carrier. The RNA pellet was stored in 75% ethanol at −20°C and dissolved in diethylpyrocarbonate treated water immediately before use.
Approximately 5 μg RNA was reverse transcribed in a reaction volume of 20 μl using random hexamer primers (Pharmacia Biotech AB, Uppsala, Sweden) and Superscript II reverse transcriptase (Life Technologies, Paisley, UK), according to the supplier’s instructions. The reaction was stopped by heat inactivation at 70°C for 15 minutes.
The oligonucleotide primer pairs used for the PCR reactions are as follows, in each case indicating the Genbank accession number, position of primers and size of PCR product: EDN3 (U32330), sense 593-AAA CAA GAG GAC AAG GGG-610, antisense 836-CCA TAC AAG TAC AAC GCA AG-817, 244 bp; EDNRB (U32329), sense 712-GAG CTG AGA TGT GTA AGC TG-731, antisense 889-GAG ACC ACC CAA ATT AAA AC-870, 178 bp; ret (X67812), sense 2281-CTG AAA GAR AAC GCC TCC-2298, antisense 2381-GCC CCA TAC AAC TTG ATG-2364,101 bp; GAPDH (M33197), sense 48-GGT GAA GGT CGG WGT CAA CGG-68, antisense 548-GGT CAT GAG YCC TTC CAC GAT 568, 520 bp. In addition to the 178 bp product from cDNA, the EDNRB primers also amplified the 380 bp genomic sequence (not shown). The absence of this genomic band in the cDNA preparations was therefore used as an indicator for the lack of genomic DNA contamination in the RNA preparations. The identity of the amplified products was confirmed in all cases by automated sequencing by the Sanger dideoxy chain termination method using an Applied Biosystems Sequencer.
cDNA was amplified using recombinant Taq polymerase (MBI Fermentas, Lithuania). The reaction volume of 25 μl contained 0.5 units Taq, 200 μM dNTPs, 1 mM MgCl2, and 0.5 μM of each primer in the buffer supplied by the Taq manufacturer. The reaction mixture was assembled in bulk for all the samples in each experiment, and then aliquoted into reaction tubes containing the cDNA before adding 50 μl mineral oil. Tubes were then placed into the preheated thermal cycler (Perkin Elmer Cetus) at 94°C for two minutes before starting the cycling programme; the denaturation, annealing, and elongation phases were each for one minute. For every primer pair, preliminary experiments were carried out to determine the optimal annealing temperature, the cycle numbers during which the amplification reaction was in the exponential phase, and the concentration range of cDNA in which the amounts of PCR product were non-saturating. In particular, the annealing temperatures were chosen in order to maximise amplification yields while maintaining specificity of the PCR reaction so that only the single identified bands were detected by ethidium bromide staining after separation of PCR products by agarose gel electrophoresis (see fig 1). The cycle numbers and annealing temperatures selected for the primer pairs were: GAPDH: 20 cycles, 51°C; EDN3: 30 cycles, 51°C; EDNRB: 27 cycles, 51°C; RET: 27 cycles, 53°C. The PCR products were resolved on 2% (wt/vol) agarose gel electrophoresis and the ethidium bromide stained bands photographed. The bands from individual experiments were then quantitated by densitometry of the photographs using an LXB Ultroscan Laser Densitometer (LKB-Pharmacia, Uppsala).
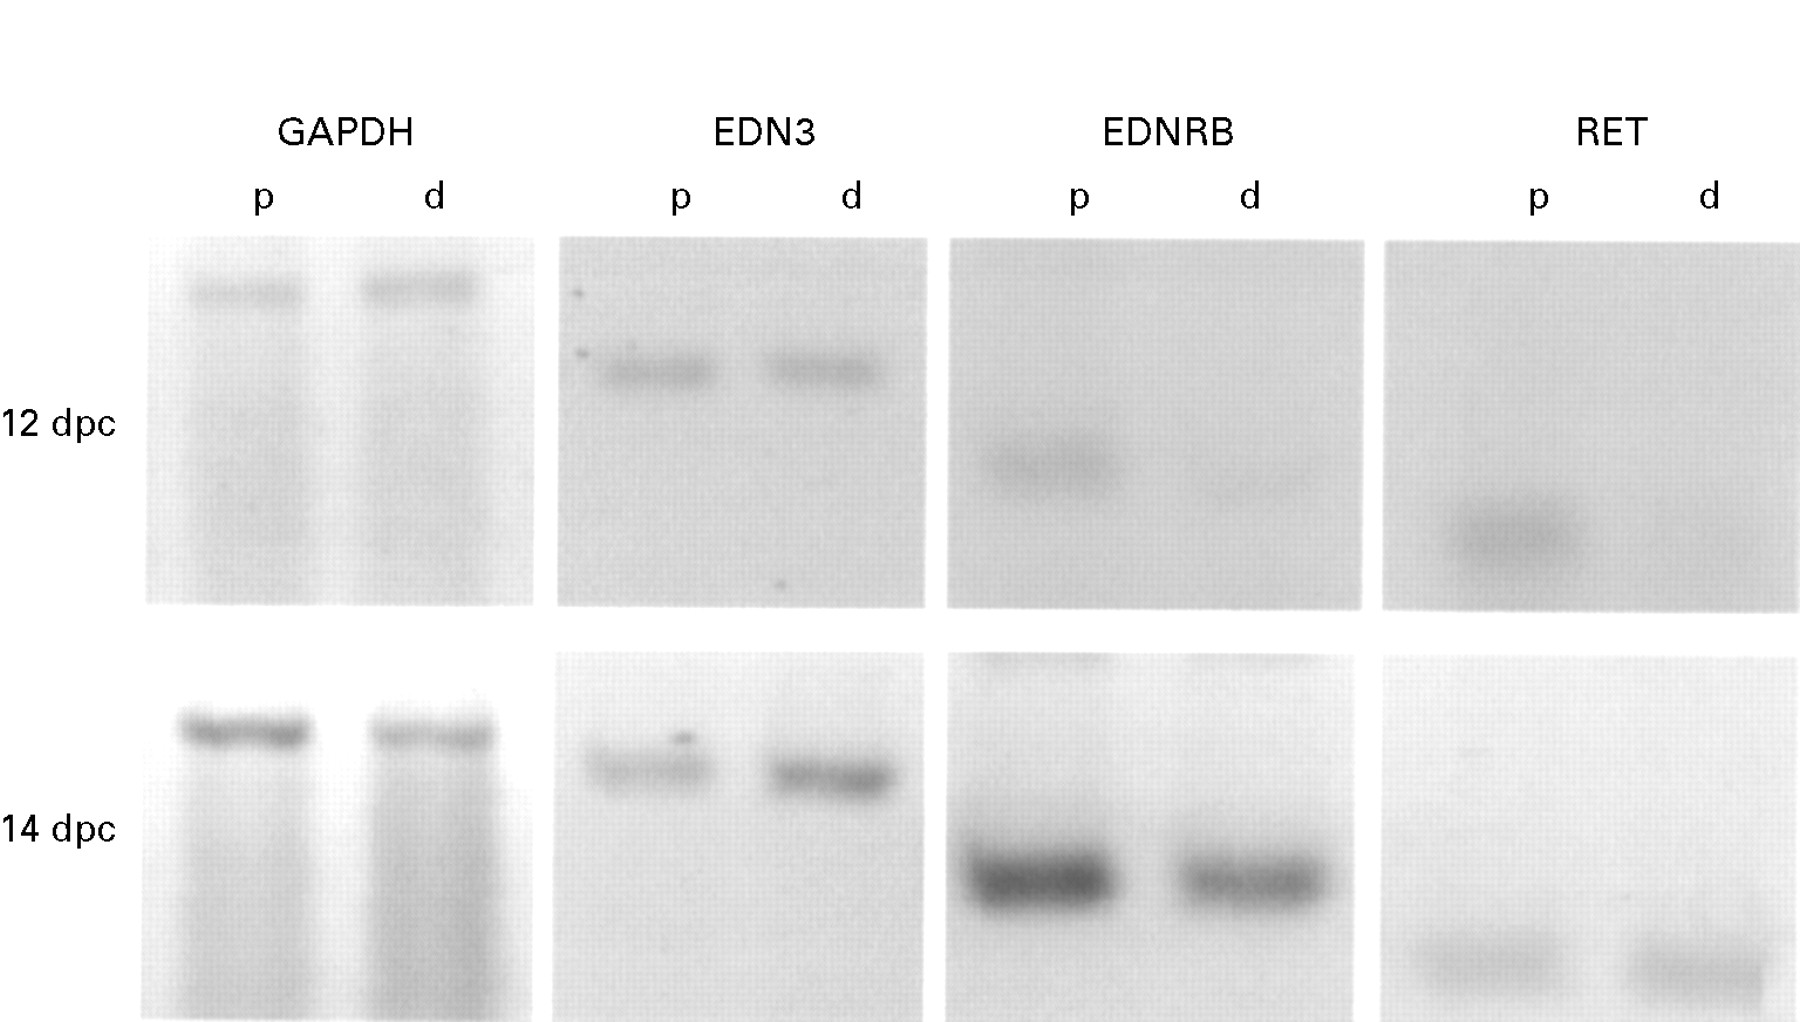
Semiquantitative RT-PCR of GAPDH, EDN3, EDNRB, and RET mRNAs extracted from proximal and distal mouse intestine at 12 and 14 dpc. Bands are shown from dilutions where the signals were proportional to the amount of cDNA used, the amount of sample used being normalised using the level of the GAPDH signal. Note that the EDN3 signal is present in the distal gut (d) at both 12 and 14 dpc at a level similar to or higher than that in the proximal gut (p). In contrast, the EDNRB and RET signals are relatively low in distal gut at 12 dpc and only become similar to those of the proximal gut at 14 dpc.
IN SITU HYBRIDISATION
Whole mount in situ hybridisation with digoxigenin labelled single stranded cRNA probes was performed as described previously,15 all modifications being noted below. The probes were constructed using the pGEM-T vector (Promega, Southampton, UK) into which were inserted the EDN3 RT-PCR product amplified with primers (sense) 463-TGA AGC TGG ATC AGA GAG-480) and (antisense) 966-GTT CCT GTC TAT TTC GGG-983) (522 bp), and the EDNRB PCR product described above. Identity and orientation of the inserts was confirmed by automated sequencing. For transcription, the vectors were linearised by restriction digestion at sites in the pGEM-T polylinker: the antisense EDN3 probe was transcribed by SP6 RNA polymerase after Nco1 digestion and the sense probe by T7 RNA polymerase after Sal1 digestion. For EDNRB, the vector was linearised with Nco1 for transcription of the antisense probe by SP6, and by Sal1 for transcription of the sense probe using T7. Digoxigenin labelling during transcription of 1 μg of each of the linearised plasmids was performed with components of a DIG RNA Labelling Kit (Boehringer Mannheim, Lewes, UK), according to the manufacturer’s instructions. Typically, more than 80% of the digoxigenin labelled dUTP was incorporated into the RNA probes, the sizes and yields of which were determined by denaturing agarose formaldehyde gel electrophoresis as described by the manufacturer (Boehringer Mannheim, Lewes, UK). The probes were stored at −80°C and used without further purification.
After rehydration of the tissues, their preparation for in situ hybridisation and the hybridisation protocol were as described,15 with the following modifications: the duration of the hybridisations was extended from 24 to 72 hours in order to permit full penetration of the probes into whole mount embryos especially at later stages of development.15 Hybridised probes were detected with antidigoxigenin-AP Fab fragments (Boehringer Mannheim, Lewes, UK) as described by the manufacturer but with the modification that one fifth of the recommended 4-nitroblue tetrazolium chloride concentration (final concentration 70 μg/ml) was used during the alkaline phosphatase colour reaction in order to reduce background staining.16 Samples were photographed using a dissection microscope and subsequently impregnated with 15% sucrose in PBS and 7.5% gelatine for the preparation of 15 μm cryostat sections that were mounted in 50% glycerol in PBS for viewing under bright field illumination.13 Parallel controls for the in situ hybridisations showed that no labelling was obtained with the complementary RNA sense probe used under identical conditions (see insert to fig 5 and fig 6f).

In situ hybridisation for EDN3 mRNA in sections of small intestine, caecum, and large intestine of a 12 dpc embryo, showing alkaline phosphatase reaction product in the mesenchyme (m) of the caecum (ce), small intestine (si), and colon (co), staining being most intense at the caecum. The intestinal epithelium (e) was unstained in all cases, as was the liver (L). The insert shows the result of a control hybridisation of the caecum using a sense RNA probe.

In situ hybridisation for EDNRB mRNA in sections of 12 dpc and 14 dpc gut. Whole mount in situ hybridisation followed by cryostat sectioning was performed as for EDN3 mRNA. Note the restricted localisation of signal to the small intestine and caecum of 12 dpc gut, and the strong signal seen in the longitudinal and transverse sections of colon by 14 dpc. The control showing absence of signal in the colon using a sense RNA probe is shown in (f).
Results
RT-PCR DETERMINATION OF RELATIVE mRNA LEVELS
Non-saturating PCR amplification conditions with regard to cycle number and cDNA dilution resulted in a reproducible relation between the amount of cDNA produced by reverse transcription and the strength of the signal in ethidium bromide stained gels of each PCR product (data not shown). In order to compare tissues of different sizes and to compensate for varying efficiencies of extraction and reverse transcription, RT-PCR of GAPDH mRNA was included as a standard for all tissue preparations. Thus, dilutions of cDNA proportional to the ones that yielded constant amounts of amplified GAPDH product under non-saturating conditions were used for amplification of the cDNAs from individual samples with the EDN3, EDNRB, and RET primers (fig 1).
EDN3 mRNA levels were found to be similar in the proximal and distal gut segments at both 12 and 14 dpc (fig 1). Quantitation of the RT-PCR products obtained from five animals by laser densitometry of the ethidium bromide stained bands showed no significant differences (p>0.8, paired Student’st test) in proximal:distal levels of EDN3 mRNA relative to those of GAPDH. However, although there was also no significant difference between proximal and distal mRNA levels of EDNRB and the neural crest cell marker RET17 at 14 dpc, the levels of both of these were much lower in the distal compared with the proximal gut at 12 dpc (fig 1). Statistical analysis of densitometric scans showed significantly (p<0.05) lower EDNBR levels (36% (SEM 6.6%), n=3) and RET levels (30 (6.2)%, n=3) relative to their proximal levels at 12 dpc. Because EDNRB and RET have been shown to be expressed by enteric neural crest derived cells,12 ,17their low levels in the 12 dpc distal gut are consistent with previous reports that the distal gut has not been colonised at this stage.9
IMMUNOHISTOCHEMISTRY
At 12 dpc, PGP9.5 immunoreactive cells were present in the small intestine, distributed in the position of the future myenteric plexus, whereas no immunoreactive cells were detected in the colon (fig 2). By 14 dpc, however, PGP positive cells were present in both proximal and distal gut (fig 2), consistent with the results of the RT-PCR study (fig 1) and previous reports showing that migrating neural crest cells colonise the distal gut after 12 dpc.9 Taken together with the results of the RT-PCR analysis of EDNRB and RET mRNA levels (fig1), these observations indicate that the EDN3 mRNA detected by RT-PCR is likely to be expressed by cells of the gut wall, rather than by migrating neural crest cells.
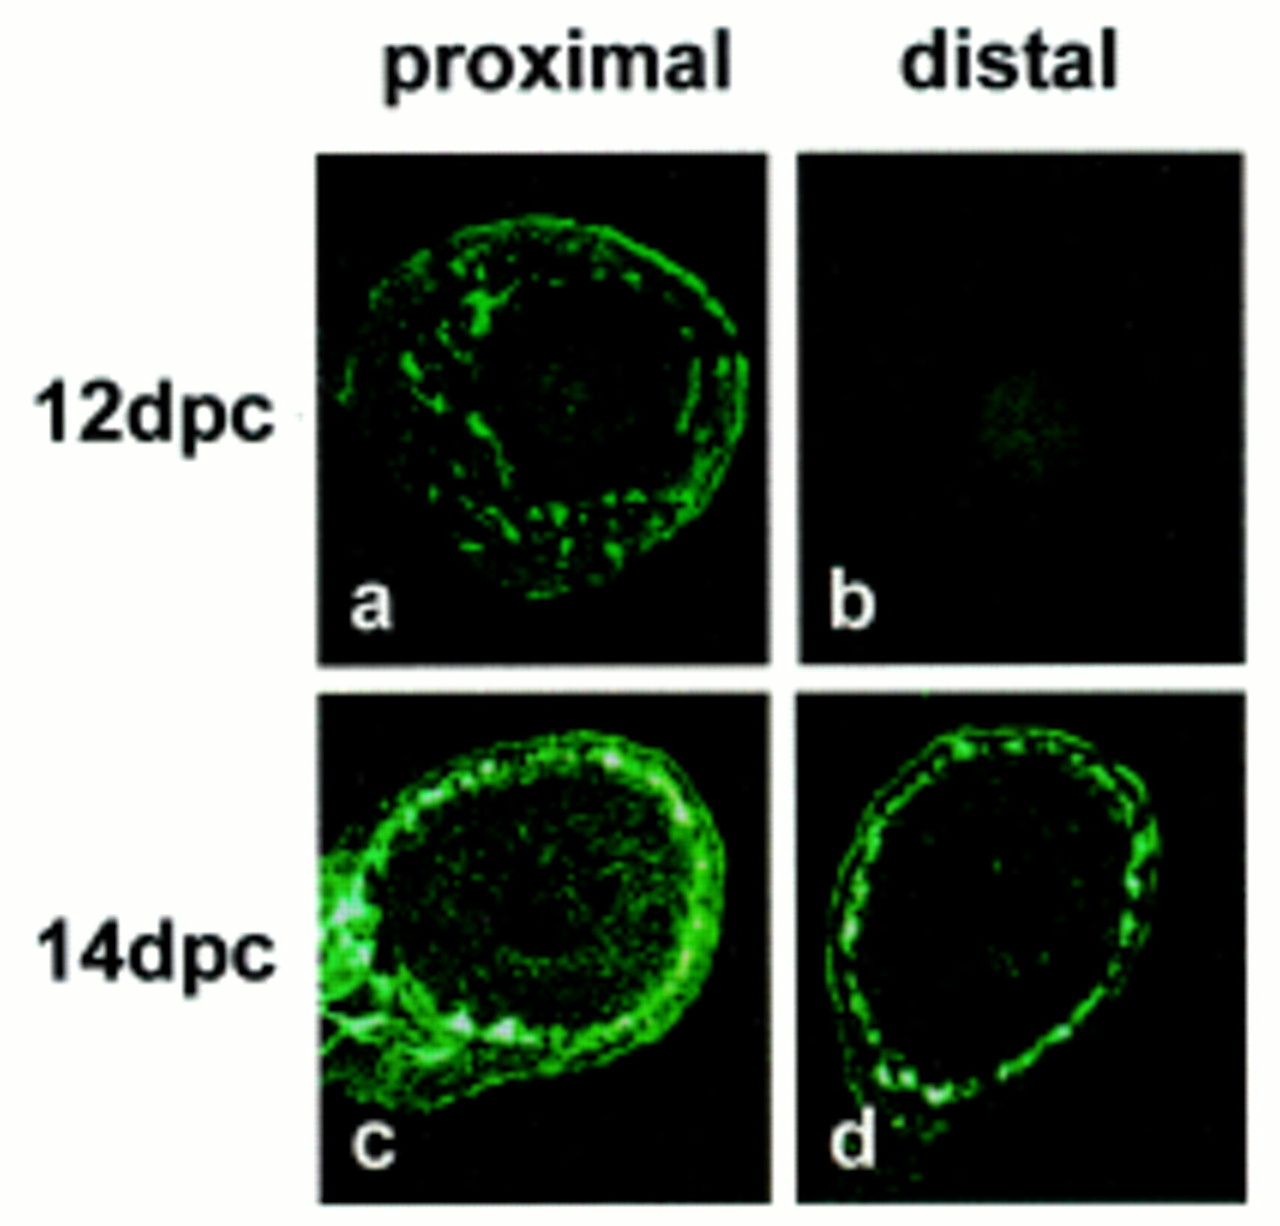
PGP9.5 immunofluorescence in sections of proximal (a,c) and distal (b,d) mouse intestine at 12 (a,b) and 14 (c,d) dpc shows a typical distribution of immunoreactivity corresponding to the developing enteric nervous system in both proximal and distal gut at 14 dpc, whereas staining is only found in the proximal gut at 12 dpc.
IN SITU HYBRIDISATION
To localise the cells expressing EDN3 mRNA, in situ hybridisations of whole mount preparations of intact 10 and 12 dpc embryos were performed. Remarkably, the only tissue displaying a strong signal at both these stages was the gut in the vicinity of the developing caecum at the umbilical hernia (fig 3), although somewhat weaker staining was seen in association with the otic vesicle and mesenchymal tissue of the forelimbs (unpublished observations). To analyse expression in more detail, isolated gut from 10, 12, and 16 dpc embryos was subjected to in situ hybridisation. At all three stages, the caecum was intensely labelled (fig 4). In addition, however, there was a gradient of EDN3 expression extending rostral from the caecum into the small intestine and distal into the colon, and by 16 dpc the whole of the small and large intestine displayed the EDN3 hybridisation signal, although always at lower levels than that of the caecum. At all stages the stomach was unlabelled (fig 4).
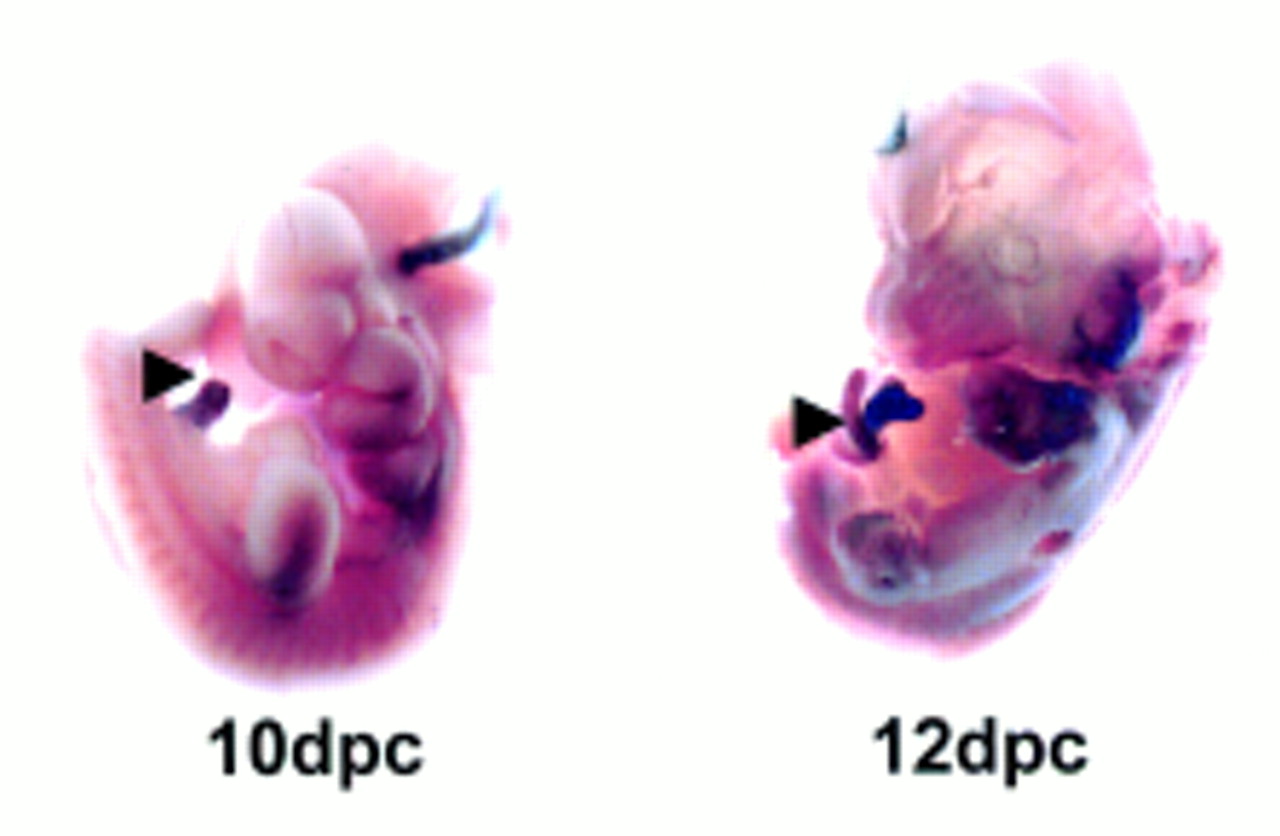
Whole mount in situ hybridisation for EDN3 mRNA in 10 and 12 dpc mouse embryos. The alkaline phosphatase reaction product denoting the presence of EDN3 mRNA is visible in gut at the umbilical hernia at both time points (arrows). Lower levels of reaction product can be seen associated with the mesenchyme of the developing forelimbs.

Whole mount in situ hybridisation for EDN3 mRNA in the gut from 10, 12, and 16 dpc mouse embryos. The intestines of the mouse embryos were dissected out before whole mount in situ hybridisation. At all three ages, an intense staining with the alkaline phosphatase reaction product can be seen at the caecum (ce), gradients of EDN3 staining extending with time into the proximal small intestine (si) and distal colon (co). The stomach (st) did not display a signal at 10 or 12 dpc, although by 16 dpc, the whole of the small intestine and the colon were weakly stained.
In tissue sections taken from the whole mount preparations, EDN3 mRNA labelling was localised to the gut mesenchyme; no labelling was seen in the epithelium or concentrated at the level of the presumptive myenteric plexus (fig 5). In confirmation of the macroscopic observations shown in fig 4, the mesenchyme of the caecum was more intensely labelled than that of the adjacent small or large intestine (fig 5). Control experiments using the sense RNA probe under the same conditions failed to label mesenchymal cells or any other tissue (fig5, insert).
In situ hybridisation for EDNRB mRNA at 12 dpc showed the presence of cells displaying a signal in the small intestine and caecum, whereas there were no cells detectable in the colon (fig 6a,b,c). However, by 14 dpc, a very strong signal had appeared in the colon that was higher than that seen in more proximal gut at this or earlier stages (fig6d,e). In contrast to the mesenchymal distribution of EDN3 mRNA, that of the EDNRB was clearly localised to the position of cells of the developing myenteric plexus (fig 6a,b,d,e). The specificity of this signal was shown by the lack of labelling when the control sense RNA probe was used under the same conditions (fig 6f).
Taken together, these observations show that EDN3 is expressed by mesenchymal cells of the gut at or in the vicinity to the caecum before, during, and after colonisation by vagal neural crest cells which express the EDNRB.
Discussion
The localisation of EDN3 mRNA in embryonic mouse gut shows for the first time high levels of expression by mesenchymal cells of caecum. This result is consistent with a recent report showing mesenchymal expression of EDN3 in human fetal intestine although the caecum was not examined in that study.12 The expression of EDNRB mRNA by neural crest cells as they migrate through this mesenchymal environment is consistent with a paracrine mechanism of action whereby the EDN3 of the gut wall regulates the further migration of the cells to colonise the colon. Such a paracrine action of EDN3 on neural crest cells in the caecum provides an explanation for their abnormal behaviour beginning at the caecum in mice lacking EDN3,1 ,9 and is likely to be responsible for the subsequent aganglionosis of the terminal gut in these animals.
EXPRESSION OF EDN3
During prenatal development, the highest levels of EDN3 mRNA were found to be exclusively expressed by the mesenchymal cells of the caecum, with a gradient of expression extending rostrally into the distal small intestine and caudally into the proximal colon. The pattern of EDN3 expression reflects previous demonstrations that by 12 dpc, the mesenchyme of the gut already has distinct properties along its axis. Thus, mesenchymal cells of the rat caecum have been reported to be HNK 1 positive in contrast to the mesenchyme of the adjacent developing gut.18
Although the mechanisms that regulate expression of the EDN3 gene are currently unknown, rostrocaudal specification of the gut is likely to involve the position specific expression of homeobox genes.19 ,20 Thus, the prospective caecal mesoderm in the chick embryo is defined by overlapping expression of theAbd-B genesHoxa-9, -10, and-11,20 and position specific expression of related Hox genes has been described in developing mammalian gut.21 ,22 However, the relation between caecum specific Hox gene expression and EDN3 expression is currently unknown, the regulatory region of the EDN3 gene not having been characterised.
CONSEQUENCES OF EDN3 EXPRESSION ON NEURAL CREST CELLS
Mouse mutants that are unable to express EDN3, EDNRB, or the gene coding for the endothelin converting enzyme 1 necessary for post-translational cleavage of endothelin propeptides all display terminal colonic aganglionosis.5 ,6 ,23 Although the EDNBR receptor binds all three endothelins with similar affinity,10 and EDN1 mRNA has been detected in intestinal epithelium of embryonic mouse,24 the phenotype of the EDN3 knockout indicates that EDN1 and EDN2 cannot substitute for EDN3 in the developing gut.
In piebald lethal mice which have a deletion of EDNRB or lethal spotted mice with a loss of function mutation in EDN3, it has been reported that neural crest cells enter the digestive tract at the oesophagus and migrate without any apparent abnormalities through the increasingly mature gut mesenchyme to the caecum.1 ,8 ,9 At this point their migration is delayed, and while they do subsequently migrate caudally, they fail to reach the distal gut.1 ,8 ,9 In wild type/lethal spotted chimeric mice, however, the homozygous mutant neural crest cells are able to colonise the entire gut.25Furthermore, lethal spotted mouse neural crest cells have been shown to migrate into normal bowel explants in organotypic tissue culture.26 These experiments are consistent with a paracrine effect of EDN3 on neural crest cells, which is now substantiated by the demonstration in this paper that EDN3 is expressed by gut mesenchymal cells.
Several possible mechanisms could explain the terminal aganglionosis in the absence of EDN3. As the maturation of the gut mesenchyme proceeds at a slightly faster rate than the progression of neural crest cells, the neural crest cells encounter a progressively more mature environment the further they migrate along the gut tube.18The prolonged delay of migration at the caecum in the absence of EDN3 means that the neural crest cells encounter an environment that therefore might be less permissive to migration or enteric ganglion formation. The Sox10 mutation found in theDom mouse results in a general delay in neural crest cell migration with subsequent apoptosis.27Thus any delay in cell migration at the caecum caused by endothelin lesions may result in a similar fate for the neural crest cells. An alternative—but not mutually exclusive—possibility is that because EDN3 can promote proliferation of neural crest cells in vitro28 ,29 and has been shown to delay their differentiation,30 then lack of EDN3 could result in a deficit in numbers of precursor cells available for the colonisation of the most distal part of the bowel.
It has been shown recently that an inactivating mutation of theenx Hox gene expressed by neural crest cells causes hyperplasia of the colonic ENS at the expense of a hypoplasia of the ENS in the ileum directly rostral to the caecum.31Thus, enx seems to limit migration of neural crest cells across the caecum, and hence acts as a functional antagonist of the EDN3−EDNRB system. However, it remains to be seen how these two systems are linked.
The present results add to previous work pointing to the important role of the gut mesenchyme, not only in determining regional identity along the gut tube itself,32 ,33 but also in the regulation of the region specific innervation of the gut.
Acknowledgments
This work was supported by a project grant to DHE and CRV from Action Research, and a travelling fellowship to TO from the British Council. MNW is a British Society of Gastroenterology Research/British Digestive Foundation Fellow and SEK was supported by a Research Fellowship from the Royal College of Surgeons of England. We thank Mrs J Currie for invaluable technical assistance.
Abbreviations
- EDN1
- endothelin 1
- EDN2
- endothelin 2
- EDN3
- endothelin 3
- EDNRA
- endothelin A receptor
- EDNRB
- endothelin B receptor
- ENS
- enteric nervous system
- GDNF
- glial cell line derived neutrotrophic factor