

Abstract
Micromolar concentrations of extracellular Zn2+are known to antagonize native NMDA receptors via a dual mechanism involving both a voltage-independent and a voltage-dependent inhibition. We have tried to evaluate the relative importance of these two effects and their subunit specificity on recombinant NMDA receptors expressed in HEK 293 cells and Xenopus oocytes. The comparison of NR1a–NR2A and NR1a–NR2B receptors shows that the voltage-dependent inhibition is similar in both types of receptors but that the voltage-independent inhibition occurs at much lower Zn2+ concentrations in NR1a–NR2A receptors (IC50 in the nanomolar range) than in NR1a–NR2B receptors (IC50 in the micromolar range). The high affinity of the effect observed with NR1a–NR2A receptors was found to be attributable mostly to the slow dissociation of Zn2+ from its binding site. By analyzing the effects of Zn2+ on varied combinations of NR1 (NR1a or NR1b) and NR2 (NR2A, NR2B, NR2C), we show that both the NR1 and the NR2 subunits contribute to the voltage-independent Zn2+ inhibition. We have observed further that under control conditions, i.e., in zero nominal Zn2+ solutions, the addition of low concentrations of heavy metal chelators markedly potentiates the responses of NR1a–NR2A receptors, but not of NR1a–NR2B receptors. This result suggests that traces of a heavy metal (probably Zn2+) contaminate standard solutions and tonically inhibit NR1a–NR2A receptors. Chelation of a contaminant metal also could account for the rapid NR2A subunit-specific potentiations produced by reducing compounds like DTT or glutathione.
Zn2+ ions are known to be abundant in some nerve terminals and can be released in the synaptic cleft at concentrations of nearly 1 μm (for review, seeSmart et al., 1994). In this context, the observation that Zn2+ at micromolar concentrations inhibits NMDA responses (Peters et al., 1987; Westbrook and Mayer, 1987) immediately was given a major physiological significance. This significance was reinforced by the observation of Zn2+ inhibitory effects on the NMDA components of synaptic currents (Forsythe et al., 1988; Mayer and Vyklicky, 1989) and by data indicating that Zn2+ could play an important role in excitoxicity (Koh and Choi, 1988; Koh et al., 1996).
The analysis of the mechanisms of the Zn2+inhibition (Mayer et al., 1988, 1989; Christine and Choi, 1990;Legendre and Westbrook, 1990) revealed that Zn2+produces both a voltage-independent inhibition and a voltage-dependent block, the latter resembling that produced by Mg2+. Inhibitory effects of Zn2+ on recombinant NMDA receptors were observed first on receptors expressed from whole brain RNA (Rassendren et al., 1990) and then, after the cloning of the main NMDA receptor subunits, on heteromeric receptors associating NR1 and NR2 subunits (Kutsuwada et al., 1992; Meguro et al., 1992) and on most homomeric NR1 receptors (Hollmann et al., 1993; Zheng et al., 1994).Mori et al. (1992) and Sakurada et al. (1993) then analyzed the effects of mutations of a ring of asparagines found at the Q/R/N site, a critical position of the M2 segment involved in the control of the Mg2+ block of NMDA channels (see McBain and Mayer, 1994). They observed that a major reduction or even a complete suppression of the Mg2+ block was associated with a mild reduction of the Zn2+ block (see also Kawajiri and Dingledine, 1993), probably because the mutations reduced or abolished the Zn2+ voltage-dependent block but left intact the Zn2+ voltage-independent inhibition.
The present study aimed at a better separation of the voltage-dependent and the voltage-independent processes in recombinant receptors. In attempting to measure the inhibitory effect of Zn2+on NR1a–NR2A receptors expressed in Xenopus oocytes and human embryonic kidney (HEK) cells, we observed inhibitions of very variable size at concentrations of a few tens of nanomolars. This was found to be attributable to the variable degree of contamination of the solutions by traces of heavy metal ions (possibly Zn2+). By using chelators of these metals, we were able to obtain a reliable estimate of the control response and to demonstrate that the IC50 of the voltage-independent Zn2+ inhibition is highly subunit-specific, ranging from ∼10 nm in the case of NR1a–NR2A receptors to 10 μm in NR1a–NR2C receptors. In contrast, the voltage-dependent Zn2+ inhibition has an IC50 in the micromolar range in NR1a–NR2A receptors and can be suppressed selectively by a point mutation in the pore region [NR2A(N595K)].
MATERIALS AND METHODS
Primary neuronal cultures
Cortical and diencephalic neurons taken from 15- to 16-d-old mouse embryos were cultured for 2–5 weeks, as previously described byAscher et al. (1988).
NMDA receptor expression in HEK cells andXenopus oocytes
Plasmid constructions. All of the cDNAs used in this study were subcloned in a modified (see Kupper et al., 1996) pcDNA3 vector (Invitrogen, Leek, Netherlands), allowing high-level expression of recombinant proteins in transfected mammalian cells as well as inXenopus oocytes after nuclear injection. The subunit cDNAs were subcloned from the following pBluescript-based plasmids: pN60 [Moriyoshi et al. (1991); gift from S. Nakanishi, Kyoto University, Japan] for NR1a, pNMDAR1–1b [Hollmann et al. (1993); gift from J. Boulter, Salk Institute, La Jolla, CA], NR2A and NR2C [Monyer et al. (1992); gift from P. Seeburg, Center for Molecular Biology, Heidelberg, Germany], and ε2 [Kutsuwada et al. (1992); gift from M. Mishina, Niigata University, Japan] for NR2B. The plasmid coding for the green fluorescent protein (GFP) (Chalfie et al., 1994) was a gift from D. Pritchett.
Site-directed mutagenesis. Site-directed mutagenesis was performed according to a method modified from Kunkel (1985). The presence of the mutation was verified by sequencing across the M2 region with the Sequenase Kit (Stratagene Cloning Systems, La Jolla, CA).
Transfection of HEK cells. HEK cells were cultured in a DMEM medium (with l-glutamine and 4.5 gm/l glucose added) containing 10% heat-inactivated fetal calf serum and penicillin–streptomycin (5000 U/ml). Low confluency cells were transfected by the calcium phosphate precipitation method (Chen and Okayama, 1987). Cells were cotransfected with a mixture containing NR1, NR2, and GFP plasmids (0.3, 0.9, and 0.8 μg per 35 mm diameter dish, respectively). After transfection, 100 μmd-AP5 was added to the culture medium.
Expression of NMDA receptors in Xenopus oocytes.Preparation of oocytes and nuclear injection of cDNAs coding for wild-type and mutant NMDA receptors were performed as described byPaoletti et al. (1995).
Chemicals
NMDA and d-2-amino-5-phosphopentanoic acid (d-AP5) were obtained from Tocris Cookson (Bristol, UK). Glycine, l-glutamate, zinc chloride, HEPES,N-tris(hydroxymethyl)methylglycine (tricine), diethylenetriaminepentaacetic acid (DTPA), EDTA,N,N,N′,N′-tetrakis-(2-pyridylmethyl)-ethylenediamine (TPEN),N-(2-acetamido)iminodiacetic acid (ADA), and dithioerythritol (DTE) were obtained from Sigma (Saint Quentin Fallavier, France). All other salts were obtained from Prolabo (Paris, France) and were of “Normapur” grade. Zinc chloride stock solutions (10 μm–100 mm) were prepared by progressive dilutions with bidistilled water of a solution containing 100 mm ZnCl2 and 10 mm HCl. The stock solution of TPEN (50 mm) was prepared in ∼100 mm HCl. Other stock solutions (EDTA, 250 mm; DTE, 300 mm; tricine, 1 m; DTPA, 300 mm; ADA, 500 mm) were prepared in bidistilled water, and their pH was adjusted to 7.4 with NaOH.
Buffered Zn2+ solutions
The marked effects of heavy metal chelators on the response of NR1a–NR2A NMDA receptors (see Fig. 1, Table 1) and the apparent high affinity of these receptors for Zn2+ (see Fig.3B) required the use of buffered Zn2+solutions to establish Zn2+ inhibition curves. The heavy metal chelators tested in this study have a very high affinity for Zn2+ (KD < 10−10m; see Table 1), which precludes their use to buffer Zn2+ in the 1–100 nm range. In this respect, tricine, with aKD of 10−7.3m(Dawson et al., 1986), seemed more promising. We used MaxChel, a program for buffer calculations [which takes into account the pH and the ionic strength of the solutions (Bers et al., 1994)] with the published binding constants of tricine, to prepare buffered solutions for Zn2+ in the 10–100 nm range. We expected that the responses recorded with NR1a–NR2A receptors with such solutions would be smaller than the responses recorded in Zn2+-free solutions but larger than the responses recorded in nonbuffered solutions to which 100 nmZn2+ had been added. The actual responses were much smaller than predicted, which suggested that we had used incorrect binding constants for tricine. To estimate more accurate values for these constants, we took advantage of the fact that at concentrations of a few micromolars Zn2+ produces a voltage-dependent inhibition. From the amount of Zn2+ voltage-dependent block we estimated the free Zn2+ concentration in our buffered solutions and hence calculated an empirical KD of tricine for Zn2+ in our experimental conditions of 10−5m instead of 10−7.3m. The buffered Zn2+ solutions used to obtain the Zn2+ dose–response curves shown in Figures2A and 3A were prepared according to this empirically established binding constant by adding to 10 mmtricine the following concentrations of Zn2+ (in μm): 0.26, 0.78, 2.6, 7.8, 26, 77.5, and 254. The corresponding estimated concentrations of free Zn2+were (in nm): 1, 3, 10, 30, 100, 300, and 1000, respectively. Note that in the calculations for the buffered solutions the weak Zn2+ chelation properties of glycine and glutamate (Dawson et al., 1986) have been neglected.

NR1a–NR2A responses are potentiated by the heavy metal chelator TPEN. Recombinant NMDA receptors expressed in HEK 293 cells (A, B) or in Xenopusoocytes (C, D) were activated by applying saturating concentrations of glutamate (100 μm) and glycine (100 μm). The responses were compared before (control) and after (TPEN) addition of 1 μm TPEN to the external solution.A, B, HEK cells. Glutamate was applied on a background of glycine for 2 sec every 10 sec on cells held at −50 mV. The external Ca2+ concentration was 1 mm. A, TPEN potentiates NR1a–NR2A responses. Each trace is the average of five records.B, NR1a–NR2B responses are not affected by 1 μm TPEN. Each trace is the average of fifteen records. C, D,Xenopus oocytes. Voltage ramps from −70 to +50 mV were applied in the absence (control) or presence of 1 μmTPEN. Current–voltage curves corresponding to the leak currents were substracted from those obtained during steady applications of 100 μm glutamate and 100 μm glycine. The only external divalent cation was Ba2+ (0.3 mm). C, TPEN potentiates NR1a–NR2A responses over the whole voltage range.D, NR1a–NR2B currents recorded in the absence or in the presence of TPEN are superimposed.
Potentiation of NMDA NR1a–NR2A receptors by heavy metal chelators

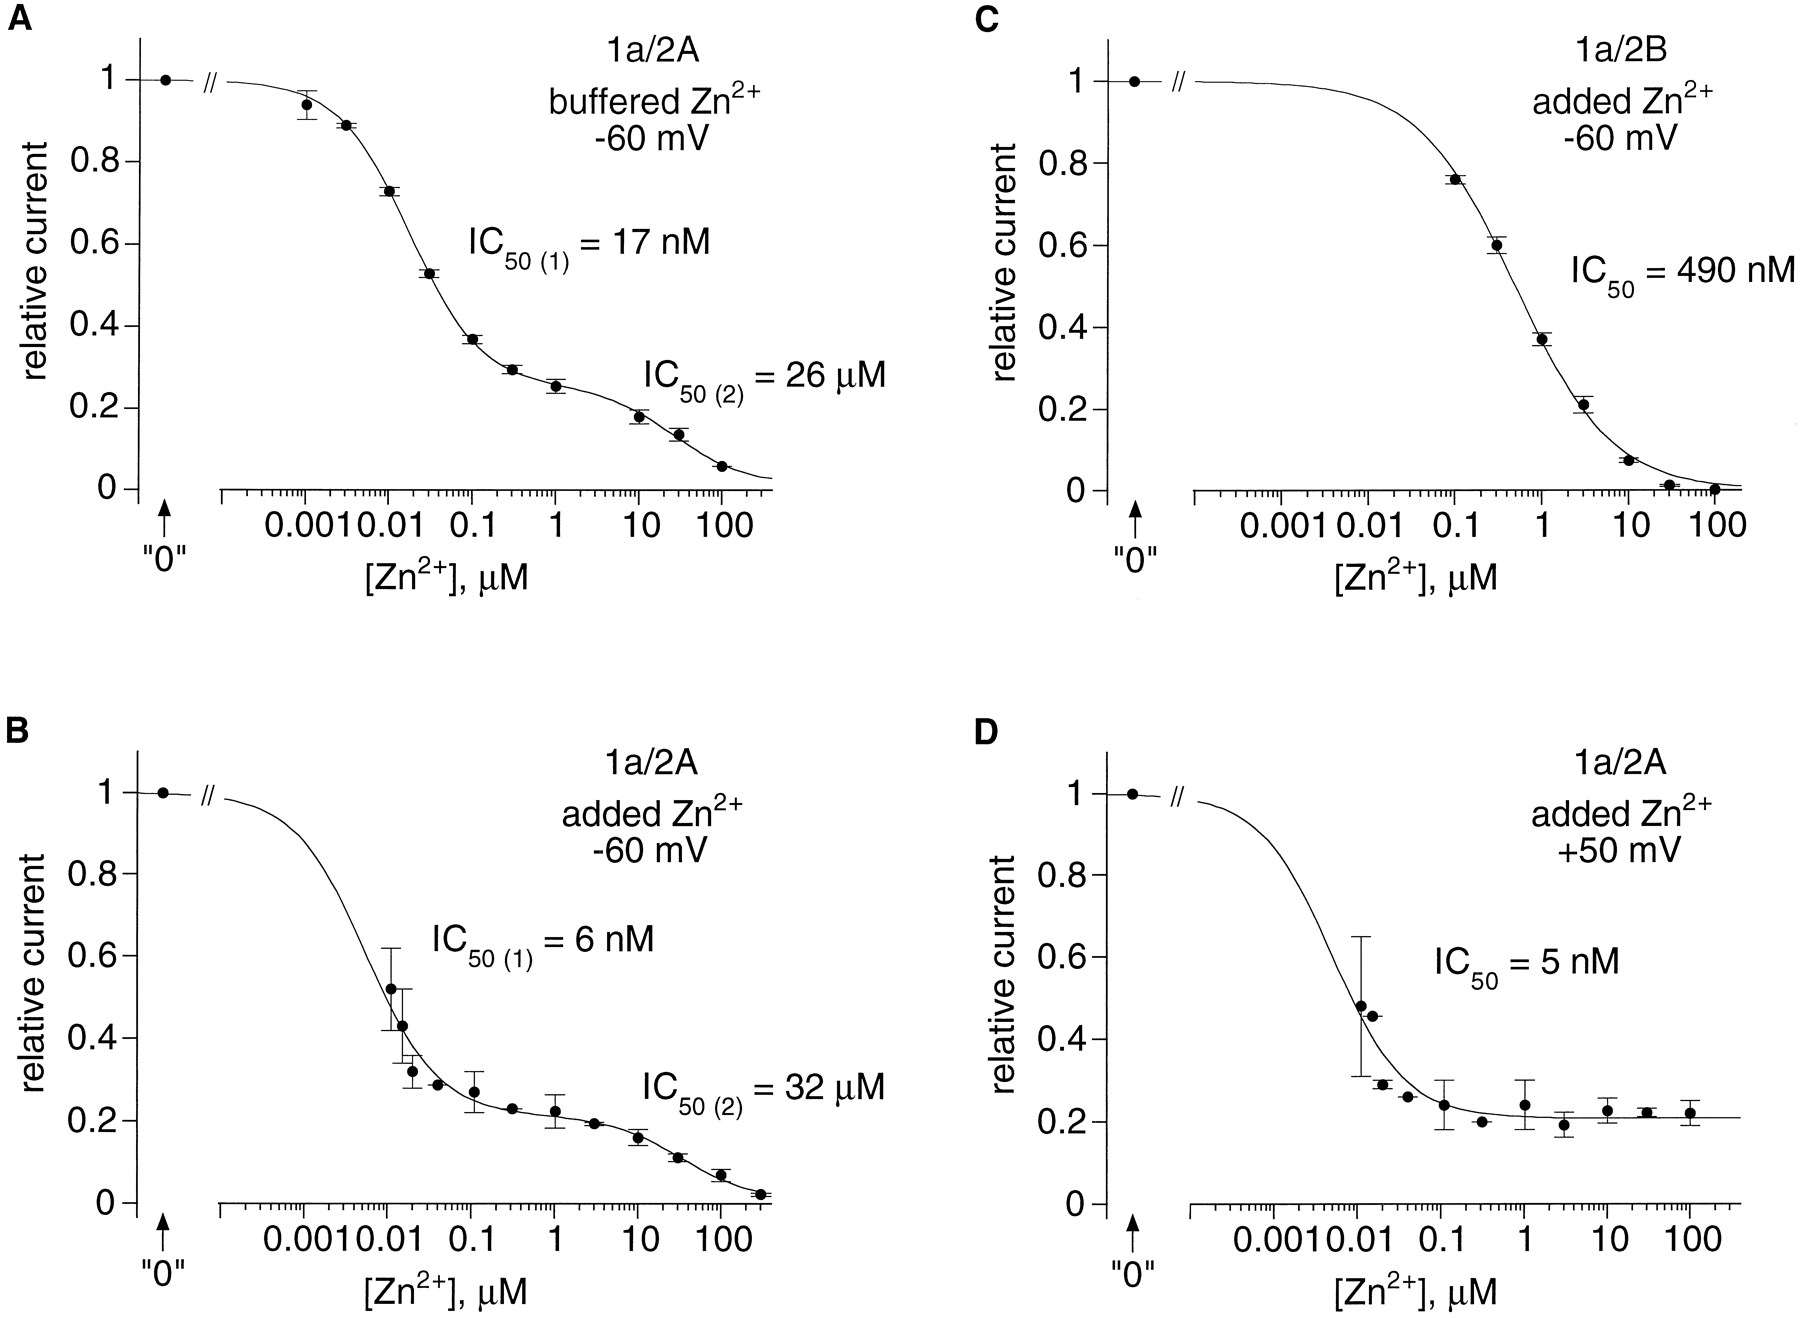
Concentration dependence of the Zn2+ inhibition of NR1a–NR2A and NR1a–NR2B receptors. Recombinant NMDA receptors were expressed inXenopus oocytes, and dose–response curves were constructed from I–V curves obtained as in Figure 2. In each experiment currents were expressed as a fraction of the current recorded in the presence of a Zn2+ chelator (“0” Zn2+). Thecurves in A and Brepresent least-squares fits to the data points with the two-binding-site isotherm y = 1 − ((a/(1 + IC50(1)/[Zn2+])) + (b/(1 + IC50(2)/[Zn2+]))), in whichy is the relative current, and a andb are the respective weights of each isotherm. Thecurves in C and Drepresent least-squares fits to the data points with the single-binding-site isotherm y = 1 − (a/(1 + (IC50/[Zn2+])n)), in which y is the relative current, n is the Hill coefficient, and a is a weight factor.A, B, Dual antagonism by Zn2+ of NR1a–NR2A responses recorded at negative potentials (−60 mV). A, Zn2+concentrations correspond to free Zn2+concentrations in solutions buffered with tricine (10 mm; see Fig. 2 and Materials and Methods). Data are from seven cells, with each point being the mean of three to four values. The estimated IC50(1), IC50(2),a, and b are 17 nm, 26 μm, 0.75, and 0.25, respectively. B, Zn2+ concentrations correspond to added Zn2+ concentrations corrected for an assumed 10 nm contaminating Zn2+. TPEN (1 μm; n = 13) or DTPA (2 μm; n = 4) were used for reference (“0” Zn2+ concentration). Data are from 17 cells, each point being the value obtained from 1 cell (30 and 300 nm added Zn2+) or the mean value obtained from 2 cells (5 and 10 nmand 3 μm), 3 cells (30 and 300 μm), 4 cells (1 and 100 nm), 9 cells (10 and 100 μm), or 17 cells (1 μm). The estimated IC50(1), IC50(2),a, and b are 6 nm, 32 μm, 0.78, and 0.22, respectively. C, A single-binding-site isotherm is sufficient to describe the Zn2+ inhibition of NR1a–NR2B responses recorded at negative potentials (−60 mV). Zn2+ concentrations correspond to added Zn2+ concentrations with no correction for Zn2+ contamination. TPEN (1 μm) was used for the “0”Zn2+ solution. Data are from five cells, with each point being the mean of three to five values. The value ofa was fixed to 1. The estimated IC50 andn are 490 nm and 0.78, respectively.D, At positive potentials the low-affinity Zn2+ inhibition of NR1a–NR2A responses is absent. Zn2+ concentrations were corrected by assuming 10 nm contaminating Zn2+. TPEN (1 μm; n = 13) or DTPA (2 μm; n = 4) were used for the“0” Zn2+ concentration. Data are from 17 cells, each point being the value for 1 cell (5, 30, and 300 nm added Zn2+) or the mean value for 2 cells (10 nm and 3 and 30 μm), 3 cells (1 nm and 300 μm), 4 cells (100 nm), 8 cells (10 and 100 μm), or 17 cells (1 μm). The value of n was fixed to 1. The estimated values of the IC50 and of a are 5 nm and 0.79, respectively.

Nanomolar external Zn2+concentrations selectively inhibit NR1a–NR2A responses. Leak-substracted NMDA currents were recorded at different concentrations of external Zn2+ during voltage ramps from −70 to +50 mV applied in Xenopus oocytes expressing NR1a–NR2A or NR1a–NR2B receptors. Glutamate and glycine were applied at saturating concentrations (100 μm each). The “0” Zn2+ concentration refers to a solution containing a Zn2+ chelator with no added Zn2+ (see Results). A, NR1a–NR2A responses are inhibited by Zn2+concentrations of a few nanomolars. The inhibition is voltage-independent. At higher Zn2+ concentrations the inhibition saturates at ∼75% of the response in the“0” solution. The indicated Zn2+concentrations correspond to calculated free Zn2+concentrations in solutions buffered with 10 mm tricine (see Materials and Methods). The “0” solution contained 10 mm tricine and no added Zn2+. B, An additional voltage-dependent inhibition is produced by micromolar concentrations of Zn2+. The responses are from a different oocyte. The indicated Zn2+ concentrations correspond to nominal values. The “0” Zn2+solution contained 1 μm TPEN. C, Zn2+ antagonism of NR1a–NR2B responses is of lower affinity, is total, and is mainly voltage-independent. The indicated Zn2+ concentrations correspond to nominal values. The “0” Zn2+ solution contained 1 μm TPEN. D, Expanding the current scale at a high Zn2+ concentration (30 μm) reveals a voltage-dependent component of the inhibition of NR1a–NR2B responses. Shown is the same cell as in C. For clarity, the data were fit with a third-order polynomial.
Recording conditions
Neurons and HEK cells. Experiments on native neuronal receptors were performed on nucleated patches (see Sather et al., 1992). GFP-positive HEK cells were used for electrophysiological recordings 16–48 hr after transfection in the whole-cell patch-clamp configuration (Hamill et al., 1981). In all recordings HEK cells were lifted off the chamber floor to permit rapid solution changes. Soft glass patch pipettes of 3–5 MΩ were filled with a solution containing (in mm): 120 CsF, 10 CsCl, 10 EGTA, and 10 HEPES, pH-adjusted to 7.2 with CsOH.
The standard external solution (control solution) contained (in mm): 140 NaCl, 2.8 KCl, 1 CaCl2, and 10 HEPES, pH-adjusted to 7.3 with NaOH. Drugs and agonists were applied to the patch by means of an eight-barrel fast-perfusion system (Sather et al., 1992). Solutions flowed continuously by gravity from all barrels. In all whole-cell and nucleated-patch experiments, glutamate (HEK cells) or NMDA (neurons) was applied on a continuous background of glycine. NMDA was used at 200 μm. Glutamate and glycine were each present at a saturating concentration (100 μm).
Xenopus oocytes. Two-electrode voltage-clamp recordings were made 1–7 d after cDNA injection, using low resistance (0.5–1.5 MΩ) electrodes filled with 3 m KCl. The standard solution superfusing the oocytes contained (in mm): 100 NaCl, 2.8 KCl, 5 HEPES, and 0.3 BaCl2, pH-adjusted to 7.3 with NaOH. The low external Ba2+ concentration was used to minimize Ba2+ entry via NMDA channels and the subsequent activation of Ca2+-dependent conductances (Leonard and Kelso, 1990). The volume of the bath in the recording chamber was ∼100 μl. The rate of perfusion (∼4 ml/min) allowed a complete exchange of the solutions in 2–5 sec. Glycine (100 μm) and l-glutamate (100 μm) were applied simultaneously, usually for 10 sec every 2 min, using motor-driven valves. When the Zn2+ concentration was varied, currents were recorded after 30–60 sec of preincubation at the test Zn2+ concentration. The response at each test Zn2+ concentration usually was compared with the control responses (no added Zn2+ or “0” Zn2+; see Results) before and after the change in Zn2+ concentration.
All experiments were performed at room temperature (18–25°C).
Recording and data analysis
In neurons and HEK cells currents were recorded with a List EPC-7 amplifier (Darmstadt, Germany) and a Racal FM tape recorder. The voltage-clamp current usually was filtered (8-pole Bessel) with a corner frequency of 250 Hz, sampled at twice this frequency, and later analyzed by Strathclyde Electrophysiology Software (gift from John Dempster, Strathclyde University, Glasgow, Scotland). For whole-cell recordings the series resistance (3–8 MΩ) was partially compensated (50–90%) and monitored throughout the experiment.
Currents from oocytes were recorded with a Warner Instrument OC-725 amplifier (Hamden, CT). After being filtered at 500 Hz, traces were acquired at 250 Hz with pClamp V6.0 (Axon Instruments, Foster City, CA). Current–voltage curves were obtained with slow voltage ramps (2 sec duration) from −100 or −70 to +50 mV (the capacitive and leakage currents were recorded before agonist application and substracted from the glutamate-induced current traces).
For Zn2+ dose–response curves the response at each tested Zn2+ concentration was bracketed by two responses in a Zn2+-free solution (in the presence of a Zn2+ chelator, usually 1 μm TPEN) and then compared with the mean of these two Zn2+-free responses. In the analysis of the Zn2+ voltage-dependent block the “unblocked fraction” curves (Fig. 5B) were obtained by dividing the current–voltage curve obtained at each tested Zn2+concentration by the current–voltage curve obtained in a Zn2+-free solution (in these experiments TPEN, which induces a moderate voltage-dependent block of the glutamate response at potentials below −80 mV, was replaced by another Zn2+ chelator, DTPA, which showed no detectable voltage-dependent inhibitory effects in the range from −150 to +100 mV). We assumed that the Zn2+ voltage-dependent block was relieved completely at +50 mV and therefore normalized all unblocked fraction curves to 1 at +50 mV. The unblocked fraction values at 0 mV could not be evaluated directly from the data (close to the reversal potential, the ratios of the current traces take artifactual infinite values). They were calculated by using polynomial fits to the data collected outside the −10 to +10 mV range.

Low-affinity voltage-dependent Zn2+ block of NMDA NR1a–NR2A responses.A, Voltage ramps from −100 to +50 mV were applied inXenopus oocytes expressing NR1a–NR2A receptors in the absence of Zn2+ (“0”Zn2+ solution containing 2 μm DTPA) or after the addition of 1, 10, 30, 100, or 300 μm added Zn2+. For clarity, leak-substractedI–V curves are shown on an expanded current scale, because the voltage-dependent block by Zn2+ appears in a concentration range in which ∼80% of the maximal response already is eliminated by the high-affinity voltage-independent Zn2+ inhibition (see Figs. 2, 3). The Zn2+ block increases with increasing Zn2+ concentrations and with hyperpolarization. However, even at the highest concentration of Zn2+tested (300 μm) and at the most negative potentials, an inward current can still be recorded. B, Voltage dependence of the low-affinity Zn2+ inhibition. Shown is the same cell as in A. The unblocked fraction was calculated by dividing, at each concentration of Zn2+, the NMDA current by the NMDA current recorded in “0” Zn2+ and by subsequently normalizing to 1 for a membrane potential of +50 mV. Data points that take artifactual values around the reversal potential have been omitted. C, Concentration dependence of the voltage-dependent block by Zn2+ at −100, −80, −60, −40, −20, 0, +20, and +40 mV. Data points were calculated from curves similar to those shown in B, obtained in a series of seven experiments. Each point corresponds to the mean value obtained from three to seven measurements. The data points at 0 mV were obtained by interpolation with a polynomial fit (see Materials and Methods). The lines drawn through the data points are least-squares fits of the single binding isotherm:y = ymax · (1 − (1/(1 +(IC50/[Zn2+])n))), in which y is the relative voltage-dependent Zn2+ inhibition and n is the Hill coefficient. The weight factor ymax was introduced to eliminate the residual voltage dependence seen at 1 μm Zn2+ (see Results). The estimated IC50 and n are, respectively, 22 μm and 0.9 at −100 mV, 31 μm and 0.9 at −80 mV, 41 μm and 0.9 at −60 mV, 100 μmand 0.9 at −40 mV, 346 μm and 0.9 at −20 mV, and 1162 μm and 0.8 at 0 mV. D, Voltage dependence of the low-affinity Zn2+ inhibition. The IC50 values are those estimated by the fits shown inC. Note that, on this semi-log plot, a linear relation does not fit the data. The slope of the relation between the IC50 and the voltage increases with depolarization and reaches a maximum between −40 and 0 mV. In this range the slope (e-fold for ∼16 mV, dotted line) is consistent with an apparent electrical depth of the Zn2+ binding site of 0.77. The dashed line is drawn according to the equation used by Christine and Choi (1990) for the fit of their single-channel data obtained in the range between −70 and −20 mV (an IC50 at 0 mV of 909 μm and an electrical depth of 0.51).
Unless otherwise specified, error bars represent SD.
RESULTS
Heavy metal chelators potentiate NMDA NR1a–NR2A receptor activity
Recombinant NMDA receptors were expressed both in HEK cells andXenopus oocytes. Responses were elicited by applying saturating concentrations of both glycine (100 μm) and glutamate (100 μm). As shown in Figure1A, NR1a–NR2A whole-cell currents recorded at −50 mV in HEK cells were enhanced markedly (∼threefold increase in the peak current) by the addition of a low concentration (1 μm) of TPEN, a highly specific heavy metal chelating agent (see Table 1; Arslan et al., 1985). This potentiation was rapid and fully reversible. When glutamate pulses were applied at 10 sec intervals, the potentiation was already maximal for the response to the first pulse applied after the addition of TPEN. Similarly, a complete recovery was observed for the response to the first pulse applied in the TPEN-free solution (data not shown). Unlike NR1a–NR2A responses, NR1a–NR2B responses recorded in the same conditions were not affected by TPEN (Fig. 1B).
Similar results were obtained for NMDA receptors expressed inXenopus oocytes. Figure 1, C and D, shows leak-substracted NMDA currents recorded during voltage ramps applied in oocytes expressing either NR1a–NR2A receptors (Fig.1C) or NR1a–NR2B receptors (Fig. 1D). Whereas TPEN (1 μm) had no effect on the NR1a–NR2B current, it induced an approximately twofold potentiation of the NR1a–NR2A current. Moreover, as illustrated in Figure 1C, the potentiation of NR1a–NR2A currents produced by the addition of TPEN was voltage-independent.
The ratio of the peak current recorded at −50 mV in the presence of TPEN over the peak current recorded in the absence of TPEN was close to 1 for NR1a–NR2B receptors expressed in HEK cells (1.07 ± 0.04;n = 6) or oocytes (1.03 ± 0.02; n= 10), whereas for NR1a–NR2A receptors the mean ratio was 2.9 ± 0.3 (n = 6) in HEK cells and slightly lower in oocytes (2.05 ± 0.6; n = 17).
These results suggested that TPEN removes from the external medium a metal that tonically inhibits NR1a–NR2A, but not NR1a–NR2B, receptors. Because the effect is seen with a concentration of chelator as low as 1 μm, one can exclude effects involving the divalent cations Ca2+ or Ba2+ present in the extracellular solutions at millimolar concentrations, and one might suspect the involvement of a heavy metal such as Zn2+ or Cu2+.
In both expression systems the magnitude of the potentiation of the NR1a–NR2A responses was quite variable, ranging in oocytes from 1.5 to 3.7 and from 2.5 to 3.3 in HEK cells (for HEK cells, see Fig.7A). A likely explanation of this variability is that the putative heavy metal removed by TPEN is present in the external solutions at concentrations varying from one experiment to the other.

Most native NMDA receptors are potentiated by TPEN. A, Comparison of the effects of TPEN (1 μm) on the peak amplitude of NMDA currents recorded in neurons and in HEK 293 cells expressing either NR1a–NR2A or NR1a–NR2B receptor subtypes. Native NMDA responses were elicited by a 2 sec pulse of NMDA (200 μm) on a background of glycine (10 μm). Recombinant NMDA responses were recorded with protocols identical to those shown in Figure 1. The holding potential was −50 mV. Each circle corresponds to the peak ratio (TPEN/control) obtained from one experiment. Thefilled and hatched circles correspond to the two separate experiments, which are illustrated inB. The potentiation of native NMDA responses by TPEN was highly variable, with peak ratios ranging from 1.0 (no potentiation) to a maximum of 1.6. The mean value was 1.25 ± 0.17 (n = 12). The mean peak ratios for NR1a–NR2A and NR1a–NR2B receptors were 2.9 ± 0.3 (n = 6) and 1.07 ± 0.04 (n = 6), respectively.B, Variability of the effect of TPEN on neuronal NMDA responses. Shown are superimposed traces recorded in the control solution and in the presence of 1 μm TPEN. Eachtrace is the average of three individual responses. Thetop panel shows an example with a marked potentiation by TPEN (the peak ratio TPEN/control of 1.41 corresponds to thefilled circle in A), whereas thebottom panel shows an example in which TPEN was ineffective (the peak ratio of 1.0 corresponds to the hatched circle in A).
TPEN was chosen initially for its powerful heavy metal chelating properties and its poor Ca2+ affinity (Arslan et al., 1985). However, it has been shown that TPEN permeates readily biological membranes (Arslan et al., 1985), and the possibility had to be considered that external TPEN enters the cell and potentiates NR1a–NR2A responses via an intracellular mechanism. To evaluate this hypothesis, we tested the effects of three membrane-impermeant heavy metal chelators: EDTA, DTPA, and ADA (see Table 1; Dawson et al., 1986). The experiments were performed in oocytes in the presence of 0.3 mm Ba2+. As shown in Table 1, each of the three compounds potentiated NR1a–NR2A responses recorded at negative potentials. Moreover, the potentiations produced by each chelator were very similar to the potentiation produced by TPEN. This result argues against an intracellular mechanism of action of TPEN and suggests that the four compounds act by complexing a contaminant heavy metal present in the external solution at a concentration high enough to inhibit NR1a–NR2A responses. Candidates for trace impurity are numerous, including Zn2+, Cd2+, Mn2+, Cu2+, Fe2+, and Al3+.
Zn2+ inhibits NR1a–NR2A responses in the nanomolar range
The effects of various heavy metals on NMDA receptors have been studied in many neuronal preparations (Mayer et al., 1989; Eimerl and Schramm, 1993; Trombley and Shepherd, 1996; Vlachova et al., 1996). These studies have shown that Zn2+, Cd2+, Fe2+, and Cu2+ are NMDA antagonists, among which Zn2+ is the most potent, inhibiting native NMDA receptor activity at concentrations of a few micromolars. However, in all of these experiments the possible presence in the external solutions of endogenous Zn2+ (and of other heavy metals) was not taken into account, and the solutions with no added Zn2+ were assumed to be Zn2+-free. The observation that heavy metal chelating agents potentiate NMDA NR1a–NR2A responses, by suggesting that Zn2+ could be present as an endogenous metal in the external solutions at a submicromolar concentration (necessarily lower than that of the chelator producing a large potentiation), imposed a reevaluation of the inhibitory constants deduced from early work.
To evaluate the potency of Zn2+ as a high-affinity NMDA receptor antagonist, we used three different protocols. The first two involved the construction in oocytes of dose–response curves either with or without buffered Zn2+ solutions. The third approach was based on the measurement in HEK cells of the current relaxations after step changes in Zn2+concentrations.
To use buffered Zn2+ solutions, we looked for a chelating agent capable of producing buffered free Zn2+ concentrations in the nanomolar to micromolar range. For this purpose the binding constants of TPEN, EDTA, DTPA, and ADA with Zn2+ were much too high (absoluteKD ≤ 10−9.7m; Table 1), so we selected tricine, which binds Zn2+with a low affinity (we estimated the absoluteKD as 10−5m; see Materials and Methods), but has an even lower affinity for Ca2+ or Ba2+ (absoluteKD ∼100 mm) present in the external solutions at millimolar concentrations. We first compared, on NR1a–NR2A receptors expressed in oocytes, the effect of tricine with that of the other chelating agents used previously. Tricine (10 mm) potentiated NR1a–NR2A responses by the same amount as TPEN, EDTA, DTPA, and ADA (see Table 1). In what follows, “0” Zn2+ solution refers to a solution with no added Zn2+ but containing one of the five chelating agents.
We then tested the effects of various Zn2+concentrations in tricine-buffered solutions on NR1a–NR2A receptors and found that they revealed two inhibitory effects differing markedly in their IC50 values and voltage dependence. The first is illustrated in Figure 2A, which shows the inhibition produced by Zn2+ at concentrations from 3 nm to 1 μm. The reduction of the conductance is very similar over the whole potential range tested. An estimated concentration of 3 nm free Zn2+ is sufficient to produce a clear inhibition; the response is reduced by more than one-half at an estimated concentration of 30 nm free Zn2+ and by nearly 80% at 1 μm Zn2+. Figure2B shows that for concentrations of Zn2+ above 1 μm (at these concentrations there is no noticeable difference between buffered and nonbuffered solutions) the pattern of inhibition changes. There is nearly no additional inhibition in the positive potential range, suggesting that the voltage-independent inhibition has reached its maximum; on the other hand, in the negative potential range the inhibition continues to increase with the Zn2+concentration and the more so at more negative potentials.
These results indicate that Zn2+ exerts a dual block on NMDA NR1a–NR2A receptors: one is voltage-independent and seen with nanomolar concentrations of Zn2+; the other is voltage-dependent and requires much higher Zn2+concentrations (in the micromolar range). At −60 mV the dose–response curve obtained with tricine-buffered solutions was well fit with a two-binding-site isotherm, using IC50 values of 17 nm and 26 μm having relative weights of 75 and 25%, respectively (Fig. 3A). Qualitatively, these results are reminiscent of the actions of Zn2+ described on native NMDA receptors (Christine and Choi, 1990; Legendre and Westbrook, 1990), but quantitatively the affinity of the site involved in the voltage-independent process appears to be three orders of magnitude higher than reported on native NMDA receptors.
Dose–response curves obtained by applying Zn2+ in nonbuffered solutions (nominal Zn2+ concentrations) resembled those obtained with buffered solutions and showed two well separated regions of inhibition at negative potentials. However, as expected from the presence of contaminating traces of Zn2+ (or another compound) in the control solutions, the points obtained at low Zn2+ concentrations were poorly fit by a standard isotherm (data not shown). The fit was improved greatly by adding to the nominal Zn2+concentrations an assumed contaminating Zn2+concentration. As shown in Figure 3B, at −60 mV a satisfactory fit could be obtained by assuming a contaminating level of Zn2+ of 10 nm. This correction led to IC50 values (6 nm and 32 μm) and to the relative weight of the two effects (78 and 22%), which were very similar to those found with tricine-buffered solutions (see above). Moreover, at positive potentials (e.g., at +50 mV), only the high-affinity Zn2+ inhibition was present. Its IC50 (5 nm) was identical to that calculated at −60 mV, and it saturated at ∼20% of the maximal current (Fig.3D).
In contrast to NR1a–NR2A responses, NR1a–NR2B responses were not affected by heavy metal chelators. This suggested that, if Zn2+ inhibits NR1a–NR2B receptors, the inhibition must be of lower affinity than that of NR1a–NR2A receptors. Indeed, as illustrated in Figure 2B, NR1a–NR2B responses recorded in oocytes were sensitive to Zn2+concentrations (nonbuffered solutions) in the hundreds of nanomolars range and could be inhibited fully, at all potentials, by Zn2+ concentrations of a few tens of micromolars. Interestingly, in this latter concentration range careful observation of the (already highly inhibited) currents revealed a voltage-dependent component of the inhibition (Fig. 2D). This voltage-dependent inhibition was similar to that observed for NR1a–NR2A receptors (see Fig. 5A). Figure 3Cshows the dose–response curve obtained at −60 mV from five cells recorded in the same conditions as those used in Figure2B. In contrast to the case of NR1a–NR2A receptors, fitting the data obtained on NR1a–NR2B receptors did not require correction of the Zn2+ concentration for contaminating Zn2+. At −60 mV the inhibition of NR1a–NR2B responses by Zn2+ could be described by a single-binding-site isotherm with an IC50 of 490 nm ranging from 0 to 100% of the maximal response. Moreover, the IC50 for Zn2+ inhibition is in large part voltage-independent. The relative current amplitudes measured at +50 mV for NR1a–NR2B receptors were fit correctly by a single isotherm with an IC50 of 530 nm(n = 3; data not shown). Thus, Zn2+behaves as a full antagonist of NR1a–NR2B receptors acting mainly via a voltage-independent mechanism.
In summary, Zn2+ exerts a dual block on both NMDA NR1a–NR2A and NR1a–NR2B receptors: the first, which is voltage-independent, is seen at lower Zn2+concentrations than the second, which is voltage-dependent. Quantitatively, there are two major differences between the voltage-independent Zn2+ inhibition of NR1a–NR2A and NR1a–NR2B receptors. The IC50 of the voltage-independent inhibition is, under the recording conditions used here, 50-fold lower for NR1a–NR2A receptors than for NR1a–NR2B receptors. Moreover, the voltage-independent inhibition can block only 80% of NR1a–NR2A responses, whereas it can block entirely NR1a–NR2B responses.
Slow dissociation of Zn2+ from NR1a–NR2A receptors
Further evidence for a high-affinity voltage-independent Zn2+ inhibition of NR1a–NR2A responses was obtained by analyzing the relaxations produced by Zn2+concentration jumps applied during a NMDA response. These experiments were performed on transfected HEK cells lifted from the bottom of the dish to allow rapid solution exchange. Tricine (10 mm) was present both in the “0” Zn2+ solution and in the test solution. The presence of free tricine at a nearly constant level throughout the experiment minimized the chance of repetitive binding of Zn2+ in a putative region of restricted diffusion that artifactually could slow the relaxation kinetics. The free Zn2+ concentration was a few tens of nanomolars, a range in which Zn2+ produces only the high-affinity voltage-independent inhibition (see Fig. 3A). Representative traces of concentration jump experiments are shown in Figure4. The current relaxations observed at the onset and at the offset of the Zn2+ application were well fit by single exponentials. In the example illustrated, the on and off time constants were 390 msec and 1.7 sec, respectively, for a free Zn2+ concentration of 20 nm (Fig.4A). The corresponding values were 116 msec and 1.9 sec with 100 nm free Zn2+ (Fig.4B). Similar values were obtained in a series of four experiments performed at −50 mV with a free Zn2+concentration of 20 nm: τon = 370 ± 80 msec; τoff = 1.7 ± 0.2 sec.

Slow dissociation of Zn2+ from NR1a–NR2A receptors. Current relaxations that follow a Zn2+ concentration jump were analyzed in HEK 293 cells expressing NR1a–NR2A receptors. Each tracerepresents an individual response to a 14.5 sec pulse of glutamate (100 μm) on a background of glycine (100 μm). Tricine (10 mm) was present throughout the experiment. Zn2+ was applied for 3 sec during the pulse of glutamate once the response had reached a steady level. The Zn2+ concentrations as indicated in the figure correspond to the calculated free Zn2+ concentration in the tricine-buffered solutions (see Materials and Methods). The onset and offset of the inhibition by Zn2+ were fit by single exponentials (superimposed on the current traces) with time constants τon and τoff, as indicated in the figure. Data were filtered at 100 Hz and sampled at 140 Hz. The holding potential was −50 mV.
Assuming that there is only one high-affinity voltage-independent Zn2+ binding site and that Zn2+interaction with the receptor follows a simple bimolecular reaction (as suggested by the Hill coefficient, close to 1; see Fig. 3), the onset time constant, τon, should depend on the Zn2+ concentration [τon = 1/([Zn2+]kon +koff), in which kon is the Zn2+ association rate constant andkoff the Zn2+ dissociation rate constant]. The offset time constant, τoff, should be independent of the Zn2+ concentration (τoff = 1/koff). These simple predictions were, indeed, fulfilled. konwas found to be close from 108m−1 · sec−1.koff was estimated to be 0.6 sec-1. The KD derived from these values (KD =koff/kon) was 6 nm, a value in very good agreement with the values estimated independently from dose–response curves. It is worth noting that such a result does not depend on the expression system, because concentration jumps were performed on HEK cells, whereas dose–response curves were obtained with Xenopus oocytes.
We also performed concentration jump experiments on NR1a–NR2B receptors. Two series of experiments were performed, one under conditions similar to those used for NR1a–NR2A receptors (1 mm extracellular Ca2+ ions) and the other in which extracellular Ca2+ ions were replaced by 0.3 mm Ba2+ to mimic the conditions used for obtaining Zn2+ dose–response curves in oocytes. Because of the low affinity of the NR1a–NR2B receptors for Zn2+ (see Fig. 3C), these experiments required relatively high Zn2+ concentrations (1–5 μm). As a consequence, the Zn2+-induced on-relaxations were very fast (τ ≤ 50 msec), and the evaluation of their time constant was made uncertain by the relatively slow speed of our whole-cell perfusion system (time constant, ∼20 msec). This limitation did not apply to the evaluation of the off-relaxations. In the two sets of experiments the off-relaxations after Zn2+ withdrawal were very similar [τoff = 63 ± 17 msec (n = 6) with 1 mm Ca2+ and τoff= 70 ± 14 msec (n = 3) with 0.3 mmBa2+] and much faster than those observed with NR1a–NR2A receptors (see above). The rate of Zn2+dissociation calculated from these relaxations was on the order of 15 sec−1, i.e., ∼25-fold larger than that calculated for NR1a–NR2A receptors.
Using this dissociation rate value and the amount of steady-state Zn2+ inhibition measured at the end of the Zn2+ application [53 ± 7% (n= 4) with 1 mm Ca2+ and 5 μm Zn2+; 49 ± 2% with 0.3 mm Ba2+ and 1 μmZn2+], we calculated Zn2+association rates of 3.2 · 106m−1 · sec−1 and 1.4 · 107m−1 · sec−1, respectively. The sensitivity of these rates to the external divalent ions Ca2+ and Ba2+ suggests that these ions compete with Zn2+ for occupancy of the voltage-independent inhibition site in NR1a–NR2B. This would explain why the steady-state inhibition observed with these receptors in the presence of 1 mm Ca2+ and 5 μmZn2+ was much lower than that predicted by the apparent KD of 0.5 μm measured in oocytes. Replacing external Ca2+ by Ba2+ had no significant effect on Zn2+ inhibition of NR1a–NR2A receptors (data not shown). The difference in Zn2+ on-rates between NR1a–NR2A and NR1a–NR2B receptors thus could, at least partly, result from a lowering of the NR1a–NR2B on-rate by the competition among Zn2+, Ca2+, and Ba2+.
Overall, the results of the concentration jump experiments indicate that the difference of Zn2+ affinity between NR1a–NR2A and NR1a–NR2B receptors is attributable mainly to a difference in the dissociation rate of Zn2+.
The low-affinity voltage-dependent Zn2+ block
As shown in Figures 2 and 3, at negative potentials and at high enough Zn2+ concentrations (1–100 μm) a voltage-dependent blocking action of Zn2+ is superimposed on the voltage-independent one. This voltage-dependent inhibition is seen with both NR1a–NR2A and NR1a–NR2B responses, but in the second case it is masked by the fact that it overlaps with the voltage-independent block (see Fig. 2C,D). Consequently, the voltage-dependent Zn2+ inhibition was characterized more easily on NR1a–NR2A receptors.
Figure 5A shows representative current–voltage relations of NR1a–NR2A currents recorded inXenopus oocytes at different Zn2+concentrations in the micromolar range (1, 10, 30, 100, and 300 μm from −100 to +50 mV). The traces are shown on an expanded current scale to restrict the display to the component of the maximal response that remains after addition of 1 μmZn2+ has saturated the site responsible for the high-affinity voltage-independent inhibition. Increasing the concentration of Zn2+ above 1 μmproduced little change in the outward currents but markedly reduced the inward currents. The fraction of the channels that were not blocked by the voltage-dependent process (the unblocked fraction) was evaluated as the ratio (normalized to 1 at +50 mV) of the glutamate-induced current measured during a voltage ramp in the presence of Zn2+ over the current in “0” Zn2+ solution. Figure 5B shows that the block increased as the potential was made more negative. The voltage dependence of the Zn2+ block differs from that seen in the same system with Mg2+ (see Kuner and Schoepfer, 1996): in the presence of Zn2+, below −60 mV the inward current becomes nearly independent of the potential, in contrast to the case of Mg2+, in which at very negative potentials the current tends to zero, leading to the “bell-shaped” current–voltage relations described by Nowak et al. (1984) and by Mayer et al. (1984). Even at the highest Zn2+ concentration tested (300 μm) and at the most negative potentials applied (−100 mV), the response is not blocked fully. The absence of a parallel shift between the different unblocked fraction curves obtained with increasing Zn2+ concentrations further suggests that the voltage-dependent Zn2+ inhibition is different from the Mg2+ block of NMDA responses, possibly because Zn2+ ions can permeate (escape) more readily through the channel (see Discussion).
The affinity for Zn2+ of the site accounting for the voltage-dependent block of the NR1a–NR2A receptor was determined at different membrane potentials, using values obtained from normalized unblocked fraction plots such as the one shown in Figure 5B(see Materials and Methods). The block by Zn2+ was well fit by a single-binding-site isotherm over the range from −100 to 0 mV (Fig. 5C), assuming that the slight voltage dependence observed at 1 μm Zn2+ is attributable to an unrelated effect (e.g., binding to surface charges or to a superficial divalent binding site in the external vestibule of the pore; see Ascher and Nowak, 1988; Premkumar and Auerbach, 1996). The calculated apparent KD values were 22 μm at −100 mV, 31 μm at −80 mV, 41 μm at −60 mV, 100 μm at −40 mV, 346 μm at −20 mV, and 1162 μm at 0 mV (Fig.5D). The last value (at 0 mV) is five orders of magnitude higher than that of the voltage-independent antagonism (∼10 nm; see Fig. 3). The fact that the apparentKD is not a simple exponential function of the membrane potential is expected from a model in which the blocking ion is permeant (see Discussion).
A pore mutation in NR2A selectively suppresses the voltage-dependent Zn2+ inhibition
Our data are in agreement with the idea that Zn2+ acts at two different sites on NR1a–NR2A receptors: one extracellular, outside the membrane field and accounting for the high-affinity voltage-independent inhibition, and the other inside the channel, accounting for the voltage-dependent block (Christine and Choi, 1990). To try to dissociate the two sites, we used mutated NMDA receptors and took advantage of the fact that the voltage-dependent Zn2+ inhibition presents some similarities with the Mg2+ block of NMDA channels and that molecular determinants involved in Mg2+block have been identified. The strongest effects on Mg2+ block were obtained by mutating the residue occupying the Q/R/N site of the M2 region, the putative channel-forming segment of the protein. In particular, Burnashev et al. (1992),Sakurada et al. (1993), and Kawajiri and Dingledine (1993) showed that the substitution of asparagine N598 of the NR1 subunit by an arginine results in a total suppression of the external Mg2+block. We found that a similar effect could be obtained by replacing asparagine N595 of the NR2A subunit by a lysine [NR2A(N595K)] (unpublished results). Consequently, we expressed NR1a–NR2A(N595K) receptors in Xenopus oocytes and compared their sensitivity to Zn2+ and to heavy metal chelators with that of wild-type NR1a–NR2A receptors.
As shown in Figure 6A, at −60 mV the strong inhibition produced by 1 μmZn2+ was comparable for the mutant and wild-type receptors. The ratio of the current recorded in 1 μmadded Zn2+ over the current recorded in “0” Zn2+ was 0.19 ± 0.02 (n = 5) for the mutant receptors and 0.22 ± 0.04 (n = 17) for the wild-type receptors (see Fig. 3B). In contrast, the additional voltage-dependent inhibition of NR1a–NR2A responses produced by 100 μm Zn2+ was not observed with NR1a–NR2A(N595K) responses (n = 7).

A pore mutation selectively eliminates the low-affinity voltage-dependent Zn2+ inhibition.A, Comparison of the inhibitory effects of Zn2+ on NMDA responses recorded at −60 mV in oocytes expressing wild-type NR1a–NR2A receptors or mutant NR1a–NR2A(N595K) receptors. Shown are superimposed individual responses to a 20 sec pulse of glutamate and glycine (100 μm each) recorded in the presence of a Zn2+ chelator (“0”Zn2+ concentration; 1 μm TPEN for wild-type receptors and 2 μm DTPA for mutant receptors) or in the presence of 1 or 100 μm added Zn2+. Both types of receptors are strongly inhibited by 1 μm Zn2+, but the presence of 100 μm Zn2+ fails to produce an additional inhibition on the mutant receptors. B, Leak-substractedI–V curves from Xenopus oocytes expressing the mutant NR1a–NR2A(N595K) receptors in the absence (“0” Zn2+; 2 μmDTPA) or in the presence of added Zn2+ (1 and 100 μm). The traces obtained in 1 and 100 μm Zn2+ are superimposed almost perfectly over the whole voltage range, indicating that the voltage-dependent inhibition by Zn2+ has been suppressed by the mutation.
Voltage ramps applied to oocytes expressing NR1a–NR2A(N595K) receptors confirmed that the currents recorded in the presence of 1 and 100 μm Zn2+ were identical over the whole voltage range tested (from −100 to +50 mV), indicating the disappearance of the voltage-dependent block. The voltage-independent inhibition was not affected by the mutation and, as in the wild-type receptors, affected only ∼80% of the maximal response at saturating Zn2+ concentrations (Fig. 6B, reproduced in seven cells). Moreover, we found that, like NR1a–NR2A responses, NR1a–NR2A(N595K) responses were potentiated by the addition of 1 μm TPEN (current ratio TPEN/control = 2.1 ± 0.1; n = 2).
Heavy metal chelators potentiate native NMDA responses
The effect of TPEN was investigated on native NMDA receptors in nucleated patches excised from embryonic mouse cortical and diencephalic neurons (Sather et al., 1992). The experimental conditions were identical to those used for the HEK cells, except that glutamate was replaced by NMDA to activate specifically the NMDA type of glutamate receptors. Most neuronal NMDA responses were potentiated by the presence of 1 μm TPEN (11 cells of 12), but the potentiating factor was highly variable from one neuron to the other, ranging from 1.1-fold to a maximum of 1.6-fold (Fig.7A; mean potentiation 1.25 ± 0.17;n = 12). Figure 7B illustrates two examples representative of the range of the effect of TPEN on neuronal NMDA currents: one with a clear potentiation (top panel, peak current ratio TPEN/control = 1.4) and the other with virtually no potentiation (bottom panel, peak current ratio TPEN/control = 1.0).
The potentiations observed in neuronal receptors were never larger than twofold, whereas a factor of three was common with NR1a–NR2A receptors. This could indicate that, in our cultures, there are none or very few neurons endowed exclusively with NR1a–NR2A receptors, consistent with some previous findings (see Discussion and Paoletti et al., 1995). On the other hand, the results show that the large majority of neurons does express NMDA receptors that are potentiated by the addition of micromolar concentrations of TPEN and therefore are inhibited substantially by a contaminant heavy metal present at a submicromolar concentration. This suggests that most of the tested neurons contained a fraction of NMDA receptors highly sensitive to Zn2+.
The large variability of the magnitude of the potentiation by TPEN of native receptors probably reflects the subunit composition heterogeneity known to occur in primary cultures of neurons (Williams et al., 1993; Audinat et al., 1994; Paoletti et al., 1995). This suggestion was reinforced by expanding the study of the effects of the addition of TPEN and by determining the Zn2+ binding affinities of recombinant NMDA receptors (expressed inXenopus oocytes) other than NR1a–NR2A and NR1a–NR2B. The absence of an effect of TPEN on NR1a–NR2B receptors was found also for NR1b–NR2B receptors (current ratio TPEN/control = 0.98 ± 0.02; n = 4). The potentiating effect of TPEN seen on NR1a–NR2A receptors also was seen with NR1b–NR2A receptors, but it was smaller (current ratio TPEN/control = 1.21 ± 0.02;n = 3). As shown in Table 2, the voltage-independent Zn2+ antagonism has a unique pharmacological profile on each recombinant receptor tested. The comparison of these profiles shows that the voltage-independent Zn2+ inhibition extends over a range of three orders of magnitude (NR1a–NR2A receptors being the most sensitive and NR1a–NR2C receptors being the least sensitive) and depends on the nature of both NR2 and NR1 subunits. NR1b subunits contain exon 5, a 21-amino-acid N-terminal exon that is positively charged and known to affect the interaction of NMDA receptors with positively charged molecules and ions (Hollmann et al., 1993; Williams, 1994; Williams et al., 1994; Zhang et al., 1994; Zheng et al., 1994; Paoletti et al., 1995). It is interesting to note that it also appears to modify the interaction of recombinant heteromeric NMDA receptors with Zn2+.
Subunit-specific voltage-independent Zn2+ inhibition
Zn2+ chelation is probably responsible for the NR2A-specific fast potentiation of NMDA responses by reducing agents
Experiments on recombinant NMDA receptors expressed in HEK cells have shown that sulfhydryl reducing agents such as dithiothreitol (DTT) or reduced glutathione potentiate recombinant NMDA channel activity via a dual mechanism. All of the receptors tested (heteromers composed of NR1 subunits and of one type of the NR2 subunit family) show a slowly developing potentiation (time scale of minutes) that does not reverse after washout of the reducing agent (Köhr et al., 1994). NR1–NR2A receptors show an additional marked potentiation (≥threefold) with a very rapid onset (maximal from the first pulse in DTT; see Köhr et al., 1994). This fast potentiation is reversed by the removal of the reducing agent and is associated with a slowing of desensitization and an acceleration of deactivation of glutamate-activated currents (Köhr et al., 1994). Both types of potentiation have been assumed to involve sulfhydryl-containing redox sites (Köhr et al., 1994). However, the striking similarities (in magnitude, in kinetics, in subunit specificity) between the NR2A subunit-specific potentiation by DTT and the NR2A subunit-specific potentiation by heavy metal chelators could be accounted for by the strong Zn2+ binding properties of DTT (absoluteKD of 10−10.3mat pH 9.2; Cornell and Crivaro, 1972), suggesting that the subunit-specific action of DTT is attributable to chelation of a contaminant heavy metal.
Experimental evidence for this hypothesis was obtained by testing the additivity of the potentiations produced by TPEN and DTE, the erythroisomer of DTT. In HEK cells expressing NR1a–NR2A receptors, glutamate-activated currents were recorded in control conditions, in the presence of TPEN (1 μm) or DTE (3 mm), and in the presence of both TPEN and DTE. The concentration of DTE was similar to the concentration of DTT used by Köhr et al. (1994). As shown in Figure 8A, the potentiation produced by TPEN, by DTE, and by DTE plus TPEN were similar (current ratios: TPEN/control = 2.8 ± 0.01,n = 2; DTE/control = 2.9 ± 0.1, n= 2; TPEN+DTE/control = 2.9 ± 0.1, n = 2). All three potentiations were immediate (maximal from the first pulse applied 10 sec after the change in condition) and fully reversible (data not shown). Moreover, all three potentiations were associated with a similar acceleration of the dissociation of glutamate as measured by the decrease in the time constant of the glutamate off-relaxation (Fig. 8B). The mean τoffvalue was 139 ± 7 msec (n = 7) in control conditions, 44 msec ± 12 msec (n = 4) in TPEN, 48 ± 16 msec (n = 2) in DTE, and 41 msec (n = 1) in DTE plus TPEN. Similar current amplitudes of the responses recorded at −60 mV in the presence of DTE (3 mm) alone and TPEN (1 μm) plus DTE (3 mm) also were observed in Xenopus oocytes expressing NR1a–NR2A receptors (n = 6). Moreover, we observed that DTE (3 mm) fails to induce fast potentiation effects when applied in the presence of other Zn2+-chelating agents (100 μm EDTA; 1 mm ADA; 10 mm tricine; 1 μm DTPA) (data not shown).

The NR2A subunit-specific potentiation produced by reducing agents is probably the consequence of Zn2+chelation. Shown are glutamate-evoked currents recorded in an HEK 293 cell expressing NR1a–NR2A receptors. The cell was exposed either to a control solution or to TPEN (1 μm) and DTE (3 mm) applied separately or simultaneously. The holding potential was −50 mV. A, Each trace is an individual response to a 2 sec pulse of glutamate (100 μm) applied on a background of glycine (100 μm). The potentiations produced by DTE andTPEN are not additive. B, Glutamate off-relaxations are shown on an expanded time scale and after normalization to the steady-state response amplitude. The decay of the current was fit by a single exponential function (solid lines superimposed on the current traces), with a time constant τoff indicated in the figure. TPEN andDTE applied separately or simultaneously induce similar accelerations of the off response.
Therefore, the fast potentiations of NR1a–NR2A responses by DTE (or DTT) and by TPEN involve a similar mechanism. We propose that the NR2A subunit-specific potentiation of NMDA receptor activity by sulfhydryl reducing agents is caused by chelation of contaminant heavy metal traces, resulting in the relief of a tonic high-affinity inhibition. In the light of the data presented in this work, it seems most likely that Zn2+ is the contaminant metal.
DISCUSSION
Our observations show that the two inhibitory effects of Zn2+ (voltage-independent and voltage-dependent) previously described on native NMDA receptors by Christine and Choi (1990) and by Legendre and Westbrook (1990) also are observed in recombinant NMDA receptors. However, in one class of recombinant receptors (NR1a–NR2A or NR1b–NR2A), the voltage-independent inhibition presents two atypical properties. First, the IC50 of the inhibition is in the nanomolar range (∼10 and 70 nm in NR1a–NR2A and NR1b–NR2A receptors, respectively), i.e., much lower than what previously had been measured in native receptors. Second, the inhibition is never complete, and saturation of the voltage-independent Zn2+ site only reduces the response by 70–80%. While this work was in progress, qualitatively similar conclusions were reported by two other groups (Moshaver and Raymond, 1996; Williams, 1996).
Consequences of the presence of a high-affinity and partial voltage-independent Zn2+ inhibition in NR1–NR2A receptors
The effects of heavy metal chelators described in the present study suggest that contaminating traces of Zn2+ (or of another metal) may be sufficient to strongly inhibit NR1–NR2A receptors through the high-affinity Zn2+ binding site. This may account for some of the discrepancies concerning Zn2+ inhibition of NMDA receptors found in the literature. For example, Hori et al. (1987) were able to block NMDA responses with Zn2+ at micromolar concentrations in slices of rat brain cortex, whereas the same Zn2+concentrations were ineffective in experiments of Hegstad et al. (1989). This could mean either that in the second case the NMDA receptors are insensitive to Zn2+ (as the authors believed) or, on the contrary, that the receptors are so sensitive to Zn2+ that the voltage-independent inhibition already was saturated by contaminating Zn2+ levels. The partial nature of this inhibition in NR1–NR2A receptors may reinforce such misleading conclusions: on a background of Zn2+contamination, an exogenous Zn2+ application will bring the receptors from an already strongly inhibited state to a maximally inhibited state in which ∼20% of the maximal response persists. The small effect observed may be recognized falsely as indicating a very low-affinity Zn2+ inhibition (seeGrimwood et al., 1996). This illustrates the need for a systematic use of metal chelators in evaluating the “control” responses. The presence of contaminant Zn2+ under control conditions in the work of Williams (1996) also may explain the eightfold difference in affinities for Zn2+ of NR1a–NR2A receptors reported in that study and this paper.
A second consequence of the high-affinity Zn2+inhibition is that it leads to a reevaluation of the potentiations produced by DTT and glutathione on recombinant NMDA receptors (Köhr et al., 1994). These authors described two potentiations produced by reducing agents: one slow and irreversible, observed in all of the subtypes tested, and one fast, reversible, and specific to the NR1–NR2A combination. The similarity and the mutual occlusion between this fast potentiation and that produced by metal chelators suggest that the rapid and subunit-specific effects of the reducing agents are better explained by chelation of Zn2+ (or of another metal) contaminating extracellular solutions than by their reducing properties. This reinterpretation further suggests that the “slow” redox modulation of the NMDA receptor, which is sensitive to the mutation of two cysteines identified in the NR1 subunit by Sullivan et al. (1994), is the sole modulation involving redox processes and is not subunit-specific. After suppression of this modulation by mutation of the two cysteines, the residual potentiation observed in NR1–NR2A receptors corresponds to the effects of complexing the contaminant metal.
Using a chimera approach, Köhr et al. (1994) identified a domain in the N-terminal region of the NR2A subunit (between residues 250 and 400) responsible for the “fast redox modulation.” This domain most likely contains some of the molecular determinants of the high-affinity voltage-independent Zn2+ binding site. The point mutagenesis experiments of Köhr et al. (1994) indicate that the cysteine residues contained in this domain are not involved in the subunit-specific potentiation, but the region contains other residues often involved in protein Zn2+ binding sites, like histidines, glutamates, or aspartates (for review, see Christianson, 1991), which may be good candidates for the site mediating the NR2A subunit-specific Zn2+ inhibition.
The voltage-dependent Zn2+ block in recombinant NMDA receptors
The voltage-dependent Zn2+ inhibition of recombinant NMDA receptors resembles that described by Christine and Choi (1990) and by Legendre and Westbrook (1990) in native receptors. It is similar in NR1–NR2A and NR1–NR2B receptors, which does not mean that it does not show subunit specificity: there are actually strong reasons to suppose that the voltage-dependent block by extracellular Zn2+ involves, at least in part, the same amino acids as the extracellular block by Mg2+ (see below), and it is known that the extracellular block by Mg2+ is more marked in NR1–NR2A and NR1–NR2B receptors than in NR1–NR2C and NR1–NR2D receptors (Kutsuwada et al., 1992; Monyer et al., 1992, 1994; Ishii et al., 1993; Kuner and Schoepfer, 1996; Momiyama et al., 1996). One is tempted to predict that in recombinant NR1–NR2C or NR1–NR2D receptors the voltage-dependent Zn2+ block would be smaller than in NR1–NR2A or NR1–NR2B receptors.
Quantitatively, the differences between the Mg2+block and the voltage-dependent Zn2+ block that were described in native receptors by Christine and Choi (1990) and byLegendre and Westbrook (1990) also were observed in recombinant receptors: the apparent voltage dependence of the Zn2+ block (calculated by comparing Zn2+ block at 0 and −100 mV) was lower than that of Mg2+ (δ, the electrical depth of the binding site, was estimated to 0.5 for Zn2+ instead of 0.8–1 for Mg2+; Ascher and Nowak, 1988; Jahr and Stevens, 1990). Such a difference could indicate that Zn2+binds at a more superficial position in the pore than Mg2+. However, as already suggested by Christine and Choi (1990) and Legendre and Westbrook (1990), it more probably is attributable to the fact that Zn2+ permeates the channel more easily than Mg2+. Indeed, the voltage dependence of Zn2+ permeation has a polarity opposite to that of Zn2+ dissociation toward the extracellular compartment. When a significant proportion of the Zn2+ blocking ions dissociate from the blocking site toward the cytoplasm, the apparent voltage dependence of the block provides an underestimation of the depth of the blocking site. In such a permeation/block model, first developed by Woodhull (1973), the apparent voltage dependence of the block should depend on the voltage range in which it is measured because of the change in the relative contribution of the permeation and dissociation processes. This is what was observed in our experiments (see Fig. 5D), and the estimation of the Zn2+ block voltage dependence in the depolarized range (−40 to 0 mV; δ = 0.77) is close to the voltage dependence of Mg2+ block.
The effect of the mutation NR2A(N595K), which suppresses both of the voltage-dependent Zn2+ and Mg2+blocks without affecting the voltage-independent Zn2+ inhibition, provides further support for the hypothesis that in the NMDA channel the Zn2+ and Mg2+ blocking sites are very close (if not superimposed).
Functional consequences of the high-affinity Zn2+ inhibitory site
In most of the native receptors that we tested (on cortical and diencephalic neurons in primary cultures), the complexing of heavy metals produced a potentiation, which was, however, never as large as that observed with NR1a–NR2A recombinant receptors. This indicates that the native receptors were neither pure NR1–NR2B receptors (which are not potentiated by TPEN) nor pure NR1a–NR2A receptors (which are strongly potentiated by the chelators). Such a result, in fact, was expected, given the NMDA subunit heterogeneity revealed by recent RT-PCR studies on neurons (see Gibb and Wyllie, 1997). On the other hand, the presence of a potentiation confirms the early observation ofEimerl and Schramm (1992), who reported that in cultured neurones metal chelators such as EDTA, cysteine, or ortho-phenantroline produced a marked potentiation of the 45Ca influx produced by NMDA agonists.
The same authors extended their observations to the NMDA-induced toxicity and concluded that the high sensitivity to Zn2+ of the NMDA receptors protects the neurons against glutamate neurotoxicity. This interesting conclusion, which contrasts with the fact that Zn2+ potentiates the responses of the other glutamate ionotropic receptors (Rassendren et al., 1990) (see also Smart et al., 1994), needs to be qualified in view of the recent observations of Koh et al. (1996), suggesting that the toxicity of Zn2+ is dependent in large part on Zn2+ entry into the neurons. If this is a general case, the voltage-dependent Zn2+ inhibition may not protect against excitotoxicity because it may be associated with a significant entry of Zn2+ (see above). In contrast, the voltage-independent Zn2+ inhibition may be viewed as truly protective and as such may give an advantage to NR1–NR2A receptors over NR1–NR2B receptors.
The levels of Zn2+ in the synaptic cleft in the intact brain are difficult to deduce from the data currently available. In particular, the relative amount of free Zn2+versus bound Zn2+ (Zn2+ being avidly chelated by proteins) is not known. In any case, it seems clear that, if there are synaptic NMDA receptors with a nanomolar Zn2+ affinity, maximal efficacy for synaptic transmission requires the extracellular free Zn2+level to be brought below 10 nm. This could be achieved by Zn2+ chelation, but it also could involve the presence of powerful uptake systems, a notion that deserves investigation.
Footnotes
This work was supported by the Ministère de l’Enseignement Supérieure et de la Recherche, the Université Pierre et Marie Curie, and the Fondation pour la Recherche Médicale. We thank Boris Barbour for comments on this manuscript, Mariano Casado, who helped in some crucial HEK experiments, and Dani Lévy for culturing the neurons.
Correspondence should be addressed to Dr. Jacques Neyton, Laboratoire de Neurobiologie, Ecole Normale Supérieure, 46 Rue d’Ulm, 75005 Paris, France.
Dr. Paoletti’s present address: Center for Neurobiology and Behavior, Howard Hughes Medical Institute, Columbia University, 722 West 168th Street, New York, NY 10032.


