

Abstract
Fast oscillatory bursts (OBs; 500-600 Hz) are the most prominent response to visual stimulation in the optic tectum of birds. To investigate the neural mechanisms generating tectal OBs, we compared local recordings of OBs with simultaneous intracellular and extracellular single-unit recordings in the tectum of anesthetized pigeons. We found a specific population of units that responded with burst discharges that mirrored the burst pattern of OBs. Intracellular filling with biocytin of some of these bursting units demonstrated that they corresponded to the paintbrush axon terminals from the nucleus isthmi pars parvocellularis (Ipc). Direct recordings in the Ipc confirmed the high correlation between Ipc cell firing and tectal OBs. After injecting micro-drops of lidocaine in the Ipc, the OBs of the corresponding tectal locus disappeared completely. These results identify the paintbrush terminals as the neural elements generating tectal OBs. These terminals are presumably cholinergic and ramify across tectal layers in a columnar manner. Because the optic tectum and the Ipc are reciprocally connected such that each Ipc neuron sends a paintbrush axon to the part of the optic tectum from which its visual inputs come, tectal OBs represent re-entrant signals from the Ipc, and the spatial-temporal pattern of OBs across the tectum is the mirror representation of the spatial-temporal pattern of bursting neurons in the Ipc. We propose that an active location in the Ipc may act, via bursting paintbrushes in the tectum, as a focal “beam of attention” across tectal layers, enhancing the saliency of stimuli in the corresponding location in visual space.
Introduction
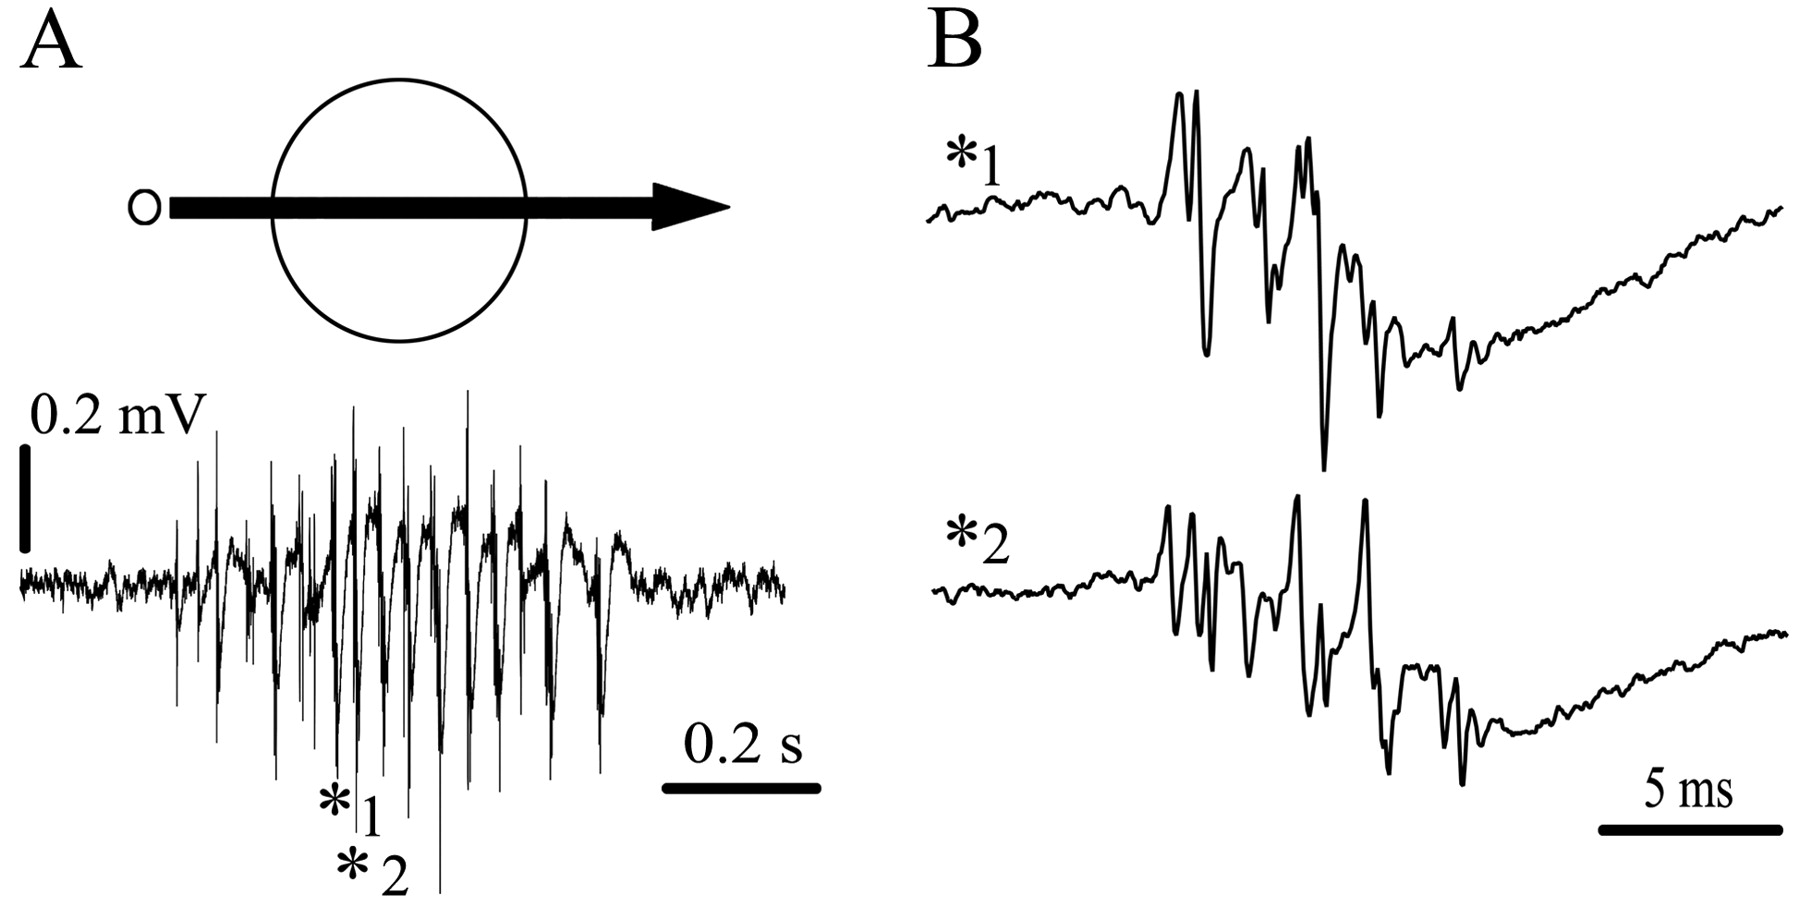
Tectal fast oscillatory bursts (OBs) are manifested as repetitive bursting discharges (burst frequency, 500-600 Hz; burst duration, 2-12 ms; interburst frequency, 20-100 Hz) characteristically recorded throughout the superficial and intermediate tectal layers (1-12) in awake and anesthetized pigeons (Fig. 1). They are the most prominent response to flashing and visual motion stimulation in the tectum of birds and have long been regarded as a manifestation of neighboring neurons firing together (Knudsen, 1982; Neuenschwander and Varela, 1993; Neuenschwander et al., 1996). However, local recordings with tetrodes and radial recordings with metal and silicon (CNCT University of Michigan, Ann Arbor, MI) multielectrode arrays demonstrate that each burst is coherent in a long radial column of ∼150 μm diameter and 800 μm depth, extending from the intermediate tectal layers up to the tectal surface (J. C. Letelier, G. Marín, E. Sentis, and J. Mpodozis, unpublished observations).
In mammals, fast oscillations in neocortex and in hippocampus are synchronized closely to pyramidal (Kandel and Buzsáki, 1997; Grenier et al., 2001; Barth, 2003) and interneuronal (Jones et al., 2000; Klausberger et al., 2003) firing within a cortical region. The biophysical origin of fast oscillations and the mechanism of their synchronization have been matters of intense discussion (Kandel and Buzsáki, 1997; Draguhn et al., 1998; Csicsvari et al., 1999; Jones and Barth, 1999; Baker et al., 2003; Barth, 2003; Grenier et al., 2003; Traub et al., 2004).
To investigate the neural mechanisms generating the OBs in the tectum of anesthetized pigeons, the present study compared local recordings of OBs with simultaneous single-unit extracellular and intracellular recordings in the same tectal column with two main objectives. The first objective was to describe, within a tectal column, the temporal correlation between the discharges of the units and the local OBs, and the second was to identify by intracellular filling and other methods the neuronal elements synchronized to the OBs. The results identify the paintbrush terminals in the tectum coming from the nucleus isthmi pars parvocellularis (Ipc) nucleus as the neural elements generating tectal OBs. The optic tectum and the Ipc are reciprocally connected in a highly precise homotopic manner, such that each Ipc neuron sends a columnar ramifying, presumably cholinergic (Sorenson et al., 1989; Bagnoli et al., 1992; Medina and Reiner, 1994; Hellmann et al., 2001; Wang et al., 2004) paintbrush axon to the part of the optic tectum from which its visual inputs come (Hunt et al., 1977; Wang et al., 2004). Therefore, tectal OBs are re-entrant signals to the optic tectum generated in the Ipc, and the spatial-temporal pattern of OBs across the tectum is the mirror representation of the spatial-temporal pattern of bursting neurons in the Ipc.

Representative recordings of tectal OBs. A, OB response recorded with a tungsten microelectrode from the superficial layers of the tectum (depth, 300 μm). The response was evoked by moving a bright dot (2°, 45°/s) across an RF of∼25°. The signal was filtered between 10 Hz and 10 kHz. B, Two individual OBs (asterisks in A) expanded in time, showing their variability and oscillatory appearance. Each OB occurs during the descending phase of a negative potential.
Because the optic tectum is a topographically mapped, conspicuously laminated structure with stratification of different inputs and outputs (Luksch, 2003), we propose that bursting, cholinergic paintbrushes extending across layers may act as a spatially localized “beam of attention,” enhancing the saliency of stimuli in the corresponding location in visual space. Some of these results have been presented at the 2003 and 2004 meetings of the Society for Neuroscience.
Materials and Methods
Twenty-five feral pigeons (300-350 g) of both sexes, obtained from a local dealer and maintained in an institutional facility, were used in these experiments. All procedures were approved by the Science Faculty's Ethics Committee of the University of Chile and conformed to the guidelines of the National Institutes of Health on the use of animals in experimental research.
Surgical procedures. The pigeons were anesthetized by intramuscular injection of ketamine (5 mg/kg) and xylazine (50 mg/kg); they were positioned in the standard stereotaxic position (Karten and Hodos, 1967) in a head holder that did not interfere with the animal's visual field. Anesthesia was maintained by infusing 30% of the initial dose every 2 h via an intramuscular cannula. During the experiment, the electrocardiogram was continuously monitored, and the body temperature of the animal was kept at 38-42° by means of a thermo-regulated blanket. A small window was opened in the skull, exposing the lateral part of the tectum, which contains the projection areas of the lateral fovea, the tip of the pecten, and the most nasal portion of the red field (Letelier et al., 2004). The dura was removed, and the tectal surface was covered with 3% agar.
For the intracellular recording experiments, the pigeons were paralyzed with curare (0.5 mg/kg) and ventilated by a steady air flow entering through a tracheal cannula and exiting via a cannula in the posterior air sac, regulated at ∼1.5 L/min to maintain a stable heart-beat rate. To prevent tectal pulsations, a thin stainless-steel plate (0.2 × 2 × 20 mm) was inserted 5 mm in the dorsal medial part of the tectum through a slot in the bone drilled just above the bone window. The plate was positioned inside the tectal ventricle by gently lifting the tectal slab that forms the roof of the ventricle and then covering the tectal surface with 3% agar. Although this procedure destroyed cells and cut fibers coming from the medial side to the recording site, it did not affect the retinal input, which enters the tectum from its anterior-inferior pole. Recordings in the tectal slab, 2-3 mm away from the metal plate insertion, showed all the visual responses normally recorded in the intact tectum. This procedure was used to identify, by intracellular filling with biocytin (Sigma, St. Louis, MO), neurons with well characterized responses in the normal preparation.
Physiological recordings. Single units were recorded using micropipettes pulled from borosilicate glass (inner diameter, 0.86 mm; outer diameter, 1.5 mm; Sutter Instruments, Novato, CA) filled with 2 m sodium acetate or potassium acetate. The micropipettes for extracellular recordings were 10-30 MΩ; those for intracellular recordings were 30-80 MΩ, lowered from the surface of the tectum in radial penetrations in 1-2 μm steps using an hydraulic manipulator (David Kopf Instruments, Tujunga, CA). For intracellular recording and current injection, a standard intracellular amplifier (NB-100-1; Biomedical Engineering, Thornwood, NY) was used (DC to 10 kHz); for extracellular recording, a dual-channel amplifier (1800; AM Systems, Everett, WA) was used (10 Hz to 10 kHz). To obtain intracellular labeling, 2% biocytin was added to the recording pipette; once a stable intracellular recording was attained, current was injected using 2-5 nA pulses of 0.5 s duration, 50% duty cycle, for 10-30 min while monitoring the responses of the cell.
Simultaneous with the single-unit recording, tectal OBs were recorded using a low-impedance (1-1.5 MΩ) tungsten microelectrode 200-400 μm below the tectal surface, near the radial path of the micropipette. A chlorided silver wire was implanted permanently near the access hole as a reference electrode.
The Ipc was approached in radial penetrations through the tectal window. Once an Ipc unit was isolated and its receptive field (RF) mapped on the stimulating screen, the tectal electrode was positioned so that the RF of the tectal fast oscillation was superimposed on the RF of the Ipc unit(s) being recorded.
To transiently inactivate a locus in the Ipc, a double-barreled glass microelectrode was used, one barrel containing a sharp tungsten electrode, protruding 20-30 μm, the other barrel, with a tip of 20-30 μm, was filled with 2% lidocaine. The microelectrode was placed in the Ipc by monitoring the visual responses in the tungsten barrel. Then, after positioning the tectal electrode(s) to find superimposed RFs, the local region of the Ipc was transiently inactivated by injecting 5-20 micro-drops of lidocaine (total volume, 12-50 nl) using a custom-made picospritzer controlled by a pulse generator. The size and the number of drops necessary to locally inactivate neural tissue in the pigeon were estimated in a separate experiment by injecting micro-drops of lidocaine in the superficial layers of the tectum and recording visually evoked potentials at different distances from the injection site.
At the end of selected penetrations in the Ipc, marking lesions were made by passing 4 μA of positive current for 4 s through the tungsten barrel.
Visual stimulation. Visual stimulation consisted of a small (0.5-5°) bright spot presented on a video monitor 42 cm from the pigeon's eye. The spot was moved across the visual field at constant velocity of 15-55 °/s by a computer-based stimulus generator (Leonardo; Lohmann Research Equipment, Castrop-Rauxel, Germany). Most frequently the stimulus was moved in the temporal to nasal direction in repeated sweeps separated by 4-20 s, which elicited strong firing in the Ipc and in most tectal units.
Data acquisition. All physiological data were sampled continuously at 20 kHz using a standard personal computer with a 16-channel analog-to-digital converter board (National Instruments, Austin, TX); data acquisition and off-line analysis were performed using the Igor Pro 5.0 (WaveMetrics, Lake Oswego, OR) software environment. Fast oscillatory activity and spikes were separated by digital filters. Single units were isolated by a window discriminator algorithm; isolation was verified by the presence of a refractory period in the spike autocorrelograms.
Correlation methods. Autocorrelation functions for single units were calculated from individual recording traces, normalized by dividing the count in each 1 ms bin by the total number of spikes. To correlate the OBs and single-unit activity, each OB trace was normalized by dividing by its SD, and spike-triggered averages (STAs) were computed using the spikes as trigger sources. The autocorrelograms and STAs were only calculated if the unit produced >200 spikes in 18 stimulus presentations. Autocorrelograms and STAs were determined during the visual response. (To test the validity of the STAs, we shuffled the data by triggering the average from the spikes of the subsequent trial.) To compare the magnitudes of the STAs, we divided the signal near the peak (expressed as the SD from -50 to +50 ms) by the signal far from the peak (SD of -100 to -50 ms and +50 to +100 ms). When this cross-correlation index was >2, we regarded the STA as significant.

Units with sustained responses are not synchronized to the OBs. A, B, Simultaneous recording of the OB response(top trace) and a single unit (bottom trace), with a superimposed RF, in response to a moving bright dot (visual angle, 2°; 40 °/s) from the superficial (A) and deep (B) layers. C, D, Time expansion of marked section of traces above. Note the lack of correlation between the firing of the unit and the OBs. E, F, The autocorrelograms as the histograms of spike times, expressed as probability of firing in 1 ms bins, showing the lack of temporal modulation of the units. STA of the OB traces using the unit spikes as the triggers. The amplitude is expressed in units of SD of the voltage of the averaged OB traces. The flat STA demonstrates the lack of correlation between the firing of the unit and the OBs. Up in all traces is negative.
Histological procedures. In the cases in which biocytin was intracellularly injected, after 2 h or more, the animal was perfused, under deep anesthesia, via the carotids with 300-500 ml of avian Ringer's followed by 500 ml of a cold (10°) solution of 4% paraformaldehyde in 0.1 m phosphate buffer, pH 7.4. Then the brains were excised, postfixed overnight, and transferred to 30% sucrose for 2 d, after which the brains were cut in 45 μm coronal sections and processed (ABC Elite kit; Vector Laboratories, Burlingame, CA). In cases in which marking lesions were made, the animals were given a 1 d survival period, and after perfusion, the brains were processed for a standard Nissl or Giemsa protocol. In all cases, serial sections were examined and photographed using a conventional microscope (Bx 60; Olympus, Melville, NY) coupled to a Spot digital color camera (Diagnostic Instruments, Sterling Heights, MI).
Results
Recordings from 95 well isolated tectal units (in 21 pigeons) that responded to visual motion stimulation were obtained in these experiments. They were separated in two main classes according to the sustained or bursting character of their firing responses.
Optic tectum units with sustained responses
Most units recorded in the optic tectum have sustained responses in that a bright spot moving through their RF causes no obvious clustering of spikes (Fig. 2A,B), and the autocorrelograms show no significant modulation (Fig. 2E,F). The firing of these units was not correlated with the locally recorded OBs (Fig. 2C,D) and, accordingly, the STA triggered by the unit spikes never showed a significant correlation (average cross-correlation index, 1.2 ± 0.2; n = 27) (Fig. 2E,F).
In the superficial and intermediate layers of the optic tectum, units with sustained responses (34 units analyzed) (Fig. 2A,C,E) included directionally selective units and units that adapted strongly to repeated stimulation. These units had concentric RFs 10-25° in diameter with a suppressive periphery, except for two cases in which the excitatory and inhibitory zones were side by side.
In the deep layers (below 900 μm; 14 units analyzed) (Fig. 2B,D,F), units with sustained responses had negative spikes and larger RFs (25-40°) and were more homogeneous in their properties, especially in the regularity of firing to the motion of a small target. In previous experiments using tungsten electrodes, marking lesions showed that these neurons were located in layer 13 and presumably correspond to tectal ganglion cells, which possess very large (∼2 mm) radially oriented dendritic arbors with characteristic “bottle-brush endings” distributed in specific tectal laminas (Luksch et al., 1998, 2001; Marín et al., 2003).
Optic tectum units with bursting responses
Units that fired with short sequences of bursts in response to visual stimulation were recorded at all depths in the tectum. In contrast to the sustained units, all bursting units exhibited a very tight synchrony with the locally recorded OBs (Fig. 3), albeit with minor discrepancies (Fig. 3A-D). The coupling between the firing of these units and the OBs was shown both by the tight correlation between the duration of the bursts of spikes and the duration of the OBs (mean slope, 0.76; mean correlation, 0.81; n = 10 units) (Fig. 3E,F) and by significant spike-triggered averages (Fig. 3E,F). The oscillatory modulation of the central peak of the STAs indicates that individual spikes tend to keep the same phase as individual OBs. Of 26 units (12 in the superficial and intermediate layers and 14 in the deep layers), 24 showed a significant cross-correlation with the OBs by STA (average cross-correlation index, 2.8 ± 0.8).
Bursting units recorded from the superficial layers (n = 22; depths, 100-600 μm; mode, 500 μm) had small negative spikes that were difficult to isolate and could not be penetrated despite the use of fine pipettes, suggesting that they originated from closely packed thin elements. Bursting units recorded from depths of 600-1500 μm (n = 20) had large positive spikes that fired in sequences of short bursts. These recordings appeared to be from thick vertical processes, in that the spikes appeared suddenly as the electrode was advanced and then were retained for up to 100 μm, as if the pipette was sliding in close contact with a process. Although penetration of these units was difficult, we succeeded in five cases.
Remarkably, in all five cases, the labeled processes displayed the characteristic morphology of the ascending paintbrush terminals from the Ipc (Fig. 4A). They were thick axonal processes coming upward from the white matter, branching into two or three secondary branches at the level of layer 10 and branching profusely into thinner processes, especially at the level of layer 5, and extending to layer 2. All fine branches, from layers 10-2, carried a high density of round boutons. Thin scattered collaterals also extended down to layer 11. In two cases in which the survival time after the injection was long enough, the cell body of the axon was located inside the Ipc (Fig. 4B).

Units with bursting responses are synchronized to the OBs. A, B, Simultaneous recording of the OB response (top trace) and a single unit (bottom trace), with a superimposed RF, in response to a moving bright dot (visual angle, 2°; 40 °/s) from the superficial (A) and deep (B) layers. The units discharge a burst of spikes during each OB recorded in the same tectal column. C, D, Time expansion of marked section of traces above. The spikes in D are large and positive, indicative of a close contact between the pipette and the unit, although no significant drop in the DC potential was discernible. E, F, The duration of the OB is tightly correlated with the duration of the burst of firing by units with the same RF (E, slope, 0.67, r 2 = 0.92; F, slope, 0.68, r 2 = 0.66). The STAs illustrate the synchrony of the burst response to the OBs. Note the ripple-like modulation of the STA near time 0, indicating that the intraburst firing of the unit occurs at constant latencies from the individual components of the OBs. The bottom curve in the STA graphs (displaced vertically for clarity) is a control STA obtained by shuffling the recording traces.
Recordings from the Ipc
Multiunit recordings from the Ipc showed RFs with two distinct properties: movement of a small target in a central circular region, 15-25° in diameter, elicited strongly bursting firing, like that of the tectal OBs, whereas in a larger surrounding area, this stimulus elicited regular, high-frequency (500-600 Hz) negative spikes (100-400 μV) (Fig. 5E). The relative amplitude of the two responses changed as the electrode was moved in the Ipc, suggesting that they were generated by different neuronal elements, rather than representing a conventional center-surround RF organization. Only rarely did either response occur except during visual stimulation. We infer that these peripheral responses in the Ipc represent activity from axonal terminals from the nucleus isthmi pars magnocellularis (Imc) (see Discussion).
Four lines of evidence show that the bursting response in the Ipc caused the bursting response in tectal units, and therefore the OBs, via the Ipc paintbrush terminals in the optic tectum. First, when multiunit Ipc receptive fields were recorded together with those of the homotopic OBs, the two RFs matched closely. Second, in this situation, the Ipc activity had strongly bursting modulation at the same frequency as the homotopic tectal OB, and the two responses were tightly synchronized (Fig. 5B,D). Third, 20 ms flashes elicited simultaneous bursts in the Ipc and the optic tectum (Fig. 5A), preceded by 10-25 ms by a negative tectal potential that presumably represented retino-tectal postsynaptic potentials (Letelier et al., 2000) (Fig. 5A, open arrow). Fourth, 70-80% of the spontaneous bursts in the Ipc were simultaneous with spontaneous tectal OBs in the homotopic location. This virtual simultaneity is expected as Ipc-to-tectum latency may be as short as a fraction of a millisecond (0.5 ms assuming a 10 m/s conduction velocity and a 5 mm distance), given that Ipc axons are unusually thick (diameter, 2-3 μm) and myelinated (Hunt et al., 1977). However, any mismatch in the RFs introduced a phase shift (positive or negative) between the tectal OBs on the one hand, and Ipc or bursting units from the deep layers on the other (Fig. 3D), which could be explained by the observation that in the Ipc and in the tectum burst latency increased from the center to the periphery of the RF (data not shown). This increase in latency reveals an indirect horizontal mechanism in the visual input to Ipc neurons from the peripheral parts of their central RF.
These characteristics were observed in 16 penetrations in the Ipc from 10 pigeons, as indicated by visual inspection of the recordings and by the STAs. As expected from the precise topographic reciprocal connection between the Ipc and the optic tectum (Hunt et al., 1977; Wang et al., 2004), Ipc RFs are retinotopically organized, with anterior RFs in rostral Ipc and superior RFs in lateral Ipc.

Units with bursting responses recorded in the intermediate and deep layers correspond to paintbrush terminals in the tectum coming from the Ipc. A, Paintbrush terminal stained after recording in layer 10. Note the column-like ramification of the terminals, starting in layer 10 and extending up to layer 2, with profuse branches in layer 5. B, Cell body in Ipc back-filled from the axon terminal shown in A.
In five intracellular recordings from neurons in the Ipc (identified in two cases by filling the cell with biocytin and in three cases by reconstruction of the penetrations), the same burst pattern shown by the Ipc multiunit recordings and by the tectal OBs was seen: all had circular RFs of <25° in diameter (Fig. 5F).

Activity in the Ipc is synchronized to tectal OBs with superimposed RFs. A, Simultaneous recording of multiunit activity in the Ipc and tectal OBs with superimposed RFs in response to 20 ms, 4° stimulus flash. The Ipc RF was defined as the region of the visual field from which burst responses to flashing or visual motion stimulation were elicited (as shown in E). The flash elicits a sequence of three bursts in both the Ipc and tectum lasting 100 ms. The filled arrow marks the time of the flash. Note that the first tectal burst begins ∼25 ms after a negative tectal potential (open arrow). B, A similarly tight correlation is observed in response to a bright spot crossing the superimposed RFs. D, STA of the OBs traces in response to stimulus motion as in B, using the Ipc multiunit spikes as triggers shows the close correlation between the two responses. The bottom curve (displaced vertically for clarity) is a control STA obtained by shuffling the recording traces. E, Multiunit activity in the Ipc in response to a 2° spot moved horizontally from temporal to nasal in six sweeps separated by 8° vertically, as shown in C. The bursting response is elicited in a central area of <25° (encircled); the more sustained high-frequency activity is elicited by stimulation beyond this region. Time expansion of marked section of traces (asterisks) shows that the peripheral high-frequency response is composed of very regularly spaced negative spike-like activity. F, Intracellular recording of an Ipc neuron in response to the same stimulation shown in C. The RF diameter was ∼22°. Notice that the cell fires in bursts riding on fast depolarizations. The biocytin-filled cell body was located in the posterior third of the Ipc.
Local inactivation of the Ipc eliminates OBs at the corresponding tectal locus
When lidocaine (10-25 nl of 2% lidocaine) was injected into the Ipc using one barrel of a double-barreled glass pipette, the other barrel fitted with a tungsten microelectrode, both the Ipc response and the tectal OB at the homotopic locus (located by moving a second tungsten microelectrode) disappeared completely in all cases tested (10 injections in four penetrations in four pigeons) (Fig. 6). Tectal OBs recorded simultaneously using a third microelectrode either 0.7 or 1.5 mm from the homotopic locus (eight injections in three penetrations in three pigeons) were not diminished. The OBs in the homotopic and the distant loci recovered to their original level within 3 min (10 nl of lidocaine) to 10 min (20-25 nl of lidocaine).

Injection of lidocaine in the Ipc eliminates OBs in the homotopic locus of the tectum. A, OBs were recorded from two sites in the optic tectum, one homotopic to the recording site in the Ipc (superimposed RF), the other 1.5 mm away (nonsuperimposed RF). Each trace represents the response to one sweep of the stimulus (2° bright dot, moved at 45 °/s in the horizontal axis). Lidocaine was injected using a double-barreled glass pipette as described in Materials and Methods. Three minutes after injecting lidocaine in the Ipc, the tectal OB response of the homotopic locus disappeared completely, whereas OBs recorded in the nonsuperimposed RF increased moderately. Both responses recovered in 6-10 min. B, Average number of bursts per second before and after lidocaine Ipc inactivation for different injection experiments. Bursts were counted and averaged during a fixed period of time for three sweeps of the stimulus across superimposed and nonsuperimposed RFs. Lines with the same symbol represent repetitions of the injections in the same pigeon (4 pigeons). C, Simultaneous recording of Ipc activity in the injected locus and tectal activity in the homotopic locus before and after lidocaine inactivation (same stimulation as in A). Note that all Ipc activity in the bursting part of the RF disappeared after the inactivation. Peripheral visual stimulation still evokes a strong high-frequency response in the Ipc site but with reverse polarity. The bottom traces are Ipc records expanded in time.
Remarkably, although the bursting responses disappeared completely from the inactivated Ipc loci, the high-frequency activity usually remained, but with inverted polarity (Fig. 6C). In this condition, with no activity in the central RF, it was particularly evident that the high-frequency activity recorded in the inactivated loci was exclusively elicited by stimulation of the RF surround.
Discussion
These experiments demonstrate that tectal OBs, the most conspicuous visual response recorded in the superficial and intermediate layers of the tectum, are generated by the bursting firing of paintbrush terminals from the Ipc and not by the concerted firing of most neurons within a tectal column. Thus, given the precise reciprocal projection between the Ipc and tectum, tectal OBs in fact represent re-entrant signals from the Ipc, and the spatial-temporal pattern of OBs across the tectum is the mirror representation of the spatial-temporal pattern of bursting neurons in the Ipc.
The origin of the oscillatory burst responses in the tectum
We have shown that the activity of most units in the optic tectum is not synchronized to the local OBs (Fig. 2), and therefore OBs would not result from the alignment in time of spikes produced by widespread neuronal activity within a tectal column.
Instead, we recorded from two types of units that did have the same response characteristics and receptive field size as the tectal OBs: bursting units in the optic tectum and Ipc units. Filling five bursting units in the intermediate and deep tectal layers resulted in the labeling of axons with the paintbrush-like arborization typical of Ipc neurons, and, in two cases, the corresponding somas were located inside the Ipc (Fig. 4). It is likely that all of the labeled paintbrushes came from the Ipc, because there is no other known source of paintbrush terminals to the tectum (Y. Wang and H. J. Karten, personal communication). The neurons recorded in Ipc fired with repetitive bursts tightly synchronized to the tectal OBs, confirming that they were the source of the tectal bursting units correlated with OBs (Fig. 5). Local inactivation of the Ipc with lidocaine completely eliminated the OBs recorded in the tectal locus of the visual stimulus, whereas tectal OBs at more distant tectal loci were recorded at normal, or even larger, amplitude (Fig. 6).
Together, these results imply that local OBs represent the activity of one Ipc axon or of a few Ipc axons discharging in close synchrony with substantial overlap in their visual RFs. Then, tectal OBs would result from highly synchronized radial currents generated in the paintbrush terminals of Ipc neurons, as bursts of action potentials actively ascend and multiply through the dense ramifications of these terminal fields. The summed radial currents in the paintbrush terminals could produce high-amplitude, bursting local potentials that are highly coherent across tectal layers and yet might be variable from one burst to another.
We also recorded units in the superficial layers of the tectum that had small negative spikes correlated with the OBs. These may originate from thinner branches of the Ipc paintbrush axons, which are particularly dense at the level of layer 5, where most of these bursting units were recorded. Alternatively, they may be unidentified small neurons or active dendrites.
The bursts in Ipc neurons are themselves triggered by visual activation of shepherd's crook neurons and other bipolar neurons in layer 10 projecting to the Ipc (see below). If these, in turn, were reciprocally activated, directly or indirectly, by the paintbrush firing, a transient visual stimulation might be enhanced and prolonged into burst sequences in the Ipc and the tectum lasting 200 ms or more (Fig. 5A).
Isthmo-tectal system and spatial attention
Several authors have proposed that the isthmo-tectal system may be involved in spatial attention in reptiles (Sereno and Ulinski, 1987), birds (Wang and Frost, 1991; Wang et al., 1995), and amphibians (Wiggers, 1998; Winkowski and Gruberg, 2002). On the basis of the present results and the detailed isthmo-tectal anatomical connections described in the chick by Wang et al. (2004), we suggest new insights as to how this mechanism might operate.
Visual afferents project via shepherd's crook neurons to the Ipc and the accompanying Imc (Tömböl et al., 1995; Tömböl and Németh, 1998; Wang et al., 2004) (Fig. 7). Ipc neurons have paintbrush endings that make dense, presumably cholinergic (Sorenson et al., 1989; Bagnoli et al., 1992; Medina and Reiner, 1994; Hellmann et al., 2001; Wang et al., 2004), axonal connections across many tectal layers in the same location of the tectum from which their visual inputs come (Wang et al., 2004). In contrast, Imc neurons make presumably GABAergic (Veenman and Reiner, 1994; Tömböl and Németh, 1998; Hellmann et al., 2001; Wang et al., 2004), inhibitory (Tömböl and Németh, 1998) connections over most of the Ipc as well as most of the tectum (Fig. 7).

Diagram illustrating the synaptic relationships between the isthmi and the tectum (Wang et al., 2004). The Ipc is reciprocally connected to the tectum in a precise homotopic loop. Shepherd's crook neurons and other bipolar neurons from layer 10 project topographically to the Ipc via spatially restricted terminals, and Ipc neurons project back to the corresponding tectal loci via the columnar paintbrush axon terminals. The Imc receives a coarser topographic projection from similar neurons in layer 10 and projects back to the tectum and to the Ipc via widely ramifying terminal fields. The tectal terminals in both the Imc and Ipc are presumably glutamatergic and excitatory. Ipc paintbrush terminals are presumably cholinergic. Imc neurons are presumably GABAergic and make synaptic connections with inhibitory profiles on Ipc neurons. The present study proposes that a transient visual input from the retina produces a prolonged, bursting reciprocal activation of the tecto-Ipc loci, while inhibiting the rest of the Ipc and the tectum via the Imc wide-field projection (see Discussion). Black represents visually activated neural elements.
The precise reciprocal projection between the Ipc and tectum determines that the spatio-temporal pattern of OBs across the tectum be the mirror representation of the spatio-temporal pattern of bursting neurons in the Ipc. When an Ipc-tectal locus is activated, simultaneous visual activation of Imc neurons may suppress the rest of the Ipc activity through their widespread diffuse terminal fields. Imc terminal activity in the Ipc seems to correspond to the high-frequency responses recorded in the Ipc to peripheral visual stimulation (Fig. 5E). This activity is recorded even from regions in the Ipc inactivated by lidocaine. In this case, the high-frequency activity has inverted polarity, as expected from inactivated terminals becoming current sources for the still-active peripheral branches (Fig. 6C). Imc neurons appear to have axonal terminals projecting throughout the Ipc except for a hole in their axonal field, corresponding to the locus of their visual inputs (Wang et al., 2004). Probably for this reason, the high-frequency Ipc spikes associated with Imc neurons occur over broad areas of the visual field, but not at the locations that give strongly bursting Ipc responses (Figs. 5E, 6C).
Thus, the three-nuclei circuitry just described may constitute a winner-take-all network (Koch and Ullman, 1985) in which local visual inputs to the Ipc are augmented by the re-entrant loop among tectal and Ipc neurons, combined with broad inhibition of the rest of the Ipc by Imc neurons (Fig. 7). If stimuli were to simultaneously activate several loci in the superficial layers of the tectum, the interactions among the activated loci in the Ipc and Imc would lead to the network rapidly converging to enhance responses to the most salient stimulus. Therefore, the ongoing spatio-temporal pattern of bursting neurons in the Ipc, and hence of OBs in the tectum, may at any time be reduced to a single locus of reciprocal Ipc-tectum activity moving in parallel in both tectal and Ipc maps. Alternatively, the interactions among these three nuclei may be flexible enough to allow more than one Ipc site to be active at the same time.
The inputs to the Ipc from the active tectal locus, shepherd's crook neurons and similar bipolar cells from the intermediate layers, might pool inputs from several tectal layers, representing different aspects of the visual stimulus or even different sensory modalities. The outputs from the Ipc, the paintbrush axons extending in columns across these different layers, may produce a simultaneous effect in all of them: a vertical unifying modulation. In this view, a bursting paintbrush, or a group of them that define the ongoing active Ipc location, can be figuratively seen as a beam of attention extending along a tectal column, corresponding to a given spatial locus. Although the direct postsynaptic targets of paintbrush terminals have not been identified, this functional column may include: retinal terminals, the major source of nicotinic receptors found in the superficial layers (Britto et al., 1994), shepherd's crook neurons and other bipolar projection neurons from layer 10, including those projecting to the Ipc, and single dendritic bottle-brush endings from tectal ganglion cells (Wang et al., 2004). Paintbrush terminals can also contact horizontal processes, as shown by Hunt et al. (1977), which may provide horizontal interactions among neighboring columns.
The mechanism by which the bursting paintbrushes might act as a modulator of tectal dynamics is via the release of acetylcholine (ACh). Evidence from several groups of vertebrates [teleosts (Schmidt, 1995), frogs (Titmus et al., 1999; Dudkin and Gruberg, 2003), and mammals (Binns and Salt, 2000; Lee et al., 2001)] indicates that stimulation of the Ipc or application of ACh in the superficial layers facilitates the release of glutamate from tectal retinal terminals. This, in turn, seems to lead to the activation of GABAergic circuits in the rat (Binns and Salt, 2000; Lee et al., 2001) and perhaps in the pigeon, as indicated by an increase in the strength of the inhibitory surround of tectal RFs (S. R. Wang et al., 1995; Y. Wang et al., 2000). It has been proposed that the increase in ACh-mediated GABAB currents in the rat superior colliculus (SC) may enhance bursting of projection neurons and hence signal amplification (Lee et al., 2001). Furthermore, acetylcholine increases the excitability of neurons in the deep layers of the superior colliculus, perhaps facilitating the interconnection between the superficial and deep layers, thereby leading to express saccades (Isa, 2002). We can conjecture that the simultaneous release of acetylcholine along a tectal column combines excitatory and inhibitory effects that might strengthen the responses of sensory neurons, increase their spatial resolution, or facilitate the transmission of signals from the superficial to the deeper layers, resulting in orienting responses.
A hint that paintbrush activity is more related to spatial attention than to the processing of specific sensory modalities can be seen in owls, in which tectal burst responses are elicited by both visual and auditory stimulation (Knudsen, 1982; DeBello and Knudsen, 2004). These burst responses are very similar to pigeon OBs and thus probably correspond to paintbrush firing. Bursting visual and auditory RFs in the owl are in close topographic alignment and owls readily orient their gaze to auditory as well as visual cues (Knudsen and Knudsen, 1989; Knudsen, 2002).
Comparison with mammals
In mammals, the nucleus parabigeminal (Pbg) is presumably homologous to the cholinergic subdivisions (the Ipc and the nucleus semilunaris) of avian isthmic complex (Diamond et al., 1992; Wang et al., 2004). A group of GABAergic neurons of the lateral tegmentum, just medial to the Pbg, may be homologous to the Imc (Sereno and Ulinski, 1987; Wang et al., 2004). The Pbg is reciprocally connected to the SC, providing most of the cholinergic input to the superficial layers (Mufson et al., 1986; Hall et al., 1989; Jeon et al., 1993). It receives an ipsilateral projection from bipolar neurons from the stratum griseum superficiale and projects bilaterally to the SC through retinotopic and nonretinotopic connections (Graybiel, 1978; Sherk, 1979b; Roldan et al., 1983; Baizer et al., 1991; Jiang et al., 1996). The bilateral retinotopic projection is in register and mainly targets the SC representation of the near central and peripheral visual field (Graybiel, 1978; Sherk, 1979b), a fact perhaps related to attending to novel stimuli. This anatomical evidence suggests that the Pbg has a heterogeneous cellular composition, which is also supported by the presence of different Pbg subdivisions in the rat (Tokunaga and Otani, 1978), larger neuronal size of neurons projecting to the contralateral SC (Sherk, 1979b; Baizer et al., 1991; Jiang et al., 1996), and prominent Pbg projections to the thalamus (Fitzpatrick et al., 1988; Harting et al., 1991). Also, two types of Pbg terminal profiles have been distinguished in the SC (Jeon et al., 1993). Because brush-like spatially restricted terminals seem to be a conserved characteristic of Ipc neurons in vertebrates (Sereno and Ulinski, 1987; Wiggers, 1998), Pbg neurons that may display this terminal morphology need to be identified for a full comparison among vertebrate groups.
In anesthetized cats, Pbg neurons have brisker visual responses than SC neurons, although burst-like activity has not been reported (Sherk, 1979a). However, in awake cats, behaviorally irrelevant stimuli producing brisk responses in the superficial layers of the SC do not stimulate Pbg neurons, which are selectively modulated by stimuli attended to and potential saccade targets (Cui and Malpeli, 2003). Thus, whereas parallel visual stimuli simultaneously activate several loci in the superficial layers of the SC, the Pbg re-entrant input to the SC seems to be specifically related to the ongoing focus of attention, perhaps through a winner-take-all mechanism analogous to the one proposed in this study.
Footnotes
This work was supported by Fondecyt Grants 1030522 (J.M.) and 1030761 (J.C.L.). We thank Josh Wallman for fruitful discussions and substantial help in writing this manuscript. We also thank Diane Greenstein for editorial assistance.
Correspondence should be addressed to Gonzalo Marín, Departamento de Biología, Facultad de Ciencias, Universidad de Chile, Las Palmeras 3425, Ñuñoa, Santiago, Casilla 653, Chile. E-mail: gmarin{at}uchile.cl.
Copyright © 2005 Society for Neuroscience 0270-6474/05/257081-09$15.00/0


