

Abstract
Understanding the relationship between synaptic plasticity and neuronal output is essential if we are to understand how plasticity is encoded in neural circuits. In the cerebellar cortex, motor learning is thought to be implemented by long-term depression (LTD) of excitatory parallel fiber (PF) to Purkinje cell synapses triggered by climbing fiber (CF) input. However, theories of motor learning generally neglect the contribution of plasticity of inhibitory inputs to Purkinje cells. Here we describe how CF-induced plasticity of both excitatory and inhibitory inputs is reflected in Purkinje cell spike output. We show that coactivation of the CF with PF input and interneuron input leads not only to LTD of PF synapses but also to comparable, “balanced” LTD of evoked inhibitory inputs. These two forms of plasticity have opposite effects on the spike output of Purkinje cells, with the number and timing of spikes sensitively reflecting the degree of plasticity. We used dynamic clamp to evaluate plasticity-induced changes in spike responses to sequences of excitation and feedforward inhibition of varied relative and absolute amplitude. Balanced LTD of both excitatory and inhibitory components decreased the net spike output of Purkinje cells only for inputs with small inhibitory components, whereas for inputs with a larger proportion of feedforward inhibition CF-triggered LTD resulted in an increase in the net spike output. Thus, the net effect of CF-triggered plasticity on Purkinje cell output depends on the balance of excitation and feedforward inhibition and can paradoxically increase cerebellar output, contrary to current theories of cerebellar motor learning.
Introduction
Synaptic plasticity is commonly assumed to be the cellular substrate for learning and memory in the mammalian brain (Bliss and Lømo, 1973; Ito, 1989; Bliss and Collingridge, 1993; Martin et al., 2000). Changes in strength at a synaptic connection must ultimately also change the ability of that synapse to influence postsynaptic spike output for synaptic plasticity to be read out and transmitted further in the network. However, the relationship between synaptic strength and its effect on spike output has only rarely been investigated and has proven difficult to quantify and to understand on a biophysical and computational level (Bliss and Lømo, 1973; Fetz and Gustafsson, 1983; Reyes and Fetz, 1993; London et al., 2002). In particular, although synaptic plasticity experiments are typically performed on a small subset of synapses in isolation, changes in the strength of synapses in the intact brain occur in the context of continuous patterns of synaptic activity (Destexhe et al., 2003). Thus, the impact of plasticity at a given set of synapses on postsynaptic spiking depends in part on correlations between activity at those synapses and other active synapses. Given our incomplete understanding of synaptic integration in central neurons and uncertainty about the physiological patterns of synaptic activity, predicting the impact of plasticity on postsynaptic spiking remains difficult.
In the cerebellar cortex, Purkinje cells form the sole output, and thus their spike trains must integrate and express the outcome of plasticity at synapses in the cerebellar cortical network for plasticity to be transmitted to downstream neurons. Early theoretical work proposed that the climbing fiber (CF) input acts as a “teaching signal” for plasticity at parallel fiber (PF) inputs to Purkinje cells (Marr, 1969; Albus, 1971), acting as the substrate for motor learning. Indeed, coactivation with the CF has been shown to induce long-term depression (LTD) of PF inputs (Ito and Kano, 1982; Ito et al., 1982; Ekerot and Kano, 1985; Sakurai, 1987; Hartell, 1996; Wang et al., 2000; Lev-Ram et al., 2003; Coesmans et al., 2004). CF activity has also been shown to trigger plasticity at inhibitory synapses onto Purkinje cells, expressed as long-term potentiation of spontaneous IPSCs (Kano et al., 1992, 1996). Purkinje cells are ideally suited to read out the strength of inhibitory synapses even in the absence of excitation, because they are spontaneously active (Häusser and Clark, 1997; Raman and Bean, 1997, 1999) and because inhibitory inputs have a powerful influence on Purkinje cell spiking (Midtgaard, 1992; Häusser and Clark, 1997). Moreover, PFs activate a feedforward inhibitory microcircuit, generating a precise, stereotyped excitatory–inhibitory temporal sequence (Eccles et al., 1966; Brunel et al., 2004; Mittmann et al., 2005), such that the strength of synaptic inhibition can control the timing and number of spikes activated by PFs (Mittmann et al., 2005). Thus, the efficacy of parallel fiber input depends on the “context” of inhibition provided by the feedforward inhibitory microcircuit. We therefore investigated how CF-triggered plasticity at inhibitory and excitatory synapses is integrated to regulate the spiking output of Purkinje cells.
Materials and Methods
We recorded from visually identified Purkinje cells in 200- to 300-μm-thick sagittal slices of the cerebellar vermis using standard techniques (Stuart and Häusser, 1994; Häusser and Clark, 1997). Slices were prepared from 18- to 24-d-old Sprague Dawley rats anesthetized via isoflurane inhalation in accordance with institutional and national regulations. Slices were cut in the sagittal plane using a Leica VT1000 S vibratome (Leica, Nussloch, Germany) and were continuously perfused with artificial CSF (ACSF) containing the following (in mm): 125 NaCl, 26 NaHCO3, 25 glucose, 2.5 KCl, 1.25 NaH2PO4, 2 CaCl2, and 1 MgCl2 (bubbled with 95% O2/5% CO2). Slices were viewed with infrared differential interference contrast optics on an upright microscope (Axioskop; Zeiss, Oberkochen, Germany). All experiments were performed at 35 ± 1°C.
Electrophysiological recordings.
Electrophysiological recordings from Purkinje cells were made using a Multiclamp 700A amplifier (Molecular Devices, Palo Alto, CA). We performed whole-cell current-clamp recordings with pipettes of 2–4 MΩ resistance filled with solution containing the following (in mm): 130 methanesulfonic acid, 10 HEPES, 7 KCl, 2 Na2ATP, 2 MgATP, 0.4 Na2GTP, 0.05 EGTA, and biocytin (0.4%) adjusted to pH 7.3 with KOH. Liquid junction potential was not accounted for. PFs were stimulated with ACSF-containing patch pipettes buried in the molecular layer underneath the recorded Purkinje cell. For stimulation of interneuron axons, the stimulating pipette was located 80–120 μm lateral to the Purkinje cell soma (or outermost part of the dendritic tree if visible), in either the outer or inner third of the molecular layer. Using our internal solution, the reversal potential of IPSPs was −88 ± 1.9 mV (n = 4), comparable with perforated patch measurements (Chavas and Marty, 2003). For plasticity experiments, we searched for the CF input after seal formation using a second stimulating electrode in the granule cell layer. After CF identification, we established the whole-cell configuration and obtained IPSPs or PF EPSPs by adjusting stimulation strength and location. During baseline and postpairing periods, PSPs were activated at 0.2 Hz, and sweeps with spontaneous spiking (without holding current) were interleaved with sweeps in which the neuron was hyperpolarized to −65 mV to measure PSP amplitude. GABAA receptors were blocked with SR95531 [2-(3-carboxypropyl)-3-amino-6-(4-methoxyphenyl)pyridazinium bromide; 10 μm] in the bath solution for PF LTD and dynamic-clamp experiments. Data were low-pass filtered at 4–10 kHz and sampled at 20 kHz using a 1321A Digidata analog-to-digital converter (Molecular Devices) and pClamp software (Molecular Devices).
Dynamic clamp.
Dynamic clamp (Robinson and Kawai, 1993; Sharp et al., 1993) was performed using custom-built analog circuitry. To avoid series resistance errors, simultaneous dual somatic whole-cell recordings were performed, with one electrode used to inject current and the other used to monitor voltage. PF excitatory inputs were simulated using current injection, because distal excitatory synapses are electrically remote and thus essentially protected from fast somatic voltage changes (Roth and Häusser, 2001). EPSCs were mimicked using currents with a double-exponential time course with τrise of 0.8 ms and τdecay of 5 ms. Inhibitory inputs were simulated using dynamic clamp because the majority of inhibitory synapses are located perisomatically and therefore are strongly influenced by the somatic voltage. Synaptic inhibition was mimicked using a conductance reversing at −88 mV with τrise of 1 ms and τdecay of 8 ms. The time course of excitatory and inhibitory inputs was based on measurements of feedforward EPSCs and IPSCs separated pharmacologically (Mittmann et al., 2005) in postnatal day 14 Purkinje cells in voltage clamp (our unpublished data). The delay between excitation and inhibition was 1.4 ms, consistent with experimental measurements of feedforward inhibition in Purkinje cells (Mittmann et al., 2005). To compare with evoked PSPs and to normalize for different electrical properties across cells, we adjusted the EPSC and inhibitory postsynaptic conductance (IPSG) to produce a PSP of the desired amplitude at −65 mV. We used inhibitory and excitatory synaptic input (I/E) ratios of 0, 0.25, 0.5, 1, 1.5, and 2 while keeping the EPSP constant at 3 mV, or we changed amplitudes from 1, 3, 5 to 10 mV with both PSPs of the same amplitude. To investigate the effect of CF-triggered plasticity, EPSC and IPSG amplitudes were alternated from sweep to sweep between control amplitudes and 20% depression.
Analysis.
Data was analyzed using custom software written for Igor Pro (WaveMetrics, Lake Oswego, OR). To quantify the change in spike output in response to synaptic input, poststimulus time histograms (PSTHs) were computed and integrated (Fetz and Gustafsson, 1983; Mittmann et al., 2005). A linear fit to the baseline of the integral (>100 ms) was extrapolated over the entire sweep duration and subtracted from the integral to yield the “corrected cumulative spike count.” Averaging over a 100–200 ms period after stimulation gives the number of spikes evoked (or prevented) by the input, termed the “net spike output.” For IPSPs, the net spike output is negative.
Spike shifts were used to determine the effect of an input on the timing of the first spike after the input. Spike shifts were calculated by dividing the average time from stimulus to the first spike with half the interspike interval (ISI) of baseline spiking (half the interspike interval is the average time between a random point in time and the next spike). Because EPSPs advance spontaneous spikes, the spike shift for EPSPs is a positive number less than one. Conversely, IPSPs delay spontaneous spikes, resulting in spike shifts greater than one. The SD of the first spike latencies was used as a measure for the temporal jitter. Spike precision was defined as the reciprocal of the temporal jitter. For plasticity experiments, PSP amplitudes, net spike output, first spike shifts, and spike precision were compared between baseline (10 min) and a 10 min period at least 15 min after the conditioning protocol. To facilitate the comparison between EPSPs and IPSPs in Figure 2 E–G, IPSP amplitudes were corrected for the difference in driving force between −65 mV and the average membrane potential during spontaneous spiking. Line fits in Figure 2, E, and F, were restricted to go through the origin for the net spike output and to assume the value 1 for a 0 mV PSP for the spike shift. The fit range was restricted to −2 to 0 mV for IPSPs and 0 to 4 mV for EPSPs.
For dynamic-clamp experiments, spike rasters were sorted by the timing of the last spike before onset of the injected synaptic waveforms. To facilitate comparison of the effect of control and LTD inputs on spiking, the sorted rasters were binned. Therefore, sorted spike rasters from baseline and LTD inputs contain equal numbers of sweeps with spikes in each millisecond before the input. PSTHs, the resulting corrected cumulative spike count, the net spike output, and the first spike shifts were computed from the binned spike rasters. Pooled data are expressed as mean ± SEM, and statistical significance was determined using Student's paired t test (unless otherwise indicated).
Results
The input–output function of Purkinje cells in response to synaptic stimulation
Purkinje cells spike spontaneously in the absence of synaptic input (Häusser and Clark, 1997; Raman and Bean, 1997; Smith and Otis, 2003) and maintain high firing rates in vivo (Granit and Phillips, 1956; Eccles et al., 1967; Thach, 1968; Bell and Grimm, 1969; Armstrong and Rawson, 1979; Nitz and Tononi, 2002). We first examined how single EPSPs and IPSPs in isolation interact with spontaneous spiking in Purkinje cells in cerebellar slices. PF EPSPs were isolated by blocking inhibition with SR95531 (10 μm) (Fig. 1 A,C) (Mittmann et al., 2005). IPSPs could not be separated from PF EPSPs pharmacologically because this would have also blocked the CF response (Konnerth et al., 1990; Perkel et al., 1990), which was used to induce plasticity (see below). However, in parasagittal slices, it was possible to selectively activate inhibitory inputs without activating PF inputs by directly stimulating interneuron axons outside the area of the Purkinje cell dendritic tree (Fig. 1 B,D). In these experiments, no excitatory components could be detected by visual inspection, and blocking inhibition with SR95531 after the experiment did not reveal any (n = 10 of 10 cells). Inhibition was activated directly, rather than by PF excitation of interneurons, because IPSP amplitude remained unchanged after bath application of NBQX (2,3-dihydroxy-6-nitro-7-sulfonyl-benzo[f]quinoxaline; 6 μm; n = 3; p > 0.4).

Effect of EPSPs and IPSPs on Purkinje cell spike output. A , B , Schematic illustration of the cerebellar microcircuit, showing stimulation and recording electrodes. When evoking EPSPs ( A ), inhibition is blocked with bath-applied SR95531. C , An EPSP triggered by parallel fiber stimulation in a whole-cell recording from a cerebellar Purkinje cell (average of 69 sweeps). D , An IPSP evoked by stimulation in the molecular layer (∼100 μm lateral to the Purkinje cell soma) recorded in another Purkinje cell (average of 192 sweeps). In the top traces, the Purkinje cell was hyperpolarized by current injection to −65 mV to suppress spontaneous spiking, and the bottom traces represent 10 superimposed trials in which the same input was stimulated during spontaneous spiking (i.e., without holding current). E , F , Top, The PSTH calculated from the spiking responses shown in A and B . Middle, The corresponding integrated PSTH with a line (red) fit to the baseline and extrapolated over the entire sweep. The subtraction of the extrapolated line from the integrated PSTH yields the cumulative spike probability (bottom) corrected for spontaneous spiking. G , H , Histogram of the first spikes after the stimulation. The EPSP leads to a very narrow distribution of spikes rapidly after the input ( G ), whereas the first spikes after the IPSP ( H ) exhibit a wide range of long latencies. The small initial peak in H represents occasional spontaneous spikes occurring between the stimulus and the onset of the IPSP. The dashed red line indicates the mean ISI. The x-axis scale in G and H is valid for C–H .
Figure 1 demonstrates how we quantified the impact of excitatory and inhibitory inputs on Purkinje cell spike output. The amplitude of EPSPs and IPSPs was assessed at −65 mV, when spontaneous spiking was silenced using hyperpolarizing holding current (Fig. 1 C,D, top). We focused on relatively small single inputs, typically <5 mV for EPSPs [corresponding to <80 individual PF inputs (Isope and Barbour, 2002)] and <2 mV for IPSPs [corresponding to < 10 individual stellate/basket cell inputs (Häusser and Clark, 1997)], because these are likely to be within the physiological range judging by the similar range of subthreshold and spiking responses observed with sensory stimulation in vivo (Bower and Woolston, 1983; Ebner et al., 1983; Jaeger and Bower, 1994; Holtzman et al., 2006). To assess the effect of EPSPs and IPSPs on spike output, inputs were evoked during spontaneous firing in the absence of holding current. EPSPs triggered additional spikes immediately after the onset of stimulation or advanced spontaneously occurring spikes (Fig. 1 C, bottom). In contrast, IPSPs led to a brief cessation of spiking or delayed the occurrence of spontaneous spikes (Fig. 1 D, bottom). Because there is no clear distinction between spontaneous, evoked, and omitted spikes, we developed an index to assess the overall impact of a synaptic input on spike output. We integrated a PSTH of the spike responses, giving the cumulative spike probability (Fig. 1 E,F, middle) (Fetz and Gustafsson, 1983). We fitted a line to the baseline region of the cumulative spike probability and subtracted this line from the trace. The resulting corrected cumulative spike probability (Fig. 1 E,F, bottom) provides the net number of additional (or subtracted) spikes attributable to the input. The oscillations apparent after the input (see also Figs. 2 C, 5 B, 6 D) are a consequence of the regular spontaneous spiking of Purkinje cells. Strong excitatory synaptic input triggers spikes that reset the pacemaker rhythm, thus time locking subsequent spikes to the stimulus, represented as oscillations in PSTHs and the corrected cumulative spike probabilities. Similarly, strong inhibitory input can also reset pacemaking by causing a consistent delay to the next spike, which also time locks subsequent spikes and causes oscillations in both the PSTH and corrected cumulative spike probabilities (see Fig. 5 F).
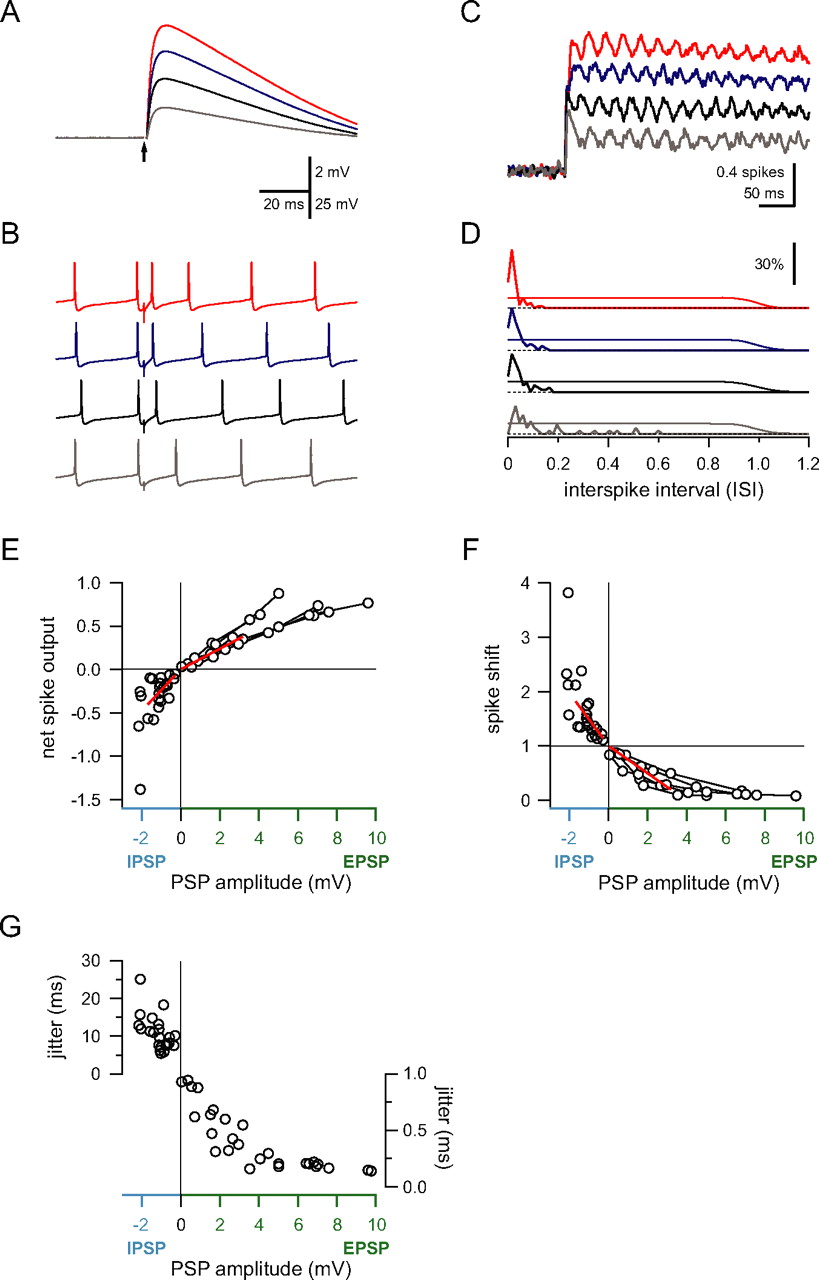
Relationship between synaptic input and spike output. A , EPSPs evoked by different intensities of parallel fiber stimulation recorded in a Purkinje cell held at −65 mV (averages of 50–80 sweeps). B , In the same cell, the effect of parallel fiber input on the timing of spontaneous spikes depends on the size of the input (trace colors correspond to the same stimulus intensities used in A ). C , The corrected cumulative spike output depends on the size of the EPSP. Same cell and color scheme as in A . D , Histogram of the first spike latency normalized by the interspike interval (see Results). The thin line shows the baseline probability of a spontaneous spike (which transitions to 0 at the mean ISI). Note that, as the EPSP amplitude increases, the precision of the first spike increases, whereas its latency decreases. E , Net spike output in response to EPSPs and IPSPs for several experiments. IPSP amplitudes in this and subsequent panels are corrected for driving force differences between −65 mV and the average membrane potential during spontaneous spiking. Connected data points are from the same cell. Note the different slopes of the fits (red lines) for EPSPs and IPSPs. F , Spike shift for the same data shown in E . Note the difference in the slopes of the fits (red lines). G , EPSPs of increasing size led to a decrease in temporal jitter of the first spike. The timing of spikes after IPSPs was more variable, and variability increased with increasing IPSP amplitude.
In addition to assessing the change in net spike output generated by an input, we also quantified the effect of EPSPs and IPSPs on spike timing. Figure 1, G, and H, shows a histogram of the latencies of the first spikes after the input. The first spikes after activation of the EPSP occurred much faster than expected from spontaneous spiking, whereas the IPSP typically delayed the timing of the first spike. The difference in timing of the first spike after the input and the mean ISI during spontaneous firing provides an index of the effect of an input on spike timing, which we term the “spike shift” (expressed as the ratio between the mean latency of the first spikes and the mean latency of the spontaneous spikes; see Materials and Methods). Finally, the effect of the input on the trial-to-trial jitter in the timing of individual spikes was quantified as the SD of the latency of the first spike after the input.
We used these three measures to determine the input–output function of Purkinje cells in response to single excitatory and inhibitory inputs of different sizes. An example of such an experiment is shown in Figure 2. As EPSP size increased (with increasing stimulation intensity) (Fig. 2 A,B), the net spike output correspondingly increased (Fig. 2 C). In parallel, the timing of spikes evoked by the input became more precise and locked to the stimulus (Fig. 2 D). For a random point in time, the next spontaneous spike occurred with even probability somewhere within an ISI (thin traces). Strong inputs forced the next spike to occur with short latency after the stimulus, such that all spikes after the stimulus occurred during the rising phase and peak of the EPSP, a much smaller timeframe compared with the interspike interval for spontaneous spiking. In contrast, weaker inputs (Fig. 2 B,D, gray trace) did not always trigger spikes but instead would accelerate the occurrence of the next spontaneous spike (Fig. 2 D).
The effect of input size on the three spike measures for EPSPs and IPSPs is shown in Figure 2 E–G. The net spike output was approximately linearly related to the size of the underlying EPSPs and IPSPs (Fig. 2 E). For the input sizes used here, EPSPs and IPSPs typically added or subtracted up to one spike depending on the size of the input. This is surprising because strong EPSPs led to completely reliable rapid triggering of a spike. Because inputs were stimulated at random times in the spike cycle, this next spike would have occurred on average after half the interspike interval. This means that, on average, an input can only accelerate the next spike by half the interspike interval, producing a maximum net increase of +0.5 spikes. However, this limit can be exceeded for two reasons. First, a single input could directly activate bursts of spikes. This was not the case in these experiments because the range of EPSP sizes used was below the threshold for triggering bursts, which may engage different mechanisms (Steuber et al., 2007). Alternatively, because of the incomplete shunting of excitatory synaptic charge in cerebellar Purkinje cells (Häusser et al., 2001), the residual EPSP after a spike can accelerate the timing of the subsequent spike (Fig. 2 B, top trace), leading to the observed net spike outputs higher than 0.5. Conversely, the largest IPSPs could lead to prolonged cessation of firing, causing large negative net spike outputs.
The spike shift was also linearly related to input amplitude for small inputs and saturated for EPSPs larger than 6 mV. Such a rapidly saturating function is expected because, if an EPSP reliably triggers a spike during its rising phase, an additional increase in EPSP amplitude will not lead to much shorter latencies. Although the initial relationship between IPSP size and spike shift was linear (Fig. 2 F), with larger IPSPs the effect on spiking became nonlinear, with long increases in spike latency and large negative net spike outputs being observed in some cases. To compare the effect of IPSPs and EPSPs on these spike measures, we fitted a line to the initial region of both spike measures for EPSPs and IPSPs (Fig. 2 E,F) (see Materials and Methods). The ratio of the slopes of the line fits for IPSPs and EPSPs was 202% for the net spike output and 192% for the spike shift.
Finally, we examined the effect of input size on spike jitter (Fig. 2 G). Increasing EPSP size led to an increasing probability of spikes being evoked during the rise and peak of the EPSP, which decreased the temporal jitter of spikes triggered by the stimulation. Like the spike shift, the reduction in jitter saturated for large EPSPs. Spikes after IPSPs showed more variability in their timing, as expected. Interestingly, the jitter increased with increasing IPSP amplitude.
Climbing fiber-induced LTD of excitation and inhibition
We next measured how synaptic plasticity at excitatory and inhibitory synapses translates into changes in Purkinje cell spiking. The Purkinje cell is a particularly favorable cell type for investigating this issue because (unlike in pyramidal neurons) assaying the effect of synaptic input on the spike response does not itself change synaptic efficacy and because plasticity can be triggered by a single synaptic input without affecting other cells in the network. Plasticity was triggered by pairing evoked EPSPs or IPSPs with CF input. The effect of the pairing protocol on synaptic strength and on the spike response was assessed in parallel in the same cells by interleaving hyperpolarized trials to measure input amplitude with trials in which the input occurred during spontaneous spiking.
To trigger plasticity at PF synapses, after collection of a stable baseline (>10 min), the CF was coactivated with the PF input (1 ms delay, PF before CF) for 300 times at 1 Hz. This pairing protocol led to robust LTD of the PF EPSP (67 ± 4% of baseline; p < 0.01; n = 7) (Fig. 3 A,B) (Ito and Kano, 1982; Ekerot and Kano, 1985; Sakurai, 1987; Hartell, 1996; Wang et al., 2000; Coesmans et al., 2004). When only 100 pairings were performed, a similar degree of LTD was observed (71 ± 11% of baseline; n = 3). If the pairing protocol was omitted, no depression was observed (103 ± 8%; p > 0.4; n = 7) (Fig. 3 A,C), consistent with previous results showing that spontaneous sodium action potentials in Purkinje cells do not affect PF efficacy (Wang et al., 2000). Comparing the change in synaptic strength for paired and unpaired EPSPs 30 min after pairing confirmed that the LTD was significant (p < 0.01, unpaired t test).

Parallel fiber LTD triggered by coincident climbing fiber input. A , Pairing PF EPSPs with CF input triggers LTD of the PF EPSPs. Filled circles show normalized EPSP amplitudes for seven cells. Open circles show controls (7 cells) in which omission of CF activation (i.e., raised PF stimulation frequency alone) did not lead to LTD. Insets show an example EPSP before and after pairing and the response to CF stimulation. The undershoot after the EPSP in this and other figures is attributable to deactivation of I h (Roth and Häusser, 2001; Williams et al., 2002). B , EPSP amplitude before and after CF pairing shown for individual cells. C , Same as B for the control experiments.
Next, we examined whether pairing CF activation with inhibitory input to the Purkinje cell could lead to long-term changes in synaptic strength at the inhibitory synapses. After obtaining a stable IPSP baseline (>10 min), the CF was coactivated with the IPSP using the same induction protocol as for EPSPs (see above). This led to long-lasting depression of IPSPs in all cells (75 ± 5%; p < 0.01; n = 13) (Fig. 4 A,B). When only 100 pairings were performed, a similar degree of LTD was observed (76 ± 14% of baseline; n = 6). To control for nonspecific effects such as IPSP rundown, we omitted the pairing protocol, which led to no change in IPSP amplitude (112 ± 8%; p > 0.2; n = 10) (Fig. 4 A,C). We compared the change in synaptic strength for paired and unpaired IPSPs 30 min after pairing to confirm that the LTD was significant (p < 0.01, unpaired t test).

LTD of inhibitory input triggered by coincident climbing fiber input. A , Evoked IPSPs underwent LTD when paired with CF stimulation. Filled circles show normalized IPSP amplitudes for 13 cells. Open circles show controls (10 cells) without pairing. Insets show an example of an IPSP before and after pairing and stimulation of the IPSP followed by activation of the CF. The overshoot after the IPSP in this and other figures is attributable to activation of I h (Roth and Häusser, 2001; Williams et al., 2002). B , IPSP amplitude before and after CF pairing shown for individual cells. C , Same as B for the control experiments.
To compare plasticity at basket cell and stellate cell inputs to Purkinje cells, we investigated plasticity of IPSPs evoked by stimulating in either the proximal or distal third of the molecular layer, respectively (Palay and Chan-Palay, 1974; Sultan and Bower, 1998). As expected, somatic IPSPs produced by activation of the two input pathways had different 20–80% rise times (proximal, 2.0 ± 0.2 ms, n = 11; distal, 3.3 ± 0.2 ms, n = 11; p < 0.01, unpaired t test), although amplitudes were comparable (proximal IPSPs, −0.69 ± 0.08 mV; distal IPSPs, −0.73 ± 0.12 mV; p > 0.3, unpaired t test). Both input pathways experienced the same degree of LTD after pairing with CF input (proximal, 77.9 ± 7.2%; distal, 70.8 ± 7.1%; p > 0.2, unpaired t test).
In summary, pairing CF activation with either excitatory or inhibitory synaptic input to Purkinje cells using the same pairing protocol led to LTD of both types of input. The degree of LTD of excitation and inhibition was identical (p > 0.3, unpaired t test).
Climbing fiber-triggered plasticity is reflected in Purkinje cell output
We next examined the impact of plasticity at excitatory and inhibitory synapses triggered by conjunctive CF input on Purkinje cell spiking. Figure 5 A compares the effect of PF EPSPs on spiking parameters during the baseline period and after pairing or when pairing was omitted (control). If pairing was omitted, no changes in the spike response were observed (Fig. 5 A,B, left panels). However, after CF-induced LTD, PF EPSPs had a smaller effect on spike latency (Fig. 5 A, right) and net spike output (Fig. 5 B, right). The converse effects were found for plasticity of inhibitory synaptic inputs: CF-induced LTD of the IPSP was accompanied by a reduction in the effect of the IPSP on spike latency and net spike output (Fig. 5 E,F, right), whereas no changes were observed when pairing was omitted (Fig. 5 E,F, left).

Readout of synaptic plasticity by the Purkinje cell spike train. A , Baseline (blue) and conditioned (red) EPSP for a control experiment (left) and an LTD induction experiment (right). Bottom shows the corresponding spike data. The EPSP amplitude stays constant in controls resulting in unchanged spike timing, whereas LTD led to an increase in spike latency. Spikes are truncated for clarity. B , The corrected cumulative spike output stays constant in control and is reduced by LTD. C , Summary data for EPSPs. No significant differences for EPSP amplitude, net spike output, spike shift, and spike precision were observed in control experiments (p > 0.15; n = 7). CF pairing led to LTD of EPSP amplitude and decreased net spike output. The spike shift increased because the first spike latencies got longer for decreasing EPSP amplitudes. Changes were significant compared with baseline (*p < 0.05; **p < 0.01) and compared with control (unpaired t test). LTD also led to a reduction in spike precision. D , Change of the net spike output and spike shift versus the change in EPSP amplitude for plasticity and control experiments. Line fits (red) and statistical analysis reveal a strong correlation (for details, see Results). E , Baseline (blue) and conditioned (red) IPSP in a control experiment (left) and after LTD induction (right). Constant IPSP amplitude in control led to unchanged spike timing. LTD of the IPSPs resulted in decreased spike latencies. F , Although the corrected cumulative spike output did not change in control experiments, it increased toward zero after LTD induction. G , Summary data for IPSPs. After LTD, the normalized net spike output decreased because IPSPs led to negative net spike outputs, which increased toward zero through LTD of inhibition. The spike shift decreased because latencies decreased with smaller IPSPs. Spike precision was not significantly affected by LTD. H , As for EPSPs ( D ), plasticity of IPSPs is strongly correlated with changes in the spike response.
Overall, the reduction in PF EPSP amplitude during LTD was reflected in a significant reduction in net spike output (LTD, 70.6 ± 4.9%; p < 0.02), a corresponding increase in spike shift (LTD, 137.0 ± 10%; p < 0.01), and a reduction in spike precision (63.8 ± 5.6%; p < 0.02) (Fig. 5 C). In control experiments in which pairing was omitted, no changes in net spike output, spike shift, or spike precision were observed (115 ± 10%, p > 0.15; 96 ± 4.7%, p > 0.4; and 104 ± 6.1%, p > 0.4, respectively) (Fig. 5 C). Across the population, the effect of plasticity on spike measures was highly correlated with the degree of plasticity (r = 0.89, p < 0.01 and r = 0.71, p < 0.01 for net spike output and spike shift, respectively) (Fig. 5 D).
These changes in the spike response induced by LTD of excitatory inputs were mirrored by LTD in inhibitory inputs. The reduction in IPSP amplitude after pairing with the CF was associated with a reduction in the effect of the IPSP on net spike output (70.4 ± 6.8%; p < 0.01) and on spike shift (88.6 ± 2.6%; p < 0.01), whereas spike precision was not changed significantly (116.4 ± 7.0%; p > 0.02) (Fig. 5 G). Thus, LTD of the inhibitory inputs results in a relative increase in spiking in response to the same input. Again, IPSPs that did not undergo the pairing procedure were not associated with changes in spike output (109.5 ± 10.8%, p > 0.3; 102.3 ± 2.4%, p > 0.3; and 102.7 ± 3.7%, p > 0.3 for net spike output, spike shift, and precision, respectively) (Fig. 5 G). The effect of IPSP plasticity on spike measures was correlated with the degree of plasticity across cells (r = 0.55, p < 0.01 and r = 0.60, p < 0.01 for net spike output and spike shift, respectively) (Fig. 5 H). For both excitatory and inhibitory input, changes in spontaneous firing rate after conditioning were not correlated with changes in the spike response (EPSPs: r = 0.15, p > 0.3 and r = 0.09, p > 0.3 for net spike output and spike shift respectively; IPSPs: r = 0.06, p > 0.3 and r = 0.17, p > 0.3 for net spike output and spike shift, respectively) (data not shown). To more directly assay changes in excitability, we quantified the response to a constant IPSC-like current injection (τ rise, 1 ms; τdecay, 8 ms) both when hyperpolarizing the cell and during spontaneous spiking. After a baseline period of 10 min, we applied a conditioning protocol (100 times CF activation at 1 Hz). The amplitude of the IPSP resulting from current injection was unchanged after pairing (n = 4; p > 0.05). The spiking response to the current injection also did not show significant changes: neither spike shift (98 ± 4%; p > 0.2; n = 4) nor net spike output (95 ± 3%; p > 0.2; n = 4) changed significantly. Together, these findings suggest that changes in intrinsic voltage-gated conductances do not significantly contribute to our results.
These results provide the first quantification of the relationship between plasticity at identified synapses in Purkinje cells and their spike output and demonstrate that there is a tight link between the degree of synaptic plasticity and the output of the cerebellar cortex.
Changes in spike output induced by plasticity of feedforward inputs
We have shown that pairing the CF with excitatory or inhibitory inputs results in LTD of both inputs, producing opposite effects on the spike response. Thus, PF LTD led to decreased net spike output and increased spike latency, whereas LTD of inhibition led to an increase in net spike output and a decrease in latency. These parallel changes in synaptic efficacy of the two inputs would tend to cancel out the effect of each other on the spike response. To determine whether plasticity at inhibitory or excitatory synapses is more important for changes in spike output triggered by coactivation with CF input, it is necessary to know the relative strength of inhibitory and excitatory synaptic input (the I/E ratio) that is typical for physiological Purkinje cell inputs under in vivo conditions. Unfortunately, the I/E ratio for sensory-evoked responses in Purkinje cells in vivo remains unknown. We therefore simulated inhibitory and excitatory synaptic inputs with dynamic clamp and combined them at different ratios to examine their effect on spiking. Because PF activation is rapidly followed by feedforward inhibition in a precise temporal sequence (Eccles et al., 1967; Brunel et al., 2004; Mittmann et al., 2005), we activated synaptic inhibition with a fixed delay (1.4 ms) (Mittmann et al., 2005) after excitation. By using current and conductance injection, the level of excitation and inhibition could be precisely controlled, and data acquisition was not restricted by recovery from short-term and long-term synaptic plasticity, enabling collection of many different I/E ratios.
The effect of changing the ratio of excitation and inhibition on the Purkinje cell spike response is shown in Figure 6, A and B. As the relative level of feedforward inhibition was increased, the spiking response was converted from a simple increase in spiking triggered by the EPSP to one in which this initial increase was rapidly followed by a pause, the duration of which depended on the level of inhibition. Also, as the level of inhibition increased, the temporal precision of the initial increase in spiking triggered by the excitatory component increased (Mittmann et al., 2005).

Changes in Purkinje cell spike responses induced by balanced LTD of feedforward inputs. A , Excitatory inputs followed by feedforward inhibition were mimicked by current and conductance injection, respectively. Current injection was adjusted to yield a 3 mV EPSP, which was followed by the IPSP adjusted to different amplitudes. Subthreshold potentials (at −65 mV) of three inputs with different I/E ratios from the same cell are shown for baseline (blue) and LTD (red). Traces are averages of 10–25 sweeps. B , The corresponding spike rasters. The spike rate was adjusted to 40 Hz with direct current injection. C , The same rasters displayed on top of each other. The trials in the raster are ordered according to the time of the last baseline spike. Note the small middle region in which the baseline input but not the depressed input triggers a short latency spike. D , The corrected cumulative spike output. Note that the net spike output is zero for the smallest I/E ratio (left). For higher I/E ratios, LTD leads to an increase in the net spike output (middle and right).
Because Purkinje cells are spontaneously active, the effect of individual inputs depended on the timing of each input with respect to the time of the previous spontaneous spike. To clearly illustrate this dependence, we ordered individual trials by the time of the last spike before the stimulus (Fig. 6 C). In the uppermost trials, with the longest time since the previous spike, the EPSP is quite effective at rapidly triggering a spike because it arrives close to the end of the normal interspike interval, i.e., when the interspike voltage trajectory is closest to threshold. These spikes occur during the rise or peak of the EPSP, which effectively locks the spike to the stimulus. If, however, the EPSP occurs earlier in the interspike interval and does not directly trigger a spike, then the feedforward IPSP will delay the occurrence of the next spike. As the size of the inhibitory component increases, the effectiveness of the EPSP in triggering an additional spike decreases, and the duration of the pause to the next spike increases (both when the EPSP is effective in triggering an additional spike and also when it is not).
These changes in spike timing with increasing levels of feedforward inhibition are also reflected in the net spike output. Surprisingly, already for low levels of inhibition, net spike output could be close to zero (Fig. 6 D, left). As feedforward inhibition was further increased and delays to subsequent spikes after the stimulus also increased, the net spike output became negative (compare with Fig. 5 F). Interestingly, because the feedforward input tended to reset the spontaneous spiking rhythm, this was associated with an apparent increase in the rhythmic firing of the Purkinje cell after stimulation, an effect that increased as the size of the excitatory or inhibitory input increased (Fig. 6 D).
We next mimicked balanced CF-induced plasticity at excitatory and inhibitory synapses within a feedforward response by simultaneously reducing the size of the inhibitory and excitatory components by 20%. Although this represents a relatively small change in synaptic strength, for all ratios of excitation and inhibition, this balanced plasticity of feedforward inputs was reflected in the Purkinje cell spiking response. The change in spike output can be observed in the middle region of Figure 6C, in sweeps in which the baseline input triggers spikes (blue), whereas the depressed input fails to reach threshold (red). Conversely, LTD of the inhibitory component was reflected by a reduction in the duration of the pause in spiking after the input (Fig. 6 BC). Thus, LTD of the excitatory component was reflected in a reduction in the number of rapidly triggered spikes.
Consistent with the experiments using evoked EPSPs, pure excitatory inputs led to an increase in the net spike output, which was reduced by LTD (compare with Fig. 5 B). For intermediate ratios of excitation and inhibition, the net spike output was close to zero (Fig. 6 D, left). In this case, balanced LTD did not affect net spike output. For inputs with large inhibitory components, the net spike output was negative. The influence of climbing-fiber plasticity on the net spike output for such inputs was therefore dominated by LTD of the inhibitory component rather than LTD of the excitatory component and thus paradoxically increased spike output (Fig. 6 D, middle and right).
Figure 7 quantifies the effect of balanced plasticity on the Purkinje cell spike response over a wide range of I/E ratios. The number of rapidly triggered spikes decreased with increasing levels of feedforward inhibition. Balanced LTD further reduced the number of rapidly triggered spikes by ∼10% at all I/E ratios (Fig. 7 A). These rapidly triggered spikes were restricted to increasingly narrow time windows as inhibition was increased, thus increasing their precision. LTD did not lead to consistent changes in precision because the time window was already briefer than 0.5 ms for I/E ratios >0.5. However, LTD did lead to a significant decrease in precision for purely excitatory inputs (81.0 ± 6.9%; p < 0.05), consistent with the synaptic data (Fig. 5 C). The pause in spiking after the input increased with increasing inhibition. Whereas pure excitatory inputs led to a pause briefer than the interspike interval, increasing levels of inhibition prolonged the pause. Both the accelerating effect of pure EPSPs and the delaying effect of EPSPs followed by feedforward inhibition were reduced by balanced LTD (Fig. 7 B).

LTD of excitation and inhibition can be read out by different features of the spike train. A – F , Summary data from five cells with different I/E ratios ( A – C ) or different amplitudes with fixed I/E ratio of 1 ( D – F ). For all panels, statistically significant changes are indicated (*p < 0.05). Bottom shows the ratio of LTD and baseline. A , Increasing inhibition led to decreasing probability of rapidly triggered spikes. LTD at all I/E ratios led to an additional decrease. B , The pause after these rapidly triggered spikes (or the last baseline spike if none was triggered) reflected the size of the inhibitory component and increased with increasing inhibition. LTD of the compound input reduced the duration of the pause. Note that, if no inhibition was present, the pause is shorter than the ISI, consistent with the synaptic data. Dashed lines mark the value expected if the cell does not receive an input. C , The net spike output is positive for small I/E ratios, reversing at intermediate ratios, and is negative for large I/E ratios. Note that LTD leads to an increase in spike output for inputs with large I/E ratios. D , Increasing the amplitude does not lead to a saturation of the probability of rapidly triggered spikes because there is a significant reduction at all stimulation strengths. E , Similarly, the pause duration reflected LTD at all stimulation strength. F , The net spike output increased with LTD at all amplitudes.
The effect of balanced LTD on the net spike output varied depending on the I/E ratio. The net spike output was positive if no inhibition was present, and increasing the I/E ratio reduced the net spike output until it reached zero and ultimately became negative for I/E ratios >0.5 (Fig. 7 C). Consistent with the synaptic data (Fig. 5 B), the net spike output was reduced by LTD if no or small inhibitory components contributed to the input. For I/E ratios >0.5, balanced LTD led to an increase in the net spike output. This is in contrast with classical cerebellar learning theories. Interestingly, for some intermediate I/E ratios (0.25 and 0.5) that produced no change in net spike output, balanced plasticity did not affect net spike output. This indicates that plasticity may in some circumstances be silent in terms of net spike output, in cases when inhibition and excitation effectively “cancel each other out.”
The spiking responses of Purkinje cells to evoked synaptic input (Fig. 2) suggested that large inputs might saturate the spike readout, which would render Purkinje cells relatively insensitive to synaptic plasticity for large inputs. To test whether the spike readout of synaptic plasticity could saturate, we kept the I/E ratio constant at 1 and tested a range of input amplitudes. As expected, we found that the number of rapidly triggered spikes and the subsequent pause scaled with input amplitude (Fig. 7 D,E). However, even when the amplitude of the individual components was large (∼10 mV), plasticity was still reflected in the number of rapidly triggered spikes and the pause duration (Fig. 7 D,E). The net spike output was similarly resilient against saturation. At an I/E ratio of 1, the net spike output was negative, and increasingly large inputs led to the omission of more spikes. Balanced plasticity increased the net spike output at all amplitudes tested (Fig. 7 F). Thus, the mixture between excitation and feedforward inhibition results in spike responses being limited to the subsaturating range at which plasticity in synaptic input can be faithfully and sensitively read out in terms of neuronal output.
Discussion
Implicit in the widespread assumption that synaptic plasticity underlies learning and memory is the idea that changes in synaptic strength cause changes in spike output. We tested this assumption for excitatory and inhibitory synapses in Purkinje cells and revealed some surprising relationships between synaptic plasticity and spike output. We show that pairing PF or inhibitory inputs with CF stimulation leads to LTD of both inputs, thus maintaining a balance between excitation and inhibition. This plasticity is reflected in corresponding changes in spike output. However, when excitatory and inhibitory inputs are combined in a physiological feedforward sequence, CF-induced plasticity only leads to the expected reduction in net spike output when the inhibitory component is small. Thus, the outcome of plasticity at a given synapse depends critically on the context of synaptic activity in the neuron. These findings challenge prevailing theories of cerebellar function.
Sensitivity of spike output to excitatory and inhibitory synaptic input
To investigate the relationship between synaptic input and spike output, we quantified and compared the effect of synaptic inhibition and excitation on various spike parameters in spontaneously firing Purkinje cells. Our findings show that the number, timing, and jitter of spikes sensitively reflect the strength of both inhibitory and excitatory inputs. Remarkably, the readout was approximately linear for small inputs (cf. Walter and Khodakhah, 2006), corresponding to the activity of only a few presynaptic neurons. This high degree of sensitivity is related to the spontaneous firing of Purkinje neurons (Häusser and Clark, 1997; Raman and Bean, 1997). Because spontaneously firing neurons by definition are continually approaching spike threshold, synaptic inputs can easily modulate firing rates in either direction, and even relatively small inputs can synchronize spontaneous activity across a large fraction of the postsynaptic neurons as the spontaneous activity becomes locked to the stimulus across multiple spike cycles (Fig. 6).
Once normalized for driving force, inhibition was more effective at regulating spike parameters than excitation, consistent with previous experimental and theoretical work (Jaeger et al., 1997; Jaeger and Bower, 1999). This is particularly relevant in spontaneously firing cells, in which inhibition can be read out even in the absence of excitation.
Plasticity of inhibitory inputs triggered by climbing fiber input
Although long-term depression of parallel fiber input triggered by coactivation of the CF has been extensively investigated (Ito and Kano, 1982; Ito et al., 1982; Ekerot and Kano, 1985; Sakurai, 1987; Hartell, 1996; Wang et al., 2000; Lev-Ram et al., 2003; Coesmans et al., 2004), the possibility of plasticity in inhibitory inputs has received much less attention. We demonstrated that pairing with the CF leads to long-lasting depression of inhibitory inputs. The degree of depression (∼25%) was similar to that of the PF EPSP, suggesting that plasticity of excitation and inhibition might remain balanced after the CF is coactivated with a physiological excitation–feedforward inhibition sequence. Such balanced plasticity may have important implications for cerebellar function. It contrasts with cortical networks, in which short-term plasticity has been shown to disrupt the excitation–inhibition balance, leading to either a predominance of inhibition (Galarreta and Hestrin, 1998) or excitation (Mori et al., 2004). Maintaining a balance between excitation and inhibition is of critical importance for regulating patterns of spikes (Bell et al., 1995; van Vreeswijk and Sompolinsky, 1996; Higley and Contreras, 2006) and for stability and computation in neuronal networks (Brunel, 2000; Marino et al., 2005).
The depression of the inhibitory input we described contrasts with the previously described long-term rebound potentiation of spontaneous IPSC amplitude and frequency in Purkinje cells (Kano et al., 1992, 1996; Kawaguchi and Hirano, 2002; Duguid and Smart, 2004; Ohtsuki et al., 2004). However, rebound potentiation is typically triggered by strong postsynaptic depolarization or activation of the CF alone when using a cesium-based internal solution, which causes massive and widespread dendritic calcium entry (Kano et al., 1992; Kawaguchi and Hirano, 2000), whereas we used a physiological K+-based internal solution and paired inhibition with CF activation, analogous to the induction protocol for PF LTD. Interestingly, synchronous depolarization and inhibitory activity can block rebound potentiation (Kawaguchi and Hirano, 2000; Kawaguchi and Hirano, 2002), as does postsynaptic BAPTA (Kano et al., 1992). This suggests that LTD of inhibitory input by conjunctive CF stimulation may have a lower physiological threshold than rebound potentiation.
Readout of plasticity via the spike response
To test the effect of CF-induced plasticity on spike responses, we quantified the effect of excitatory and inhibitory inputs on Purkinje cell spiking before and after the induction of plasticity. Long-term depression of both excitatory and inhibitory inputs led to corresponding and comparable reductions in the effect of the inputs on spike number and timing. Thus, plasticity of isolated parallel fiber and inhibitory inputs is sensitively reflected in the spike response and therefore transmitted to downstream neurons. Our results represent one of the few instances to date in which activity-dependent long-term changes in synaptic strength at identified synapses in the mammalian CNS have been directly linked to their impact on spike output (Bliss and Lømo, 1973; London et al., 2002; Smith and Otis, 2005).
In vivo, it is unlikely that parallel fiber and inhibitory inputs are active in isolation. Rather, each input arrives in the context of ongoing activity at other synapses and/or is tightly correlated in a feedforward excitatory–inhibitory sequence. Purkinje cells in vivo typically respond to brief sensory stimuli with sharp increases of spike probability followed by a more prolonged inhibition of firing (Bower and Woolston, 1983; Ebner et al., 1983; Holtzman et al., 2006). This is consistent with a feedforward excitation–inhibition sequence, as observed during direct stimulation of parallel fiber input in vivo (Eccles et al., 1966) and in vitro (Brunel et al., 2004; Mittmann et al., 2005). However, apparently pure excitatory or inhibitory responses can also sometimes be observed (Bower and Woolston, 1983; Ebner et al., 1983; Holtzman et al., 2006). The precise balance of excitation and inhibition is likely to be subject to numerous factors, such as the level and spatial distribution of synchrony in the granule cell population, the rate of spontaneous activity in molecular layer interneurons, and modulatory neurotransmitters that can regulate the strength of both excitatory and inhibitory synapses (Freedman et al., 1977; Llano and Gerschenfeld, 1993; Hirono and Obata, 2006).
Using dynamic clamp to examine a range of input combinations, we demonstrated that the balance of excitation and inhibition in the feedforward inhibitory response has a critical impact on the readout of plasticity triggered by the CF. For a mixture of excitation and inhibition, the strength of excitation can be read out by the directly triggered spikes, whereas the strength of inhibition can be read out by the duration of the pause after the input. These findings hold over a large range of ratios between excitation and inhibition and also for a large range of amplitudes because the feedforward inhibition helps to prevent saturation of spike responses by excitation. Interestingly, however, for inputs with large inhibitory components, the net spike output is paradoxically increased by CF-triggered LTD.
The CF-mediated LTD of both inhibitory and excitatory inputs into Purkinje neurons we describe here is complemented by the reported effects of PF stimulation alone. In the absence of CF stimulation, trains of PF stimuli lead to potentiation of PF inputs to Purkinje cells (Lev-Ram et al., 2002), whereas PF to interneuron synapses are depressed (Rancillac and Crepel, 2004; Smith and Otis, 2005; Beierlein and Regehr, 2006). The net effect on the spike output of the Purkinje cells is a broadened excitatory phase (Smith and Otis, 2005). Thus, it is likely that different patterns of activity will change the balance between excitation and inhibition. The quantification we present here will aid in predicting the results of those changes.
Functional implications
How will these changes in Purkinje cell spike output affect the downstream neurons in the deep cerebellar nucleus (DCN)? DCN neurons respond to brief sensory stimuli with an initial excitation, followed by a sequence of inhibition and rebound excitation (Eccles et al., 1974; Rowland and Jaeger, 2005), which likely reflects the feedforward excitation–inhibition input sequence at the Purkinje cells that inhibit DCN neurons. For the rapidly triggered spikes in Purkinje cells evoked during the brief excitatory phase, the direct readout of PF LTD may be crucial for governing synchronization of Purkinje cells along a folium, which receive shared input via the PF system and thus for determining the resulting pause in DCN spiking. The duration of the spike pause in Purkinje cells, which is sensitive to the strength of inhibitory input, could also be an important signal for the downstream targets, because the pause relieves tonic inhibition of DCN neurons and depression of the Purkinje cell–DCN synapses (Telgkamp and Raman, 2002; Pedroarena and Schwarz, 2003).
Furthermore, depression of the inhibitory input governs the net spike output when the inhibitory component is large. Therefore, if the net spike output for a given feedforward input is negative, CF-triggered plasticity should lead to an increase in net spike output and vice versa because both components of the input are depressed by a similar amount. CF-triggered plasticity of feedforward inputs with large inhibitory components therefore stands in contradiction with the Marr–Albus–Ito theory, because such plasticity would lead to stronger overall inhibition of DCN neurons in response to the input. These suggestions could be tested by examining in parallel the effect of motor learning on the sensory-evoked spiking responses of Purkinje cells and DCN neurons. Ultimately, our findings underline the importance of the balance of excitation and feedforward inhibition and the context of synaptic input when interpreting the effect of synaptic plasticity on spiking.
Footnotes
-
This work was supported by grants from the Wellcome Trust, European Commission, and the Gatsby Foundation. W.M. was supported by the Neuroscience Graduiertenkolleg of the University of Freiburg. We thank Mickey London, Troy Margrie, Pablo Monsivais, and Arnd Roth for helpful discussions, and Jenny Davie, Beverley Clark, Mark Farrant, Mickey London, Ede Rancz, Jesper Sjöström, and Spencer Smith for comments on this manuscript.
- Correspondence should be addressed to Michael Häusser, Wolfson Institute for Biomedical Research, University College London, Gower Street, London WC1E 6BT, UK. m.hausser{at}ucl.ac.uk


