

Abstract
In vertebrates, the peripheral nervous system has retained its regenerative capacity, enabling severed axons to reconnect with their original synaptic targets. While it is well documented that a favorable environment is critical for nerve regeneration, the complex cellular interactions between injured nerves with cells in their environment, as well as the functional significance of these interactions, have not been determined in vivo and in real time. Here we provide the first minute-by-minute account of cellular interactions between laser transected motor nerves and macrophages in live intact zebrafish. We show that macrophages arrive at the lesion site long before axon fragmentation, much earlier than previously thought. Moreover, we find that axon fragmentation triggers macrophage invasion into the nerve to engulf axonal debris, and that delaying nerve fragmentation in a Wlds model does not alter macrophage recruitment but induces a previously unknown ‘nerve scanning’ behavior, suggesting that macrophage recruitment and subsequent nerve invasion are controlled by separate mechanisms. Finally, we demonstrate that macrophage recruitment, thought to be dependent on Schwann cell-derived signals, occurs independently of Schwann cells. Thus, live cell imaging defines novel cellular and functional interactions between injured nerves and immune cells.
Introduction
In response to injury, axons of both the CNS and the peripheral nervous system (PNS) undergo a stereotyped and genetically regulated form of self-destruction known as Wallerian degeneration (Waller, 1849). Key to this process is the Wlds protein, originally identified in C57BL/Ola mice, which delays axonal fragmentation through a cell autonomous mechanism (Lunn et al., 1989; Perry et al., 1990; Coleman et al., 1998; Conforti et al., 2000; Raff et al., 2002). While the axon autonomous mechanisms of this self-destruction program have been studied extensively, the cellular and molecular interactions between injured axons and non-neuronal cells such as glial and immune cells are less well characterized. In the periphery, Schwann cells and macrophages remove the cellular and membranous debris of the fragmented nerve, thereby generating an extracellular milieu conducive to axonal regeneration (Holtzman and Novikoff, 1965; for review, see O'Daly and Imaeda, 1967; Stoll et al., 1989b; Hirata et al., 1999; Hirata and Kawabuchi, 2002; Vargas and Barres, 2007).
In addition to their phagocytic role, Schwann cells are thought to recruit immune cells to the lesion site (Banner and Patterson, 1994; Subang and Richardson, 1999; Shamash et al., 2002; Tofaris et al., 2002), and macrophage infiltration and rapid debris removal are considered key prerequisites for nerve regeneration (for review, see Perry and Brown, 1992). For example, Wlds overexpression in sensory axons reduces macrophage recruitment and delays functional regeneration, suggesting that the processes of axonal degeneration and regeneration are intricately interconnected (Bisby and Chen, 1990; Brown et al., 1992; Chen and Bisby, 1993a,b). Yet despite their importance for nerve degeneration and regeneration, the cellular interactions between injured nerves and macrophages have not been determined in vivo and in real time.
Here, we examine the cellular interactions between motor nerves and macrophages following complete nerve transection. We show that as in mammals, myelinated zebrafish peripheral motor nerves undergo Wallerian degeneration, followed by functional regeneration, and that motor axons are sensitive to Wlds expression. We provide the first minute-by-minute account of the destruction speed and synchrony of individual motor axons in a live intact vertebrate animal. Moreover, using overexpression and loss-of function approaches we characterize macrophage recruitment to injured nerves and demonstrate that macrophage recruitment and function occurs independently of Schwann cells. Finally, we uncover a previously uncharacterized plasticity of macrophage behavior as they interact with injured nerves.
Materials and Methods
Zebrafish genetics and transgenes.
All transgenic lines are maintained in the Tubingen or Tupfel longfin (TL) genetic background and raised as described previously (Mullins et al., 1994). For the majority of the experiments described, the Tg(mnx1:GFP)ml2 (Flanagan-Steet et al., 2005) (ZFIN ID: ZDB-ALT-051025-4) and the Tg(Xla.Tubb:DsRed)zf148 (Peri and Nüsslein-Volhard, 2008) (ZFIN ID: ZDB-ALT-081027-2) lines were used to label spinal motor nerves, and the Tg(spi1:Gal4,UAS:EGFP)zf149 (ZFIN ID: ZDB-ALT-081027-3) transgene to label leukocytes, including macrophages (Peri and Nüsslein-Volhard, 2008). Sox10−/− (colorless) mutants (Kelsh et al., 1996; Dutton et al., 2001) were used in Figure 7. The Tg(mnx1:Wlds-GFP)p160 line was generated by microinjection of mnx1:Wlds-GFP plasmid DNA as previously described (Thermes et al., 2002). Zebrafish of either sex were used, and all zebrafish work was conducted in accordance with Institutional Animal Care and Use Committee regulatory standards.
Stochastic cell labeling.
Axons were stochastically labeled by microinjection of 33 pg of mnx1:dsRed DNA at the 1 cell stage as previously described (Thermes et al., 2002). The dsRed fluorophore will be strongly expressed by 24 hours postfertilization, concomitantly with the expression of GFP in the transgenic line Tg(mnx1:GFP)ml2.
Plasmid construction.
Standard molecular biology methods were used to generate the mnx1:Wlds-GFP plasmid with Isce-I meganuclease sites for DNA injection. The Wlds gene was a kind gift from Dr. J. Milbrandt (Washington University School of Medicine, St. Louis, MO), and was cloned from the pcDNA3 vector using the flanking BamHI sites into the pBluescript vector. To make a C-terminally tagged Wlds construct the Wlds C-terminal end was mutagenized before the stop codon to engineer in a NheI site (Stratagene Quikchange II XL site-directed mutagenesis kit). eGFP was then cloned into the NheI site. A EcoRI/XbaI digestion was used to clone Wlds-eGFP into pCS2+, and then, using the Gateway system (Hartley et al., 2000), Wlds-eGFP was moved into the pIsce-I expression plasmid downstream of the mnx1 promoter in between the SpeI and XbaI sites.
The following Site-Directed Mutagenesis Primers were used to engineer in a NheI site before the Wlds stop codon for insertion of eGFP: 5′ACCACTTCCACTTTGGCTAGCTCATCACCATCACC3′ (forward), 5′GGTGATGGTGATGAGCTAGCCAAAGTGGAATGGT3′ (reverse).
Nerve transection.
Nerve injury was performed using a MicroPoint Computer-Controlled ablation system (Andor Technology) consisting of a nitrogen-pumped dye laser (wavelength 435 nm) controlled by MetaMorph version 7.7 or by Slidebook version 5.0. Ablation laser settings on either software package ranged from power 55 to 72 depending on the age of the cumerin dye. One to four motor nerves per larva in hemisegments 10–16 were transected in all experiments (see Figs. 1⇓⇓⇓⇓⇓⇓–8), except in Figure 4, H–O (see below), where 28 motor nerves (hemisegments 5–33) were transected per larva. To transect nerves a thin rectangular ROI was drawn digitally in either Slidebook or Andor Technology MicroPoint over the image of the nerve, ∼20 μm from the spinal cord exit point, and the nerve was laser pulsed precisely within that ROI in ∼20 s intervals until all axons in the nerve appeared transected, whereby axonal fluorescence did not refill the ROI in >10 s.
Live imaging.
Larvae at 5 days postfertilization (dpf) were mounted in MatTek glass bottom culture dishes in 1.5% low melt SeaPlaque agarose prepared with Ringer's plus Tricaine (0.016% Tricaine). Images were acquired on an Olympus IX 71 or 81 microscope equipped with a Yokogawa CSU 10 scan head combined with a Hamamatsu EMCCD camera (model C9100-13). Acquisition and hardware were controlled by MetaMorph version 7.7 or Slidebook version 5.0, respectively. Diode lasers for excitation (488 nm for GFP and 561 nm for dsRed) were housed in a Spectral Applied Research launch. Image stacks for time lapse movies were acquired every 5–10 min, typically spanning 60–75 μm at 1 μm intervals, with an Olympus 60×, 1.2 NA (numerical aperture) UPlanSApo water-immersion objective. The gain for all images captured was set at 191, resolution was 512 × 512 pixel resolution, and image capture time for nerves was between 150 and 300 ms (50–100 ms for cell bodies). For imaging over 2 h, Immersol was used instead of water. GFP emission filter: 525/50, lot no. 119342, mCherry emission filter: 630/75, lot no. 200406. For regeneration experiments, larvae were removed from agarose and Tricaine following transection and left to recover in clean E3 in individual Petri dishes. Larvae were remounted as above for each imaging session at 24 or 48 h post-lesion.
Image processing.
Image stacks were compressed into maximum intensity projections (MIPs) in their respective acquisition software package. MIPs were exported and gamma adjusted to 0.5 in ImageJ for increased visibility, color assigned by acquisition wavelength, and analyzed. Brightness, contrast, and color levels were adjusted for maximal visibility in Adobe Photoshop CS4.
Electron microscopy.
Embryos at 5 dpf were fixed in 6% glutaraldehyde in either 0.1 m cacodylate or phosphate buffer pH 7.2–7.4 for at least 1 h at room temperature, and used immediately or stored for up to several days at4°C in the fixative. Head, yolk sac, yolk extension and most of the tail fin were removed within the first minutes of fixation to allow better penetration of the fixative. Tails were postfixed in 2% OsO4 in the same buffer, en bloc stained with saturated aqueous uranyl acetate for 2 h, and embedded in Epon 812. Sections were cut in a Leica Ultracut R ultramicrotome using a Diatome diamond knife (CH-2501), stained in lead citrate solution, and examined in a Phillips 410 electron microscope (Philips Electron Optics) equipped with a Hamamatsu C4742-95 digital imaging system (Advanced Microscopy Techniques).
Behavioral assays, video recording, and behavioral analysis.
Acoustic startle responses were elicited, recorded, and measured as previously described (Burgess et al., 2009), with the following modifications. To record acoustic startle responses, high-speed video images were recorded using a Motion Pro camera (Redlake) at 1000 frames per second, and with 512 × 512 pixel resolution, using a 50 mm macro lens. Behavioral analysis was performed with the FLOTE software package to determine initiation and the kinematic properties of acoustic startle responses (Burgess and Granato, 2007; Burgess et al., 2009). Student's t test was used to calculate p-values. Acoustic startle stimuli were provided by a small vibrational excitor (Bruel and Kjaer), with 3 ms duration, 1000 Hz waveforms, of ∼150 m/s2. Stimulus intensity was calculated by measuring the approximate displacement of the testing arena due to vibration. To evaluate acoustic startle behavior images were recorded 30 ms before and 90 ms following the delivery of the acoustic stimulus. All acoustic startle experiments were performed in a 4 × 4 testing arena so larvae could be tracked and analyzed individually. The 4 × 4 testing grids were laser-cut from acrylic by Pololu Corporation and then glued to a circular acrylic base plate (56 mm diameter, 1.5 mm thick; Pololu Corporation) with thin acrylic cement (Weld-On #3, IPS Corporation). The base plate was affixed to the inside of a 6 cm Petri dish lid with acrylic cement (Weld-On #16, IPS Corporation). The Petri dish lid was then attached to a metal ring with modeling clay, and the metal ring was connected to the vibrational excitor by a titanium rod (Burgess and Granato, 2007; Burgess et al., 2009). For image capture purposes, a 96 bulb infrared LED array (IR100 Illuminator removed from housing, YYtrade Inc.) was positioned below the testing arena. A three mm-thick sheet of white acrylic, positioned ∼3 cm below the testing arena, diffused the infrared light. A white LED bulb (PAR38 LED light, LEDlight.com) was positioned above the testing arena to illuminate the testing arena with white light.
Results
Zebrafish spinal motor nerves as a model for injury-induced Wallerian Degeneration
To monitor the events during nerve degeneration in real time we imaged zebrafish spinal motor nerves between 5 and 7 dpf following complete nerve transection. We used a pumped dye laser (MicroPoint, Andor Technology) to transect individual, Tg(mnx1:GFP)-positive motor nerves within the first ∼20 μm of their peripheral trajectory (Fig. 1A,B; Flanagan-Steet et al., 2005). Zebrafish motor nerves consist of ∼70 motor axons (Myers, 1985; Westerfield et al., 1986), of which the large-diameter axons are myelinated by Schwann cells, while the small-diameter axons exhibit little or no myelination (Fig. 1F). This is roughly equivalent to the degree of myelination seen within the first postnatal week in mouse and rat (Peters and Muir, 1959; Schlaepfer and Myers, 1973; Hahn et al., 1987; for review, see Garbay et al., 2000). To visualize individual axons in the context of the entire nerve we stochastically labeled individual motor neurons using mnx1:dsRed. Stochastic labeling results in individual cells that retain and express the injected DNA construct, surrounded by cells which do not retain the DNA and hence do not express the construct (Downes et al., 2002). Individual motor axons form primary, secondary and tertiary branches that synapse with the underlying muscle fibers, and also form myotendinous junctions along hemisegment boundaries (Fig. 1B; Myers et al., 1986; Westerfield et al., 1986; Zhang et al., 2004). Time-lapse analysis of uninjured motor nerves revealed occasional and short-lived (<20 min) filopodial extensions and retractions of <11 μm (data not shown). Importantly, the overall anatomy and branching pattern of individual axons and nerves was stable over several hours and even days, characteristic for mature peripheral nerves.

Nerve degeneration in zebrafish. A, A 5 dpf Tg(mnx1:GFP) larva expressing GFP in spinal motor neurons and their axons. White box outlines a single motor nerve. B, Spinal motor nerve magnified from white box in A with single cell mnx1:dsRed labeling. White rectangle indicates area of laser axotomy; arrowheads point to the nerve extending along the hemisegment boundary. C–E, Following transection, a gap forms in the nerve (bracket). C, D, Axon fascicles retract both proximally and distally from the lesion site (bracket) until fragmentation starts (D, arrows). Eventually, the entire distal nerve fragments, and the debris is gradually cleared (E). Scale bar, 10 μm. F, Electron micrograph of a cross section through a trunk motor nerve at the depth of the dashed line in B. Schwann cells are shaded yellow, small-diameter axons are shaded pink, and large-diameter axons are shaded green. Arrows point to myelin sheath. Scale bar, 500 nm. G, Quantification of nerve fragmentation onset from 49 nerves in 18 animals.
We first documented the morphological changes following complete nerve transection (Fig. 1; see also Movie 1). Immediately following lesion the proximal and distal nerve fascicles sprang apart, resulting in a gap at the lesion site (Fig. 1C). Over the next 120–240 min the proximal and distal nerve stumps continued to retract until the distal portion of the nerve began to fragment rapidly (Fig. 1D, quantified in G). Interestingly, once initiated, fragmentation occurred along the entire length of individual axons within minutes (Figs. 1D, 2A–F). Individual axons within the transected nerve initiated fragmentation at different times, independent of axon diameter or myelination (Fig. 2C–F). Eventually, the entire nerve fragmented (Fig. 1E), and over the next 24 h axonal debris was gradually removed (see Fig. 4B,C). Analysis of 49 transected nerves in 18 animals revealed that spinal motor nerve degeneration occurs with stereotyped and quantifiable parameters. As shown in Figure 1G, axonal fragmentation is first detected between 121 and 240 min, with the majority of nerves starting to fragment between 151 and 210 min post-transection.

Individual axons degenerate independently, with sub-minute timing, and succession of fragmentation is independent of axon diameter. A, Pre-lesion image of motor nerve in 5 dpf Tg(mnx1:GFP) larva. B, C, All axons are intact the minute before the first axon, of large diameter, begins to fragment (C, arrows). D–F, Individual axons continue to fragment within the nerve (D) and after 1 min, several small-diameter axons fragment (E, arrows), followed later by another large-diameter axon (F, arrows). Scale bar, 10 μm.
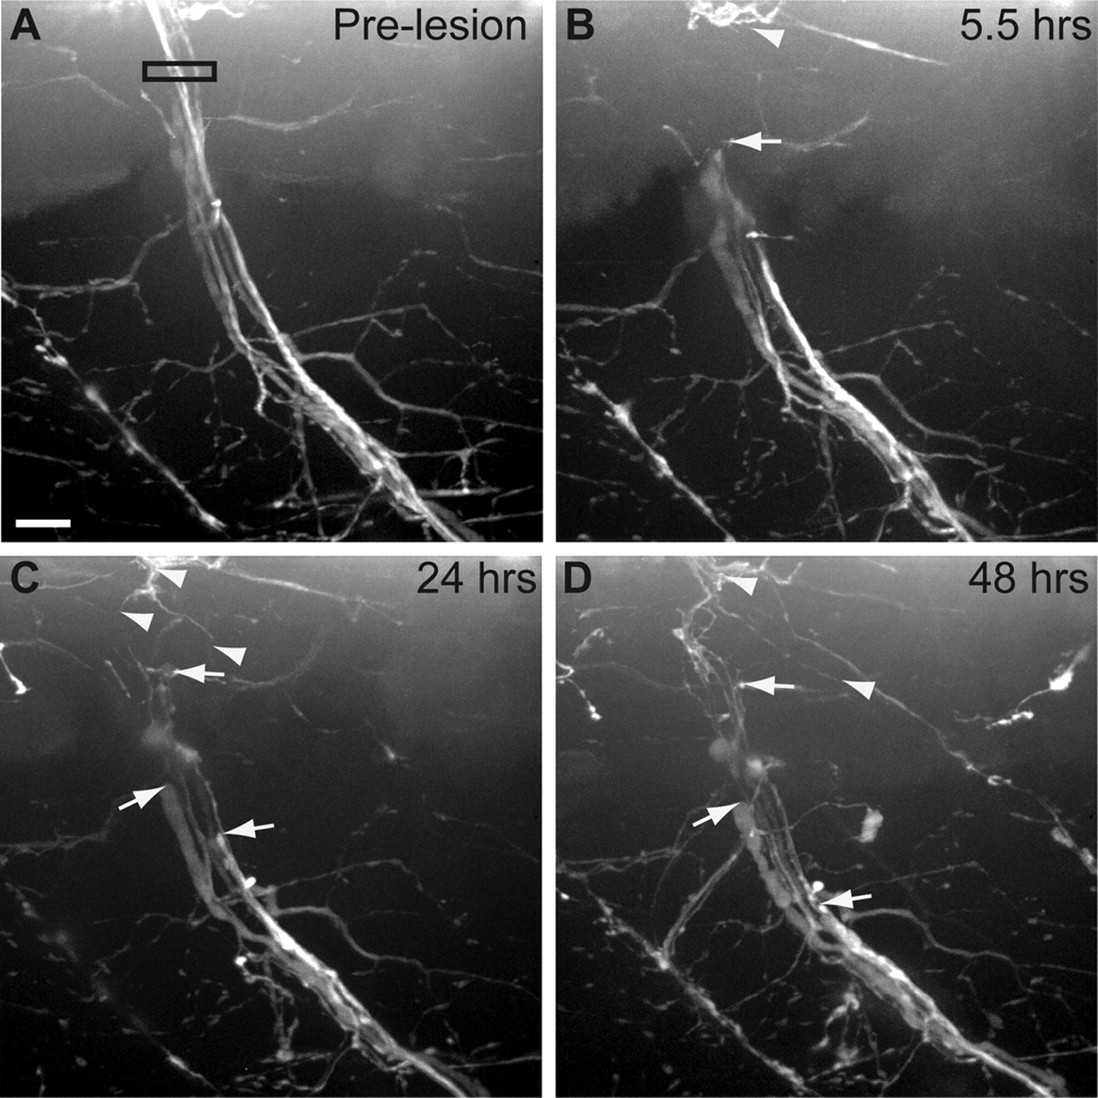
In all species tested, expression of the Wallerian Degeneration Slow protein (Wlds) significantly delays the onset of axon fragmentation through an axon-autonomous mechanism, consistent with an evolutionarily conserved, Wlds-sensitive axonal destruction program (Martin et al., 2010; Lunn et al., 1989; Wang et al., 2001; Raff et al., 2002; Araki et al., 2004; Adalbert et al., 2005; Hoopfer et al., 2006; MacDonald et al., 2006). Transient expression of Wlds in individual zebrafish sensory and CNS axons provides neuroprotection (Feng et al., 2010; Martin et al., 2010), however, neither transient nor transgenic Wlds models for zebrafish motor neurons have been reported. Therefore, we generated several stable transgenic lines expressing high levels of GFP tagged Wlds under the control of the motor neuron-specific mnx1 promoter. Motor nerves in the Tg(mnx1:Wlds-GFP)p160 line that stably express Wlds-GFP are morphologically indistinguishable from those in wild-type animals (Fig. 3A). Following laser-mediated transection, Wlds-GFP-expressing nerves do not degenerate and instead remain intact for up to 8 d (n = 25 nerves; Fig. 3B–D compared with Fig. 1D,E). Thus, stable transgenic expression of Wlds in zebrafish motor neurons efficiently delays injury-induced Wallerian degeneration. Combined, these data demonstrate that following transection zebrafish spinal motor axons degenerate through a Wlds-sensitive process with morphological hallmarks characteristic of Wallerian degeneration.

Axonal expression of Wlds delays Wallerian degeneration. A, Pre-lesion image of a Tg(mnx1:Wlds-GFP); Tg(mnx1:GFP)-expressing nerve. Black box indicates area of laser axotomy. B, Although completely transected, the distal portion of Tg(mnx1:Wlds-GFP); Tg(mnx1:GFP)-expressing nerve remains intact. Arrowhead indicates proximal nerve stump; arrows indicate most proximal end of distal nerve fascicles. C, D, Distal nerve remains intact 24 hpt (C) and 48 hpt (D), while axons continue to retract from lesion site (arrows). Some axons from the proximal stump have begun to regrow (arrowheads). Scale bar, 10 μm.
Functional recovery of transected motor nerves
In vertebrates, peripheral axons have retained their capacity for regrowth and frequently achieve functional regeneration. Regrowth of individual sensory and CNS axons has been documented in larval zebrafish (van Raamsdonk et al., 1998; Bhatt et al., 2004; O'Brien et al., 2009; Reimer et al., 2009; Martin et al., 2010; Wyatt et al., 2010), yet a time course of functional recovery of transected peripheral nerves has not yet been reported. Tg(mnx1:GFP) nerves containing a small number of mnx1:dsRed-positive axons (1–5 axons) were transected as before and repeatedly imaged over a time course of up to 5 d (Fig. 4A–D). At 9.5 hours post-transection (hpt) the entire nerve portion distal to the transection site had fragmented, leaving behind only axonal debris (Fig. 4B). Importantly, the somata of axotomized mnx1:dsRed-positive motor neurons survived (Fig. 4E–G, n = 19 of 19 neurons), and within 24 hpt these dsRed-positive motor neurons reextended axons along with GFP-positive axons past the lesion site into the ventral myotome (Fig. 4C, n = 29 of 52 nerves). Regenerating axons regrew through the center of the hemisegment, following the precise trajectory originally established during development (Westerfield et al., 1986). Within 48 hpt, GFP and dsRed-positive axons extended and reestablished complex branches throughout the ventral myotome and along hemisegment boundaries (Fig. 4D, n = 23 of 37 nerves).

Functional regeneration of transected motor nerves. A, Pre-lesion nerve in Tg(mnx1:GFP) with mnx1:dsRed-colabeled axons. White box indicates area of laser axotomy. B, At 9.5 hpt nerve has completely fragmented. C, At 24 hpt GFP+ and dsRed+ axons have regrown into the ventral myotome and the hemisegment boundaries. D, At 48 hpt axons have extended throughout the ventral myotome and branched. E–G, DsRed+ and GFP+ somas remain intact 24 and 48 h after axotomy. Scale bar, 10 μm. H–M, Composites from high speed movies (1000 frames/s) document startle performance (SLC), before acoustic stimulation (position 1), at maximum C-bending angle (position 2), and 90 ms after stimulation (position 3). Asterisk indicates initial head turning angle, quantified in N, and green dotted line indicates swimming distance, quantified in O. N, O, Quantification of SLC performance, measuring the head angle (N) and swim distance (O), comparing turns to the left (control side, blue), and right (experimental side, red). n = number of rightward or leftward startle responses analyzed. *p < 0.001 vs SLC-Leftward Pre-lesion, **p < 0.001 vs SLC-Rightward Pre-lesion. P, At 7 hpt the transected nerves in hemisegments 5–10 have fragmented distal to the lesion. Q, At 48 hpt axons in hemisegments 5–10 have reextended through the ventral myotome and branched. Scale bar, 10 μm.
We next asked whether these regrown axons restore functionality to their muscle targets. To address this we used a well established and quantifiable behavioral assay, the startle response (Kimmel et al., 1974; Liu and Fetcho, 1999; Burgess and Granato, 2007). The startle response is characterized by a short latency C-start (termed SLC), followed by a short swimming episode, and its performance critically depends on the simultaneous and unilateral activation of trunk muscle by spinal motor nerves (Fig. 3H; Eaton and Hackett, 1984; Liu and Westerfield, 1988; Liu and Fetcho, 1999). Before nerve transections, Tg(mnx1:GFP) larvae performed startle responses with stereotypic kinematic parameters, including a characteristic initial head turning angle of ∼130° toward the right or left side (Fig. 4N). In each larva we spared the four anterior nerves, but transected the remaining 28 posterior spinal motor nerves innervating the right trunk and tail muscles (see Material and Methods for details). As before, we imaged these transected nerves and confirmed at 7 hpt that the entire nerve portion distal to the transection site had fragmented, leaving behind only axonal debris (Fig. 4P, only nerves in hemisegments 5–10 shown), and at 48 hpt confirmed that these nerves had reextended axons through the ventral myotome (Fig. 4Q, only nerves in hemisegments 5–10 shown). At 3, 24 and 48 hpt we assayed the ability of these larvae to perform rightward and leftward startle responses. At 3 and 24 hpt the head turning angles of rightward startle responses and overall swimming distances were dramatically reduced (Fig. 4I,N,O). In contrast, by 48 hpt these parameters had reached pre-lesion levels, suggesting that regrowing axons restored functionality to their muscle targets (Fig. 4J,N,O, n = 7 larvae). Importantly, head turning angles of leftward startle responses at all time points were indistinguishable from those recorded before transection (Fig. 4K–N, n = 7 larvae). Thus, following transection spinal motor neurons survive, reextend axons along their original trajectories, and restore functionality to their muscle targets.
Macrophages arrive at the lesion site before axonal fragmentation
Having established a reliable system for visualizing nerve degeneration and regeneration, we next examined macrophage behavior in response to nerve injury. Following insult axons fragment in a stereotyped manner leaving behind cellular and membranous debris, which is cleared by Schwann cell and macrophages (Waller, 1849; Lubińska, 1977; Beuche and Friede, 1984, 1986; for review, see Vargas and Barres, 2007). Macrophages have been reported to accumulate at the injured nerve only after fragmentation, and their recruitment is thought to depend on signals released from Schwann cells (Perry et al., 1987; Lunn et al., 1989; Stoll et al., 1989a,b; Monaco et al., 1992; Banner and Patterson, 1994; Avellino et al., 1995; Subang and Richardson, 1999; Hirata and Kawabuchi, 2002; Shamash et al., 2002; Tofaris et al., 2002; Vargas and Barres, 2007). Despite the significance of their proposed roles, when macrophages first arrive at the lesion and how they interact with injured nerves is not well documented, mainly due to the difficulties of continuously imaging inside live, intact vertebrate animals.
To monitor macrophage behavior in response to nerve transection in vivo and in real time we simultaneously imaged motor nerves using the Tg(Xla.Tubb:DsRed) transgene, and spi1-positive immune cells using the Tg(spi1:Gal4,UAS:EGFP) transgene (Peri and Nüsslein-Volhard, 2008). In zebrafish, spi1 (also known as Pu.1) promotes the differentiation of macrophages from their myeloid precursors (for review, see Bennett et al., 2001; Rhodes et al., 2005), and the Tg(spi1:Gal4,UAS:EGFP) line has previously been shown to mark derivatives of the leukocyte linage, including microglia in the brain, as well as early macrophages in the trunk (Peri and Nüsslein-Volhard, 2008). Moreover, the appearance and behavior of spi1:Gal4,UAS:EGFP-expressing cells that responded to nerve injury in the trunk (see below) were identical to those previously reported for zebrafish macrophages (Herbomel et al., 1999), and thus we will refer to these cells as macrophages. Before nerve transection the majority of macrophages were within blood vessels, and although a small number of spi1:Gal4,UAS:EGFP-expressing cells localized outside the vasculature, they were never observed along motor nerves (Fig. 5A). Analysis of 49 transected nerves revealed that in >80% of cases macrophages left the vasculature and arrived at nerves within the first 120 min post-lesion, which is the earliest time point we observed the onset of axonal fragmentation (Fig. 5B,C; see also Movie 2). Moreover, in 69% of cases the first macrophages arrived within 60 min, ∼60–120 min before the onset of axonal fragmentation (Table 1). Upon their arrival, macrophages preferentially localized to the distal nerve stump immediately adjacent to the lesion site, where some of these macrophages became stationary and assumed an ovoid morphology, though their membranes continued to ruffle (Fig. 5C). As soon as axons in the distal nerve began to fragment, macrophages infiltrated the fragmenting nerve and began to phagocytose axonal debris (Fig. 5D–F; see also Table 1). To confirm the identity of the GFP-positive cells in the Tg(spi1:Gal4,UAS:EGFP) line, we repeated these experiments in the Tg(mpeg1:GFP) line (Ellett et al., 2011), which expresses GFP only in macrophages, and not in neutrophils. Following nerve lesion we find that in 62% of cases GFP-expressing macrophages arrived at lesioned motor nerves within the first hour of imaging (n = 13 motor nerves in 5 larvae), and that their behavior was identical to the behavior of the spi1:Gal4,UAS:EGFP-expressing cells in the Tg(spi1-Gal4,UAS-GFP) line (data not shown). Thus, macrophages arrive at the injury site long before nerve fragmentation, and with the onset of axonal fragmentation, macrophages enter the nerve and begin to phagocytose nerve debris.

Recruitment and function of macrophages following nerve injury. A, Pre-lesion image in Tg(X1a.Tubb:DsRed); Tg(spi1-Gal4,UAS-GFP) larva. White box indicates area of laser axotomy. B, Macrophages (arrowhead) arrive and contact the lesioned distal nerve. C, Additional macrophages (arrowhead) are recruited to the lesion site. D, Upon onset of nerve fragmentation, macrophages phagocytose distal axon debris (yellow arrows). E, Hours after lesioning, macrophages remain at both the lesion site (arrowheads) and the distal nerve where they phagocytose debris (yellow arrows). F, Projection of eight focal z-planes from E, totaling 8 μm deep, show red axonal debris within green macrophages. Scale bar, 10 μm.
Quantification of macrophage recruitment to peripheral nerves following nerve transection or muscle lesion
We next asked whether potential damage caused during laser axotomy to neighboring tissue, such as muscle fibers, might influence macrophage recruitment. To address this we laser damaged a small area of a muscle fiber within ∼10–15 μm of the nerve (same focal plane) without visibly damaging the nerve (Fig. 6A). Macrophages readily infiltrated the myotome (Fig. 6B), specifically targeted the damaged muscle fiber, and eventually left the area without invading the nerve (Fig. 6C–F, n = 4 of 4; compared with Fig. 5). Thus, injury to nearby muscle cells does not trigger extensive cell contacts between macrophages and the nerve, suggesting that macrophage recruitment and invasion into the distal nerve following transection likely occurs in response to signals released by nerve constituents such as the motor axons, perineural glia, and/or Schwann cells.

Recruitment and function of macrophages following muscle injury. A–C, Image sequence shows that upon lesion to nearby muscle tissue, macrophages migrate directly to the lesion site without investigating the nerve. A, Pre-lesion image of Tg(X1a.Tubb:DsRed); Tg(spi1-Gal4;UAS-GFP) larva. White box indicates area of muscle lesion (muscle cells are unlabeled), at the same focal plane of the nerve. B, A macrophage migrates directly to muscle lesion site (C). D, E, Macrophages remain at muscle lesion, and presumably phagocytose muscle cell debris (unlabeled), evidenced by vacuoles (arrowheads). F, Eventually, macrophages exit the lesion site. Scale bar, 10 μm.
Macrophage behavior and recruitment to injured motor nerves is independent of Schwann cells and axonal Wlds expression
Following nerve injury, macrophage recruitment and activation are thought to be triggered by reciprocal interactions between macrophages and Schwann cells (Banner and Patterson, 1994; Subang and Richardson, 1999; Shamash et al., 2002; Tofaris et al., 2002). However, injury-induced nerve degeneration in animals with a genetic ablation of all Schwann cells has not been examined. We therefore used sox10−/− (colorless) mutants, which lack all Schwann cells (Kelsh et al., 1996; Dutton et al., 2001). In these animals, motor axons develop without delay, and at 5 dpf their motor nerves are morphologically indistinguishable from those in wild-type siblings (Fig. 7A). Following transection, degeneration of Tg(X1a.Tubb:DsRed); sox10−/− nerves proceeded with the same morphological and temporal parameters we had observed in wild-type siblings (Fig. 7B–D). Moreover, macrophages arrived at the nerve lesion site with timing and morphology similar to those seen in wild-type larvae (Fig. 7B; see also Table 1). Finally, macrophages also infiltrated the fragmenting distal nerve and phagocytosed axonal debris with the same time course observed in wild-type siblings (Fig. 7C,D). Thus, genetic ablation of Schwann cells demonstrates that macrophage recruitment and function at injured nerves can occur independently of Schwann cells.

Macrophage recruitment to injured nerves occurs independently of Schwann cells. A, Pre-lesion image of Tg(X1a.Tubb:DsRed); Tg(spi1-Gal4,UAS-GFP); sox10−/− larva. White box indicates area of laser axotomy. B–D, Macrophages (arrowhead) are recruited to the nerve lesion site and phagocytose distal nerve debris following the onset of fragmentation (arrows). Scale bar, 10 μm.
We next assessed whether and to what extent macrophage recruitment and behavior are modulated by processes intrinsic to injured axons. For this we monitored macrophage behavior after injury of Wlds-GFP-expressing nerves. Before nerve transection macrophages behaved indistinguishably from those in Tg(mnx1:GFP) or Tg(Xla.Tubb:DsRed) animals. Following nerve transection we found that macrophages were recruited to the lesion site of Wlds-GFP-expressing nerves in similar numbers and within the same time frame when compared with wild-type nerves (Fig. 8B,C; see also Table 1). Despite the absence of axon fragmentation of Wlds-GFP-expressing nerves, over the 10 h following transection macrophages remained in extensive contact with the distal nerve stump immediately adjacent to the lesion site (Fig. 8C–I). At irregular intervals during this time period macrophages located at the nerve stump elongated and extended a process ventrally along the distal nerve (Fig. 8D–I, n = 3 of 15). This ‘scanning’ behavior, which we did not observe in wild-type nerves before the onset of axonal fragmentation, occurred without detectable signs of axonal fragmentation or phagocytosis (compare Fig. 5D,E with Fig. 8D–I). Thus, live imaging reveals that during Wallerian degeneration macrophage recruitment is insensitive to axonal Wlds-GFP, and describes a novel cellular behavior of macrophages when nerves fail to fragment.

Macrophages are recruited to injured Wlds-GFP-expressing nerves and display a novel behavior. A, Pre-lesion image in Tg(X1a.Tubb:DsRed); Tg(spi1-Gal4,UAS-GFP); Tg(mnx1:Wlds-GFP) larva. White box indicates area of laser axotomy. B, C, Macrophages (arrowheads) infiltrate the lesion site and accumulate at the lesioned nerve. D–I, During first ∼6.5 h following lesion, macrophages repeatedly extend and retract processes along the injured distal nerve. Scale bar, 10 μm.
Discussion
Wallerian degeneration is an early step toward functional nerve regeneration, and involves extensive cellular interactions between injured axons and multiple non-neuronal cells such as immune and glial cells. Early studies established that the environment generated by macrophages and Schwann cells is critical for successful nerve regeneration (Aguayo et al., 1981; David and Aguayo, 1981), and endpoint analysis of stained sections documented complex histological changes in Schwann cell appearance, myelin breakdown and macrophage influx following peripheral nerve injury (for review, see Martini et al., 2008). Albeit labor intensive and complex, in vivo imaging of nerve degeneration in murine models has been established, yet the focus has been primarily on changes in axons (Beirowski et al., 2004; Kerschensteiner et al., 2005). Thus, despite its importance, a minute-by-minute account of the cellular interactions between injured nerves and non-neuronal cells was lacking. Moreover, which of these cellular interactions are of functional significance is largely unknown.
We have taken advantage of the transparency of the zebrafish to precisely transect mature motor nerves and to image axonal destruction and the cellular response of macrophages in vivo and in real time. Overall, we find that nerve degeneration proceeds with the same morphological landmarks as those reported for Wallerian degeneration in mammals (Fig. 1; Waller, 1849; O'Daly and Imaeda, 1967; Lunn et al., 1989; George et al., 1995; Raff et al., 2002; Adalbert et al., 2005; Beirowski et al., 2005; Vargas and Barres, 2007; Martin et al., 2010). The lag time between injury and onset of axonal degeneration is known to vary significantly between vertebrate species (for review, see Vargas and Barres, 2007), and importantly, the lag time of 121–240 min we observed in zebrafish remained constant as larvae aged (6–14 dpf; data not shown), consistent with previous observations that motor nerves at 5 dpf have established mature trajectories and connections (Westerfield and Eisen, 1988). Moreover, we find that expression of Wlds in motor nerves effectively delays fragmentation, as previously reported in zebrafish sensory axons and in other species (Lunn et al., 1989; Wang et al., 2001; Raff et al., 2002; Araki et al., 2004; Adalbert et al., 2005; Hoopfer et al., 2006; MacDonald et al., 2006; Martin et al., 2010). In addition, we demonstrate that transected motor nerves reestablish functional connections with their muscle targets (Fig. 4). Together, these results validate zebrafish motor nerves as a model for functional nerve regeneration.
Our results characterize for the first time, and with unprecedented temporal and spatial resolution, the cellular interactions between injured nerves and immune cells. Importantly, these observations combined with genetic manipulations and cell type ablation lead to several new insights into the process of Wallerian degeneration. First, the spatiotemporal progression of axonal degeneration has historically been controversial, mainly due to the limitations of visualizing individual axons during this process. Earlier studies using fixed samples reported that axonal degeneration of dorsal root ganglion axons proceeds anterogradely at a rate of ∼3 mm/h (George and Griffin, 1994a), and similar studies had correlated axonal diameter with the onset of nerve fragmentation (Lubińska, 1977, 1982), while more recent studies observed retrograde progression (Beirowski et al., 2005). By imaging individual axons within the degenerating nerve at 1 min intervals, our data show that axons and their branches fragment within less than a minute along their entire length (Fig. 2). Within a transected nerve, fragmentation of individual axons appears desynchronized and proceeds without apparent order, independent of axonal caliber (Fig. 2). While species differences concerning the rate of axonal fragmentation are well documented (for review, see Vargas and Barres, 2007), the data presented here reveals heterogeneity even among individual motor axons of similar length and caliber within a shared nerve, and to our knowledge provide the first minute-by-minute account of the destruction speed and synchrony of individual motor axons in a live, intact vertebrate animal.
Second, our live cell imaging demonstrates that macrophages arrive at the lesion site long before the onset of fragmentation, independent of Schwann cells. Early studies, based on fixed samples, reported that 24 h following sciatic nerve crush macrophage counts were not increased, and that macrophages arrived at the lesion site by the second day (Perry et al., 1987; Stoll et al., 1989a,b; George and Griffin, 1994a,b; for review, see Brück, 1997), when nerve fragmentation is well underway. Recent studies show that at 36 h post-lesion sciatic nerve fragmentation is accompanied by macrophages, yet the precise arrival of macrophages in relation to nerve fragmentation had not been established (Beirowski et al., 2004). We find that macrophages arrive at the lesion site 60–120 min before the onset of axonal fragmentation (Fig. 5). Following axonal fragmentation, macrophages infiltrate the distal portion of the injured nerve and phagocytose debris, as previously observed in mammalian systems (Perry et al., 1987; Stoll et al., 1989a). To determine the necessity of Schwann cells in signaling to macrophages during Wallerian degeneration we used sox10−/− mutants which lack Schwann cells (Kelsh et al., 1996; Dutton et al., 2001). Schwann cells are thought to release chemokine signals that recruit immune cells to the lesioned nerve (Banner and Patterson, 1994; Subang and Richardson, 1999; Shamash et al., 2002; Tofaris et al., 2002). For example, infusion of antibodies blocking MIP-1α or macrophage chemoattractant protein-1 (MCP-1) function (Perrin et al., 2005), and genetic deletions of MCP-1 and its receptor CCR2, lead to reduced macrophage recruitment to the lesion site (Toews et al., 1998; Siebert et al., 2000). However, the role of Schwann cells on macrophage recruitment has not been determined in the complete absence of Schwann cells. We find that in the absence of Schwann cells motor axons develop normally, and upon lesion degenerate with the same morphology and kinematic parameters as observed in wild-type animals. Moreover, macrophages are recruited to the nerve lesion site with timing and numbers similar to those of wild-type animals, and upon axonal fragmentation also phagocytose debris (Fig. 7; see also Table 1), demonstrating that Schwann cells are dispensable for macrophage recruitment and function.
Last, our studies uncover a previously unknown behavior of macrophages when confronted with injured nerves in which fragmentation is delayed. Axonal expression of the Wlds protein not only delays nerve fragmentation, but is also thought to reduce macrophage recruitment to the lesioned nerve (Lunn et al., 1989). Live imaging reveals that macrophages are robustly recruited to injured Wlds-expressing nerves with timing and numbers similar to those of wild-type nerves (Fig. 8; see also Table 1). Although we cannot exclude the possibility that macrophages were attracted by damage to surrounding tissues or by axonal debris generated during laser transection, we observed macrophage recruitment in 15 of 15 transected nerves in which neither axonal fragmentation nor phagocytosis of axonal material by macrophages was detectable (Fig. 5E compared with Fig. 8C,G,I).
In the first ∼10 h following transection, macrophages maintain extensive contact with the Wlds-expressing nerve stump, and exhibited a novel ‘scanning’ behavior, repeatedly extending and retracting a process along the distal nerve (Fig. 8). This behavior was distinct from macrophage behavior following wild-type axon fragmentation. While our observations are consistent with the idea that the prolonged presence of macrophages is insufficient to trigger axonal fragmentation, they also suggest that macrophage behavior is modulated by nerve integrity. While the absence of axonal fragmentation does not abrogate macrophage recruitment to an injured nerve, it alters ‘on site’ macrophage behavior. This is somewhat reminiscent of axonal injury in the CNS, where resident microglia migrate with some delay to the lesion site, but for unknown reasons exert limited phagocytic activity (Lawson et al., 1994; for review, see Barron, 1995; Cui et al., 2009). This low rate of phagocytic activity contributes to the slower Wallerian degeneration rate in the CNS, compared with the PNS, although the rates of axonal fragmentation in the PNS and the CNS are comparable (Stoll et al., 1989b; George and Griffin, 1994b), and thus cannot account for the difference in phagocytic behavior. In contrast, the ‘scanning’ behavior we observe is only exhibited in the absence of nerve fragmentation. Such behavioral plasticity exhibited by leukocytes has previously not been reported and strongly suggests the existence of multiple, possibly independent signals regulating macrophage activity. A first signal attracts leukocytes to the injured nerve, while subsequent signal(s) initiate leukocyte invasion and phagocytosis of the distal nerve. While future studies are required to identify these signals, our results demonstrate the need to visualize in real time and at the functional level the complex interactions between the cell types involved in nerve degeneration and regeneration to define the molecular mechanisms that trigger and mediate these processes.
Footnotes
This work was supported by grants to A.F.R. (T32-GM007229 and F31 NS071722-01) and to M.G. (NIH R21-NS-070032, NIH HD-37975, and Muscular Dystrophy Association-131174). Thanks to D. Gilmour, F. Peri, and J. Milbrandt for providing constructs and fish lines. Thanks to Jonathan Raper and lab members for critical comments.
The authors declare no competing financial interests.
- Correspondence should be addressed to Michael Granato at the above address. granatom{at}mail.med.upenn.edu
References
- Adalbert et al., 2005.↵
- Aguayo et al., 1981.↵
- Araki et al., 2004.↵
- Avellino et al., 1995.↵
- Banner and Patterson, 1994.↵
- Barron, 1995.↵
- Beirowski et al., 2004.↵
- Beirowski et al., 2005.↵
- Bennett et al., 2001.↵
- Beuche and Friede, 1984.↵
- Beuche and Friede, 1986.↵
- Bhatt et al., 2004.↵
- Bisby and Chen, 1990.↵
- Brown et al., 1992.↵
- Brück, 1997.↵
- Burgess and Granato, 2007.↵
- Burgess et al., 2009.↵
- Chen and Bisby, 1993a.↵
- Chen and Bisby, 1993b.↵
- Coleman et al., 1998.↵
- Conforti et al., 2000.↵
- Cui et al., 2009.↵
- David and Aguayo, 1981.↵
- Downes et al., 2002.↵
- Dutton et al., 2001.↵
- Eaton and Hackett, 1984.↵
- Ellett et al., 2011.↵
- Feng et al., 2010.↵
- Flanagan-Steet et al., 2005.↵
- Garbay et al., 2000.↵
- George et al., 1995.↵
- George and Griffin, 1994a.↵
- George and Griffin, 1994b.↵
- Hahn et al., 1987.↵
- Hartley et al., 2000.↵
- Herbomel et al., 1999.↵
- Hirata and Kawabuchi, 2002.↵
- Hirata et al., 1999.↵
- Holtzman and Novikoff, 1965.↵
- Hoopfer et al., 2006.↵
- Kelsh et al., 1996.↵
- Kerschensteiner et al., 2005.↵
- Kimmel et al., 1974.↵
- Lawson et al., 1994.↵
- Liu and Westerfield, 1988.↵
- Liu and Fetcho, 1999.↵
- Lubińska, 1977.↵
- Lubińska, 1982.↵
- Lunn et al., 1989.↵
- MacDonald et al., 2006.↵
- Martin et al., 2010.↵
- Martini et al., 2008.↵
- Monaco et al., 1992.↵
- Mullins et al., 1994.↵
- Myers, 1985.↵
- Myers et al., 1986.↵
- O'Brien et al., 2009.↵
- O'Daly and Imaeda, 1967.↵
- Peri and Nüsslein-Volhard, 2008.↵
- Perrin et al., 2005.↵
- Perry and Brown, 1992.↵
- Perry et al., 1987.↵
- Perry et al., 1990.↵
- Peters and Muir, 1959.↵
- Raff et al., 2002.↵
- Reimer et al., 2009.↵
- Rhodes et al., 2005.↵
- Schlaepfer and Myers, 1973.↵
- Shamash et al., 2002.↵
- Siebert et al., 2000.↵
- Stoll et al., 1989a.↵
- Stoll et al., 1989b.↵
- Subang and Richardson, 1999.↵
- Thermes et al., 2002.↵
- Toews et al., 1998.↵
- Tofaris et al., 2002.↵
- van Raamsdonk et al., 1998.↵
- Vargas and Barres, 2007.↵
- Waller, 1849.↵
- Wang et al., 2001.↵
- Westerfield and Eisen, 1988.↵
- Westerfield et al., 1986.↵
- Wyatt et al., 2010.↵
- Zhang et al., 2004.↵


