

Abstract
Classical blink conditioning is a well known model for studying neural generation of acquired motor responses. The acquisition of this type of associative learning has been related to many cortical, subcortical, and cerebellar structures. However, until now, no one has studied the motor cortex (MC) and its possible role in classical eyeblink conditioning. We recorded in rabbits the activity of MC neurons during blink conditioning using a delay paradigm. Neurons were identified by their antidromic activation from facial nucleus (FN) or red nucleus (RN). For conditioning, we used a tone as a conditioned stimulus (CS) followed by an air puff as an unconditioned stimulus (US) that coterminated with it. Conditioned responses (CRs) were determined from the electromyographic activity of the orbicularis oculi muscle and/or from eyelid position recorded with the search coil technique. Type A neurons increased their discharge rates across conditioning sessions and reached peak firing during the CS–US interval, while type B cells presented a second peak during US presentation. Both of them project to the FN. Type C cells increased their firing across the CS–US interval, reaching peak values at the time of US presentation, and were activated from the RN. These three types of neurons fired well in advance of the beginning of CRs and changed with them. Reversible inactivation of the MC during conditioning evoked a decrease in learning curves and in the amplitude of CRs, while train stimulation of the MC simulated the profile and kinematics of conditioned blinks. In conclusion, MC neurons are involved in the acquisition and expression of CRs.
SIGNIFICANCE STATEMENT Classical blink conditioning is a popular experimental model for studying neural mechanisms underlying the acquisition of motor skills. The acquisition of this type of associative learning has been related to many cortical, subcortical, and cerebellar structures. However, until now, no one has studied the motor cortex (MC) and its possible role in classical eyeblink conditioning. Here, we report that the firing activities of MC neurons, recorded in behaving rabbits, are related to and preceded the initiation of conditioned blinks. MC neurons were identified as projecting to the red or facial nuclei and encoded the kinematics of conditioned eyelid responses. The timed stimulation of recording sites simulated the profile of conditioned blinks. MC neurons play a role in the acquisition and expression of these acquired motor responses.
Introduction
The classical conditioning of the nictitating membrane/eyelid responses is a well known experimental procedure for the study of brain sites involved in the acquisition and storage of new motor abilities, as well as of the neural mechanisms underlying these processes. Although cerebellar cortical and/or nuclear centers have traditionally been assumed to be related to the acquisition and/or performance of conditioned blinks (Welsh and Harvey, 1991; Krupa et al., 1993; Gruart et al., 2000b; Christian and Thompson, 2003; Koekkoek et al., 2003; Perciavalle et al., 2013), many other cerebral cortical and subcortical structures have been reported as involved as well in different aspects of acquisition, storage, retrieval, and extinction processes. Thus, the hippocampal circuit (Weiss et al., 1999; Múnera et al., 2001; Gruart et al., 2006), the medial prefrontal (Weible et al., 2003; Siegel and Mauk, 2013; Caro-Martín et al., 2015) and the somatosensory (Leal-Campanario et al., 2006; Ward et al., 2012) cortices, as well as subcortical structures, such as the striatum (Blazquez et al., 2002), the amygdalar complex (Boele et al., 2010; Sakamoto and Endo, 2010), some thalamic nuclei (Sears et al., 1996; Bahro et al., 1999; Campolattaro et al., 2007), and the red nucleus (RN; Haley et al., 1988; Sakamoto and Endo, 2010; Pacheco-Calderón et al., 2012), have been shown to participate in the generation of conditioned blinks. Recent proposals suggest the joint involvement of cerebellar (cortex, nuclei), cortical (hippocampal, prefrontal), and subcortical (amygdala, striatum) structures in the different aspects (cognitive, motor, associative strength, etc.) of classical blink conditioning (Siegel et al., 2015; Yang et al., 2015).
It is surprising that the above list of neural sites related to classical blink conditioning does not include the motor cortex (MC). In fact, few past (Aou et al., 1992; Birt et al., 2003) or recent (Hasan et al., 2013) studies have addressed the involvement of this key cortical structure in the acquisition of this particular type of associative learning. However, the MC has a well defined and repeated representation of facial muscles (Huang et al., 1988; Morecraft et al., 2001; Müri, 2016), and traditionally has been assumed to be one of the main neural sites involved in the acquisition and proper performance of new motor abilities (Evarts et al., 1983; Doyon and Benali, 2005; Monfils et al., 2005; Brecht et al., 2013; Gloor et al., 2015; Hayashi-Takagi et al., 2015; Kaufman et al., 2015). In fact, MC dynamic activities have been described as interacting with cerebellar and striatal contributions to different types of motor sequence learning (Houk et al., 1996; Hikosaka et al., 2002; Penhune and Steele, 2012; Santos et al., 2015).
In accordance with the above contentions, we assumed that the facial area of the MC should play a role in this type of associative learning. Using a delay paradigm to check this hypothesis, rabbits were prepared for the chronic recording of the electromyographic (EMG) activity of the left orbicularis oculi muscle (or the position of the ipsilateral upper eyelid) and of the unitary activity of antidromically identified contralateral MC pyramidal neurons during the classical conditioning of eyelid responses (Gruart et al., 2000a; Pacheco-Calderón et al., 2012). Collected results, including the firing properties of recorded MC neurons, the transient inactivation of the recorded MC area, the comparison between neuronal oscillatory properties and eyelid acceleration profiles, and the simulation of conditioned response (CR) kinematics by train stimulation, lead to the conclusion that the eyelid area of the MC is directly involved in the generation of classically conditioned eyelid responses.
Materials and Methods
Animals.
Experimental procedures were performed in adult male rabbits (New Zealand white albino) weighing 2.4–2.9 kg on arrival at the Animal House facilities of Pablo de Olavide University. Animals were obtained from an authorized supplier (Isoquimen). Rabbits were housed in individual cages for the whole experiment and kept on a 12/12 h light/dark cycle with constant ambient temperature (21 ± 1°C) and humidity (55 ± 7%). Food and water were available ad libitum. All experiments were performed in accordance with Spanish (BOE 34/11370-421, 2013) and European Union (2010/63/EU) guidelines for the use of laboratory animals in chronic experiments. In addition, these experiments were submitted to and approved by the local ethics committee of Pablo de Olavide University.
Surgery.
Animals were anesthetized with an intramuscular injection of a ketamine–xylazine mixture (Ketaminol, 100 mg/ml; Rompun, 20 mg/ml; and atropine sulfate, 0.5 mg/kg) at an initial dosage of 0.85 ml/kg. Anesthesia was maintained by intravenous perfusion at a flow rate of 10 ml/kg/h.
As illustrated in Figure 1, animals (n = 15) were prepared for the chronic recording of unitary activity in the MC during classical blink conditioning. A window (4 × 6 mm) was drilled through the parietal bone centered on the right MC (anteroposterior, 2 mm; lateral, 2 mm; Girgis and Shih-Chang, 1981) corresponding to the eyelid motor area (Pacheco-Calderón et al., 2012). A recording chamber was built with acrylic cement around the window. A sterile stainless steel needle (21 gauge) with a curved tip was fixed with dental cement to one corner of the recording chamber to serve as a stereotaxic reference. The dura mater was removed and the cortical surface was protected with sterile gauze and an inert plastic cover between recording sessions. A silver electrode (1 mm in diameter) in contact with the dura mater was attached to the left parietal bone as a ground for unitary recordings. These animals were also implanted with stimulating electrodes aimed at the ipsilateral RN (anteroposterior, 8.5 mm, lateral, 1.5 mm; depth, 13 mm from the cortex surface) and the contralateral facial nuclei (FN; anteroposterior, −18 mm; lateral, 3.5 mm; depth, 15–17 mm from the cerebellum surface). When necessary, the targeted areas were approached from anteroposterior or lateral angles. Stimulating electrodes were made with 200 μm varnished silver wire (California Fine Wire). The final position of these stimulating electrodes was determined by eyelid-closing movements evoked by a pair of pulses (1 ms interpulse interval) applied to the corresponding electrode. Finally, animals were implanted with bipolar hook electrodes in the left orbicularis oculi muscle to record their EMG activities. These electrodes were made from multistranded Teflon-coated stainless steel wire (A-M Systems) with a total external diameter of 230 μm and bared ≈1 mm at the tip. A head-holding system, consisting of three bolts cemented to the skull perpendicular to the stereotaxic plane, was also implanted. All stimulating and recording electrodes were connected to two sockets attached to the holding system.
A second group of animals (n = 6) was implanted (under the same anesthetic and sterile conditions) with guide cannulas in the MC (anteroposterior, 2 mm; lateral, 2 mm; depth, 0.5 mm from cortex surface). Guide cannulas were made from 21 gauge stainless steel needles. Each of these was protected by a removable 25 gauge stainless steel rod during noninjecting periods (Pacheco-Calderón et al., 2012). These animals were also implanted with the above-described EMG recording electrodes.
A third group of animals (n = 3) was implanted with stimulating electrodes in the MC (anteroposterior, 2 mm; lateral, 2 mm; depth, 1 mm from cortex surface). Stimulating electrodes were made with 200 μm varnished silver wire (California Fine Wire). Animals were also implanted with the above-described EMG recording electrodes and with a five-turn coil (2.5–3 mm diameter) into the center of the left upper eyelid close to the lid margin. Coils were made of Teflon-coated stainless steel wire (A-M Systems) with an external diameter of 50 μm and a weight of 10–15 mg (Gruart et al., 2000a).
A fourth group of animals (n = 3) was injected with the anterograde biotinylated dextran amine (BDA) tracer to label MC axonal projections terminating in the FN (Fig. 2). For this, and under the above anesthetic conditions, a hole (2 mm diameter) was drilled in the skull according to the MC coordinates (anteroposterior, 2 mm; lateral, 2 mm). The BDA tracer was injected with a 10 μl microsyringe (Hamilton). The tracer was injected at different depths (1–3 mm) from the cortex surface to a final amount of 3 μl, at a rate of 0.3 μl/min.
Recording and stimulating procedures.
Recording sessions began 2 weeks after surgery. Each rabbit was placed in a Perspex restrainer specially designed for limiting the animal's movements (Gruart et al., 2000a; Leal-Campanario et al., 2007). The box was placed on the recording table and was surrounded by a black cloth. The recording room was kept softly illuminated, and a 60 dB background white noise was switched on during the experiments. For all the subjects, the first two recording sessions consisted of adapting the rabbit to the restrainer and to the experimental conditions; no stimulus was presented during these two sessions.
The EMG activity of the orbicularis oculi muscle was recorded using Grass P511 differential amplifiers with a bandwidth of 0.1 Hz to 10 kHz (Grass-Telefactor). Neuronal unitary activity was recorded in the contralateral MC with the help of a NEX-1 preamplifier (Biomedical Engineering) and from there to a differential amplifier (AM 502, Tektronix). Unitary recordings were performed with glass micropipettes filled with 2 m NaCl (3–6 MΩ resistance) and filtered in a bandwidth of 1 Hz to 10 kHz. When necessary, field potentials were recorded with low-resistance electrodes (1–3 MΩ). The recording area was approached with the help of stereotaxic coordinates (Girgis and Shih-Chang, 1981), and antidromic or orthodromic (i.e., synaptic) field potentials were evoked by electrical stimulation of the FN or the RN. Criteria to determine whether the recorded and the activated neurons were the same, and to discriminate somatic versus axonic recordings, were systematically followed (Fig. 1D–F; Delgado-García et al., 1988; Gruart and Delgado-García, 1994). At the end of each recording session, the recording micropipette was removed and the recording chamber sterilized and closed with sterile gauze, bone wax, and an inert plastic cover.
In the third group of animals, eyelid movements were recorded with the magnetic search coil technique (C-N-C Engineering). Upper eyelid maximum angular displacements ranged from 30 to 40° for the three animals. For the sake of homogeneity, the gain of the recording system was adjusted to yield 1 V per 10°.
Electrical stimulation of the MCs, RN, and FN consisted of single or paired (cathodal, square, 50 μs, <500 μA pulses, 1–2 ms interval) pulses programmed with a CS-220 stimulator across an ISU-220 isolation unit (Cibertec). The MCs were also stimulated with 10 Hz (≤1 s) trains.
Drug microinjection.
Following a previous description (Pacheco-Calderón et al., 2012), a 5% solution of lidocaine (Sigma-Aldrich) was injected in the selected animals with the help of a calibrated injection tube (30 gauge). The injection tube was coupled to a 10 μl Hamilton syringe and was advanced through the guide tube. Control animals were injected with the vehicle (9% saline). Drug solutions were injected from 5 min before until the end of the conditioning session at a rate of 0.1 μl/min with the help of a microinfusion pump (310, KD Scientific).
Classical conditioning.
As described in detail previously (Leal-Campanario et al., 2007), classical conditioning of eyelid responses was achieved using a delay conditioning paradigm. A tone (600 Hz, 85 dB, 350 ms) was presented as conditioned stimulus (CS) and an air puff (3 kg/cm2, 100 ms) directed at the cornea was used as the unconditioned stimulus (US). The tone coterminated with the air puff. A function generator (AFG 3022B, Tektronix), triggered by a digital output (1401-plus, Cambridge Electric Design), was used to produce the pulse with the specific tone characteristics (600 Hz, sine wave, 1 V). An amplifier (PA Amplifier FS-2035, Fonestar Systems) converted the pulse to a tone (85 dB) by means of a loudspeaker located 80 cm in front of the animal's head. Air puffs were delivered from an air compressor (Biomedical Engineering) and applied through the opening of a plastic pipette (3 mm diameter) attached to a holder fixed to the recording table. Conditioning sessions consisted of 66 trials (6 series of 11 trials each). Successive trials were separated at random by intervals of 50–70 s. Of the 66 trials, six were test trials in which the CS was presented alone. Conditioning sessions lasted for ∼80 min. Animals in the first group were conditioned for 20 sessions, while animals in Groups 2 and 3 where conditioned for 10 sessions. Animals had to generate ≥80% of CRs for two successive conditioning sessions.
Histology.
For a proper identification of the recording sites, at the end of the recording sessions we performed small electrolytic lesions in selected places. Lesions were performed with the help of tungsten electrodes (1 MΩ resistance) using a direct current at 0.5–1 mA for 10–20 s. After all experimental sessions, animals were deeply anesthetized with sodium pentobarbital (50 mg/kg, i.p.) and perfused through the left ventricle with 9% saline followed by 4% paraformaldehyde in PBS (0.2 m), pH 7.4. The proper location of EMG recording and eyelid coil electrodes was then checked. Subsequently, brains were removed and preserved 24 h in 4% paraformaldehyde solution. Those brains aimed for immunohistochemistry were preserved only 2 h in the paraformaldehyde solution. Before tissue processing, brains were cryoprotected with 30% sucrose in 0.2 m PBS. Before the fixed tissue was cut, the brains had to descend completely to the bottom of the sucrose container. Brains destined for microscopic observation were cut into coronal sections (50 μm) with the aid of a sliding freezing microtome (SM2000R, Leica Biosystems). Collected slices were stored in 0.2 m PBS in successive series until used. Selected sections, including recording, stimulated, and cannula-implanted sites, were mounted on gelatinized glass slides and stained using the Nissl technique with 0.1% toluidine blue for proper identification of the recording and implanted sites (Fig. 1B,C).
Immunohistochemistry.
Brains for fluorescence immunohistochemistry were cryoprotected after perfusion with 30% sucrose in PBS. After descending to the bottom of the sucrose container, brains were cut in coronal sections (50 μm) with the help of a freezing microtome (SM2000R, Leica) and stored at −20°C in a solution of glycerol (30%) and ethylene glycol (30%) in PBS until used. Tissue was processed “free-floating” for immunohistochemistry. Collected sections passed through all procedures simultaneously to minimize differences in immunohistochemical staining. To better analyze MC projections to the FN, a double-labeling was performed using primary antibody against the enzyme choline acetyltransferase (ChAT; Millipore Iberica), which synthesizes acetylcholine and avidin against BDA (molecular weight, 10,000; Invitrogen), injected as described above.
In short, sections were incubated for 1 h with 10% normal donkey serum (NDS; Bio-Rad) in PBS with 0.2% Triton X-100 (Sigma-Aldrich) and then incubated overnight at room temperature with goat polyclonal IgG anti-ChAT (1:100) with PBS containing 0.2% Triton X-100 and 3% NDS. The second day, sections were washed and incubated for 1 h with anti-goat IgG secondary antibody generated in donkey and conjugated with Alexa 555 (1:200; Millipore Iberica) in PBS containing 0.2% Triton X-100 and 3% NDS, and subsequently incubated with avidin conjugated with Alexa 488 (1:200; Millipore Iberica). Finally, sections were mounted on slides and coverslipped using Prolong Gold antifade reagent fluorescent mounting medium (Millipore Iberica). Selected sections were observed under a confocal microscope (TCS SPE, Leica). Z-series of optical sections (1 μm apart) were obtained using the sequential scanning mode. These stacks were processed with ImageJ software (http://rsb.info.nih.gov/ij/).
Data collection and analysis.
Unitary activity and unrectified EMG activity of the orbicularis oculi muscle, and 1 V rectangular pulses corresponding to CS, US, air-puff, and electrical stimulations presented during the different experiments were stored digitally in a computer through an analog–digital converter (1401-plus, Cambridge Electric Design) for quantitative off-line analysis. Collected data were sampled at 25 kHz for unitary recordings or at 10 kHz for EMG and eyelid-position recordings, with an amplitude resolution of 12 bits. A computer program (Spike2, Cambridge Electric Design) was used to display single, overlapping, averaged, and raster representations of unitary activity; EMG activity of the orbicularis oculi muscle; and eyelid position, velocity, and acceleration.
As explained in detail previously (Domingo et al., 1997; Gruart et al., 2000a), velocity and acceleration traces were computed digitally as the first and second derivative of eyelid-position records, following low-pass filtering of the data (23 dB cutoff at 50 Hz and a zero gain at ≈100 Hz). The power of the spectral density function (i.e., the power spectrum) of selected data was calculated using a fast Fourier transform to determine the relative strength of the different frequencies present in eyelid movements. The power spectra of eyelid movements were calculated from the corresponding acceleration (Domingo et al., 1997; Gruart et al., 2000a). The spectral power of overlapped firing rate profiles collected from the three (A–C) types of neurons was calculated by fitting a waveform with the help of the equation f (t) = a0 cos(wt), where a0 is the mean value of the three dominant peaks in the averaged firing rates. Each waveform was calculated for the angular frequency w = 2π/T, where T is the average of the latency between the firing rate peaks with respect to the CS presentation. The value of T was determined following the analysis of recorded firing rate profiles (Caro-Martín et al., 2015).
In most cases, it was easy to identify the recorded MC neuron by isolating it from other neurons during experimental recording sessions. In cases where it was not possible to isolate and record a single cell, a spike sorting (Spike2, Cambridge Electric Design) was performed to classify the different recorded neurons. The spike-sorting analysis was performed off-line by creating a new wave-mark based on the raw neuronal recording. Amplitude and duration thresholds were adjusted to include all types of spikes while excluding the noise of the recording. The spike duration threshold was set at >0.5 ms and the amplitude threshold was set at >0.1 mV, depending on the noise level from each recording. Templates created by the spike-sorting program were meticulously examined and those presenting nonphysiological signals were eliminated. Finally, an event channel for each identified neuron was created in which each event corresponded to a spike. The program enabled the representation of peristimulus time histograms (PSTHs) and/or the firing rates of recorded neurons. When necessary, PSTHs were converted to firing rates following this equation (Rieke et al., 1997): firing rate (spikes/s) = (spikes per bin/repetitions) × (1000/bin size, in milliseconds). With the aid of cursors, the latency, the PSTHs, and the instantaneous firing rate of unitary recordings could be quantified.
Statistical analyses were performed using the SPSS package (SPSS), for a statistical significance level of P = 0.05. Unless otherwise indicated, mean values are followed by their SEM. When necessary, the Student's t test was used for the comparison between two independent means and the paired t test when related to the same measurements. The Mann–Whitney U test was used when the normality test (Shapiro–Wilk) failed in the independent data test. Regression and correlation analyses were performed using ≥100 measurements collected from ≥3 animals. Peaks of power spectra were tested with the χ2-distributed test for spectral density functions (Gruart et al., 2000a).
Results
Identification of recorded MC neurons
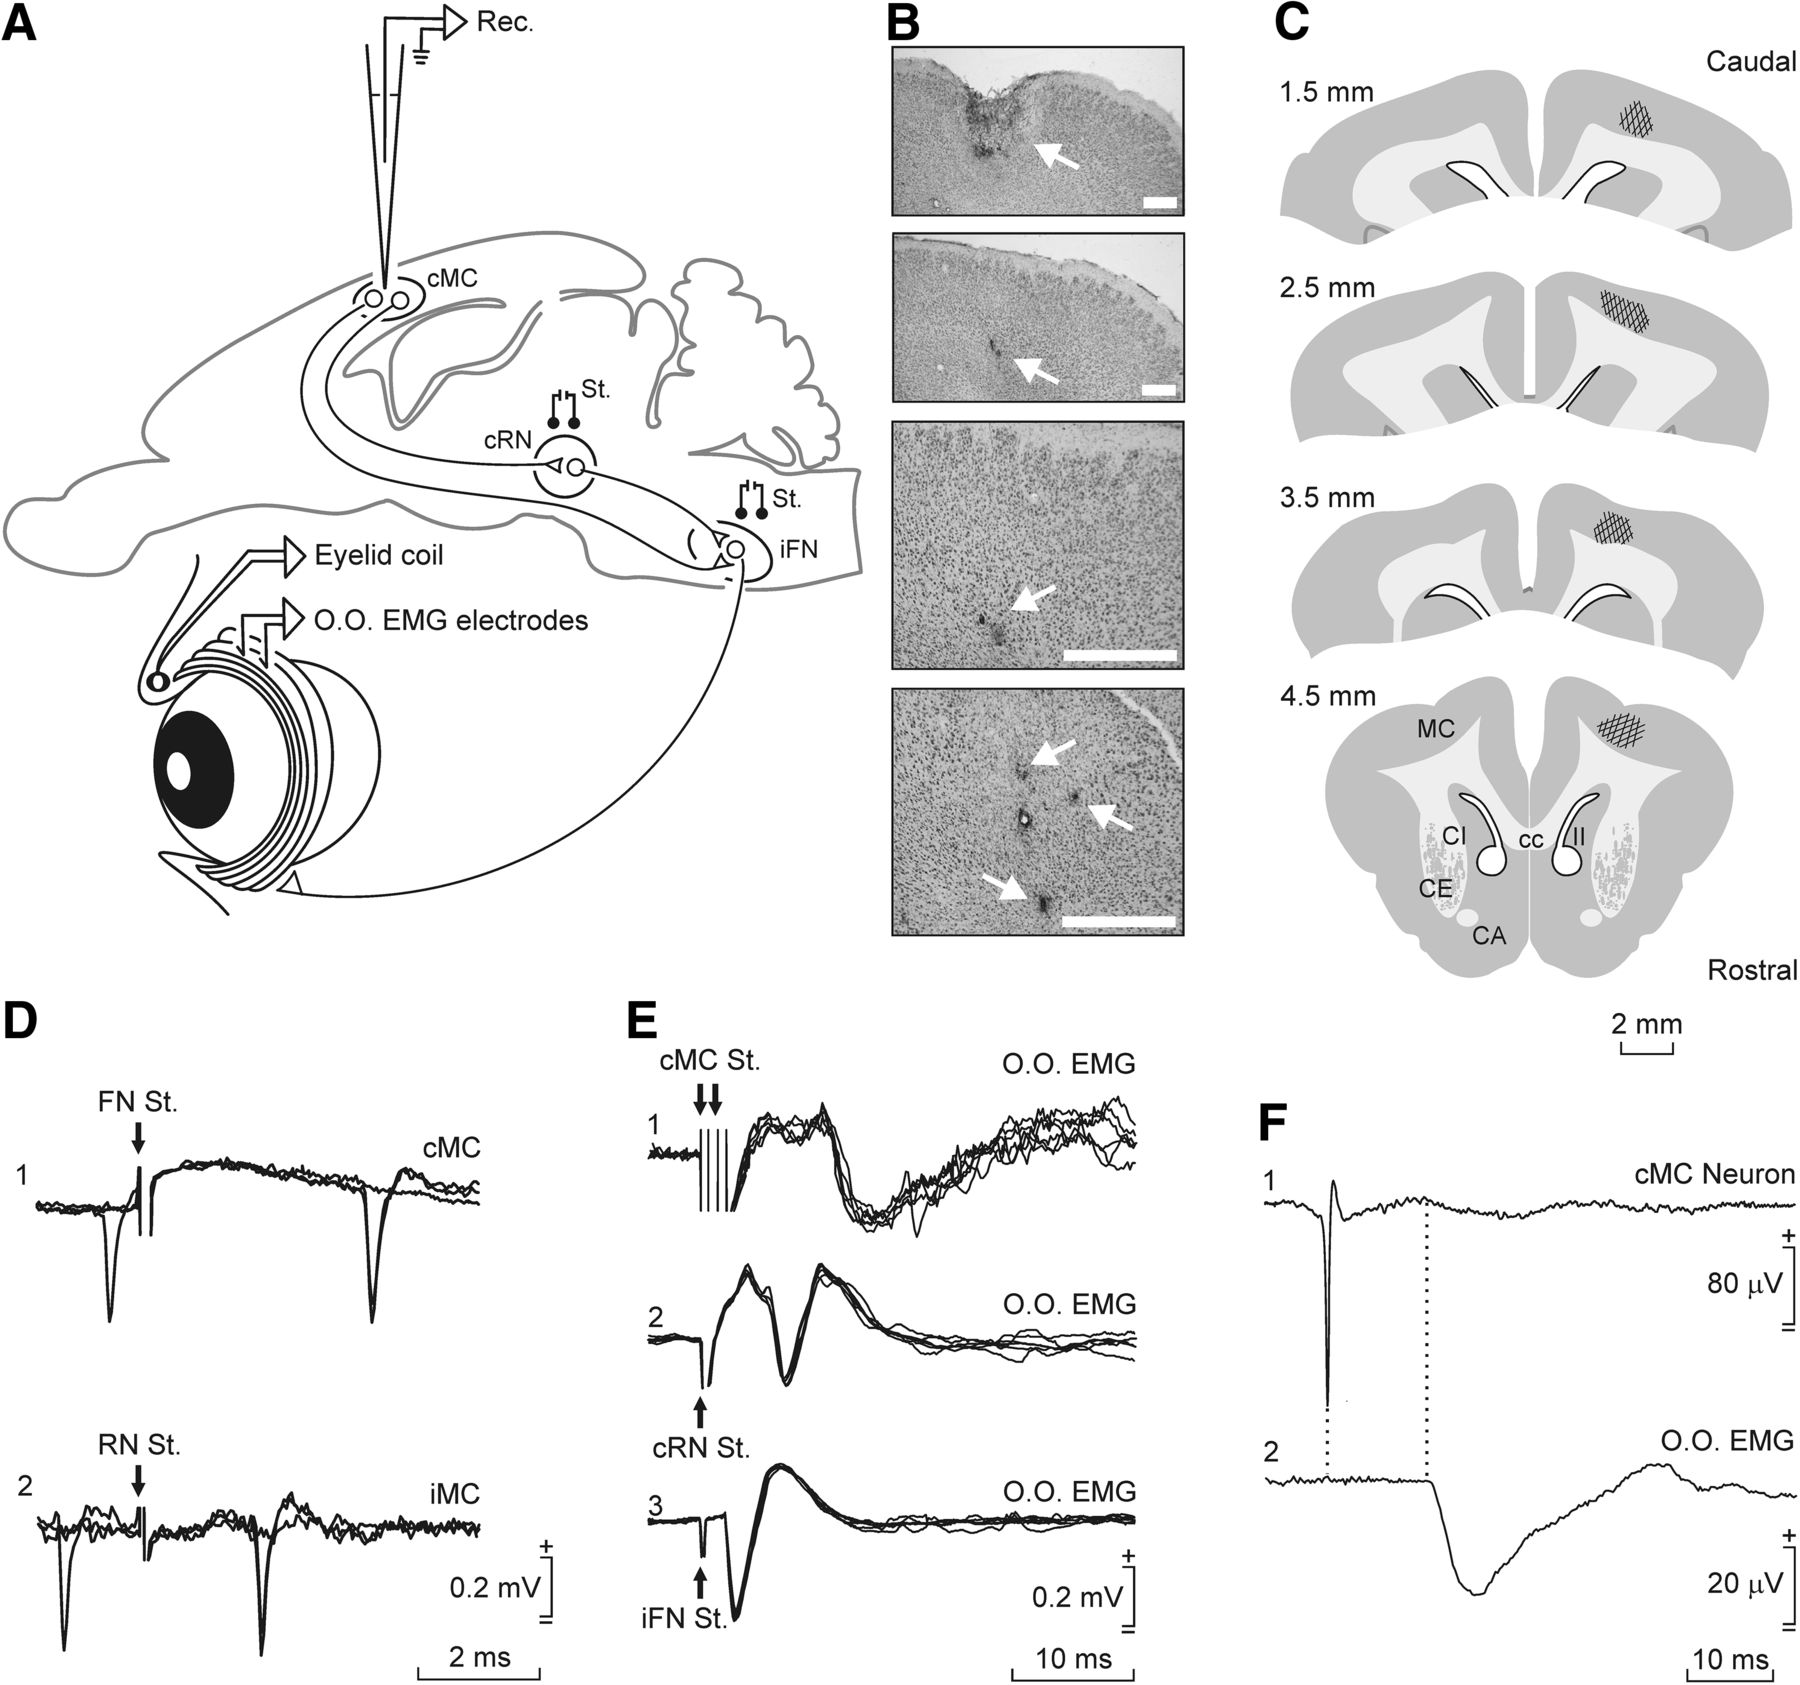
The MC eyelid recording area (Fig. 1B,C) was approached following a previous electrophysiological study (Pacheco-Calderón et al., 2012) and in accordance with available stereotaxic coordinates (Girgis and Shih-Chang, 1981). As illustrated in Figure 1, recorded neurons were identified by their antidromic activation from their projection sites (the contralateral FN or the ipsilateral RN) and with the help of the collision test (Fig. 1D). Mean activation latencies were 5.03 ± 0.18 ms (mean ± SEM; n = 25 neurons recorded from 5 animals; range: 2.02–6.63 ms) from the FN and 3.36 ± 0.09 (n = 189 neurons from 7 animals; range: 1.47–7.73 ms) from the RN. Additional support for the antidromic nature of spike activation was that it followed stimulation frequencies of ≤500 Hz (Trigo et al., 1999; Múnera et al., 2001; Pacheco-Calderón et al., 2012).

Experimental design and identification of recorded MC neurons. A, Diagram representing the experimental design. Rabbits were chronically implanted with EMG recording electrodes in the left orbicularis oculi muscle (O.O. EMG). In some animals, eyelid movements were recorded with the magnetic search coil technique. MC neurons contralateral (cMC) to the left eye were recorded (Rec.) with glass micropipettes inserted into the MC area. For proper identification, MC neurons were activated antidromically from the RN or the FN. B, Photomicrographs of MC coronal sections illustrating cannula implantation (top picture and arrow) and electrolytic marks (3 bottom pictures and arrows) made with stimulating metal microelectrodes implanted in selected recording sites. Calibration bars, 1 mm. C, Diagrams illustrating the recording sites following the atlas of Girgis and Shih-Chang (1981). D, Representative examples of the antidromic activation and collision tests of MC neurons from the FN (1) or the RN (2) at threshold-straddling intensities. Arrows indicate stimulus artifacts. E, From top to bottom are illustrated the EMG activity evoked in the O.O. muscle by double (2 ms interval) pulses applied to the cMC (1) and single pulses presented to the contralateral RN (cRN; 2) and the ipsilateral FN (iFN; 3). F, Spike-triggered extracellular activity recorded in the O.O. muscle (2). The triggering action potential corresponded to an identified cMC neuron (1). Average was repeated 1500 times.
As already reported (Pacheco-Calderón et al., 2012), the MC recording area selected in our study was clearly related to eyelid movements, because its stimulation evoked a short-latency (10.1 ± 0.3 ms; n = 20 measurements from 3 animals; range: 9.2–11.7 ms) activation of the EMG activity of the contralateral orbicularis oculi muscle. Taking into account the anatomical distance, the small variability in latency of muscle activation from the MC is suggestive of a disynaptic projection (Fig. 1E1). As expected, the stimulation of the RN evoked responses of a shorter latency (6.5 ± 0.6 ms; n = 20 measurements from 3 animals; range: 4.7–9.2 ms; Fig. 1E2) indicating the RN′s shorter distance to the recorded muscle. Finally, orbicularis oculi muscle activation from the FN took place in 2.3 ± 0.2 ms (n = 20 measurements from 3 animals; range: 1.7–2.5 ms; Fig. 1E3). The latency of spike-triggered averaged activities of orbicularis oculi muscle was 12.5 ± 0.4 ms (n = 15 measurements from 3 animals; range: 11.3–13.6 ms). These results further confirmed that MC neurons recorded and analyzed here project directly to the FN and have a disynaptic activation effect on the orbicularis oculi muscle (Fig. 1F).
Small electrolytic-lesion marks made at the end of the recording sessions indicated that MC neurons related to reflex, spontaneous, and conditioned eyelid responses occupied a dorsal position in the rostral part of the rabbit cortical motor area (Fig. 1B,C). With the help of these electrolytic marks and collected information regarding stereotaxic coordinates, we reconstructed the location of recorded MC neurons (n = 257) included in this study. Figure 1C illustrates that these neurons (types A–C; see below) formed a cell column (anteroposterior, 1.5–4.5 mm; lateral, 2–4 mm) over the dorsal MC (Girgis and Shih-Chang, 1981), i.e., the facial area of the MC is not located laterally like in cats or primates.
To further confirm that these MC neurons were involved in eyelid responses, we injected the anterograde BDA tracer in the MC recording area of three animals (Fig. 2A,B) and checked axon terminals located within the FN. For identification purposes, FN motoneurons (Mns) were labeled with ChAT (Fig. 2C,D,G). Confocal photomicrographs of BDA labeling showed the presence of relatively few anterogradely labeled axons near or closely apposed to ChAT-expressing FN Mns (Fig. 2E,F,H,I). Apart from the longer distance, the low density of MC axon terminals present in the FN could explain the low number of antidromic MC neurons activated from this nucleus (n = 25) compared with those activated from the RN (n = 189), corresponding to a much larger and denser projection (Davies et al., 1994; Horn et al., 2002; Miller and Gibson, 2009).
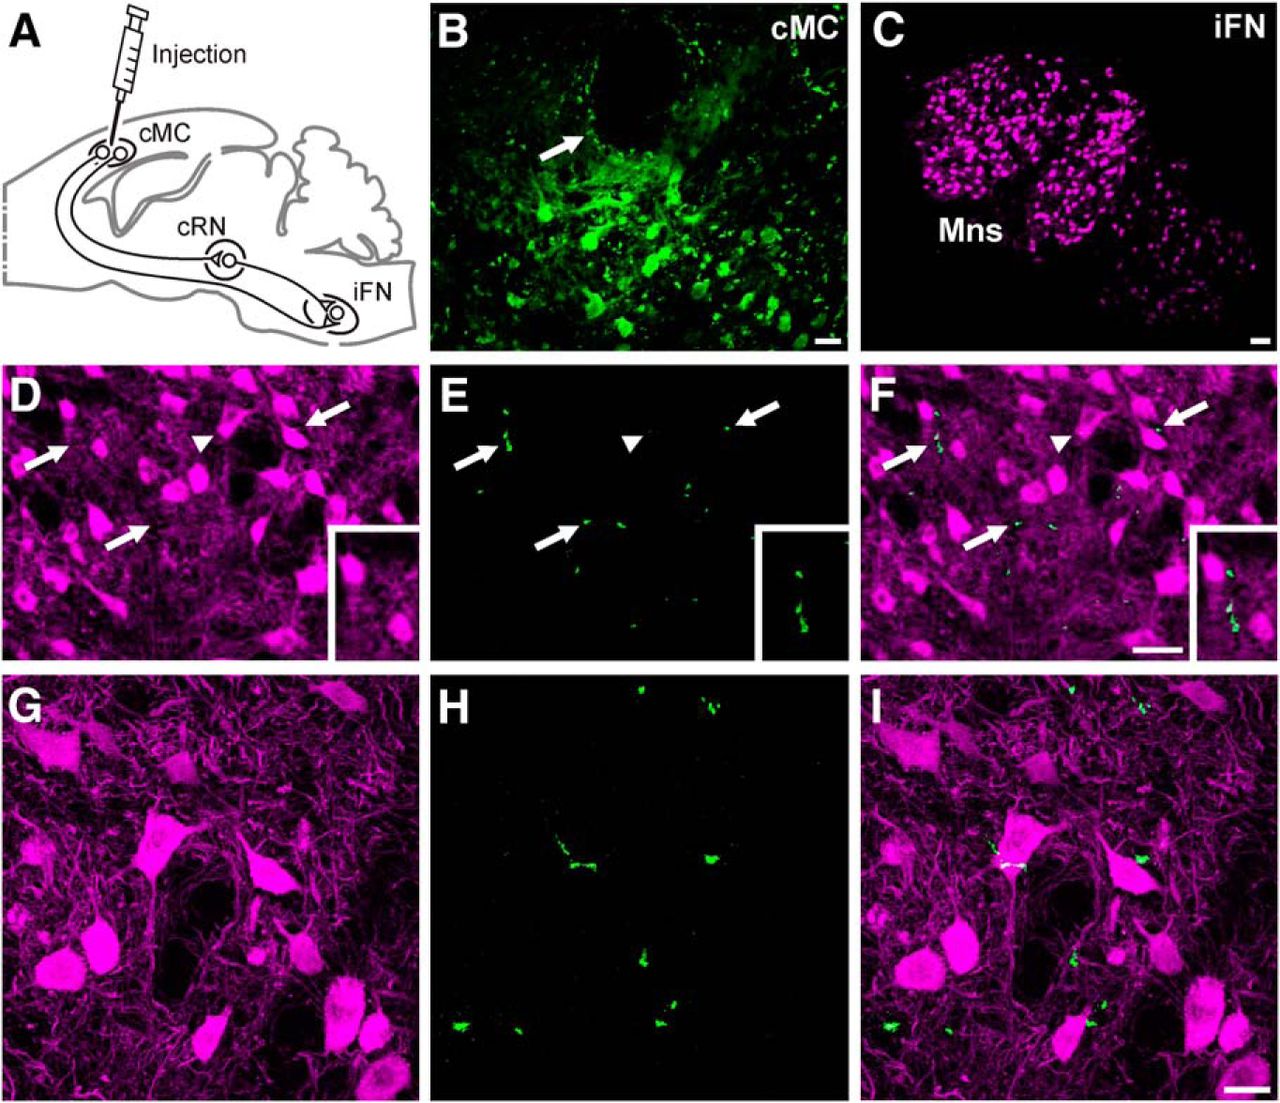
Confocal photomicrographs of BDA-labeled and ChAT-expressing cells. A, Diagram of BDA tracer injection in the MC. B, BDA-labeled cells located in the MC near the injection site (arrow). Scale bar, 30 μm. The photomicrograph is a 2D projection of 24 consecutive focal planes located 1 μm apart. C, FN Mns expressing ChAT. Scale bar, 100 μm. D–F, ChAT-expressing FN Mns (magenta) and fibers labeled with BDA (green). Arrows indicate axons anterogradely labeled with BDA. Scale bar: (in F) D–F, 50 μm. Insets in D–F are enlarged (30%) views of labeled FN Mns and MC projecting axons. Photomicrographs are 2D projections of 29 consecutive focal planes located 1 μm apart. G–I, Same ChAT-expressing cells indicated in D–F with arrowheads. Note the axons anterogradely labeled with BDA near or closely apposed to ChAT-expressing FN Mns. Scale bar: (in I) G–I, 25 μm. Photomicrographs are 2D projections of 22 consecutive focal planes located 0.5 μm apart.
Firing properties of MC neurons during classical conditioning of eyelid responses
In addition to two preliminary recording sessions in the absence of conditioning stimuli, performed to adapt animals to the recording setup, MC neurons were recorded during the two habituation and the successive (≤20) conditioning sessions. The experimental design for unitary recording during classical blink conditioning is shown in Figure 3A, while the learning curve corresponding to 10 animals recorded for two habituation and 20 conditioning sessions is represented in Figure 3B. Although animals reached the selected criterion by the seventh or eighth conditioning session, training was maintained for 12 additional days. In this way, we recorded the activity of MC neurons both during the acquisition process and when the learning curve reached asymptotic values.

Firing activities of MC neurons during classical blink conditioning using a delay conditioning paradigm. A, For conditioning, animals were presented with a tone (600 Hz, 85 dB, 350 ms) as CS and with an air puff (3 kg/cm2, 100 ms) presented to the left cornea as US. The CS coterminated with the US. CRs were recorded with the help of chronically implanted orbicularis oculi (O.O.) EMG electrodes. Contralateral MC neurons (cMC) were recorded (Rec.) across conditioning sessions with glass microelectrodes. B, Evolution of the percentage of CRs across conditioning sessions. Note that animals (n = 10) reached the selected criterion by the seventh or eighth conditioning sessions. MC neurons were recorded during the acquisition process and for >10 sessions after the selected criterion was reached. C, Typical responses of MC neurons (classified as types B and C) to air puff (20 ms, 3 kg/cm2) presentations (left) and during performance of a spontaneous blink. Note the different latencies and time scales. D, Representative example of the firing activity of an MC neuron recorded during a session from a well trained animal. From top to bottom are represented the conditioning paradigm (CS and US presentations), the firing activity of the MC neuron and the EMG activity of the O.O. muscle for a single trial, the raster plot of >60 successive trials, the averaged firing rate, and the rectified EMG activity of the contralateral O.O. muscle. Note that the activation of the MC neuron substantially (>70 ms) preceded the beginning of the eyelid CR.
The firing rates of MC neurons during air-puff-evoked reflex blinks were quite different from those during spontaneous blinks (Fig. 3C). The main difference was that MC neurons classified as types B and C (see below) increased their firing frequency after (25.3 ± 8 ms; n = 32 neurons collected from 7 animals; range: 5–55 ms) the beginning of the evoked reflex blink, but before (150.5 ± 40 ms; n = 32 neurons from 7 animals; range: 70–210 ms) the beginning of spontaneous blinks presented by unconditioned animals. Neurons classified as type A (n = 11 neurons from 6 animals) did not fire during air-puff-evoked reflex blinks, but they fired before (95.7 ± 32 ms; range: 57–112 ms) the beginning of spontaneous blinks.
Figure 3D shows a typical MC neuron recorded from a well trained animal (15th recording session). This neuron was recorded during a complete conditioning session. Interestingly, the cell was activated ≈60 ms following CS presentation, and its activation preceded the beginning of the CR (as determined from rectified EMG recordings) by ≈70 ms. The averaged firing rate of the neuron increased steadily from its early activation until reaching a peak firing of ≈95 spikes/s at the time of US presentation. Although this neuron was not identified by antidromic activation, its spike amplitude (1.7 mV) and duration (>0.5 ms), and its spontaneous firing (≈25 spikes/s) meant that it could be classified as a pyramidal cell (Swadlow et al., 1998; Beloozerova et al., 2003). Because of its characteristic double-peak activation during the CS–US interval and following US presentation, this neuron was classified as a type B neuron (see below).
Types of MC neurons related to classical blink conditioning
Recorded neurons were classified in three different groups (A–C), depending on their antidromic activation from the FN or the RN, their spontaneous firing, and their firing during the CS–US interval (Fig. 4).

Different types of MC neurons activated during classical blink conditioning with a delay paradigm. A, B, Firing properties of type A neurons. A, From top to bottom are illustrated the conditioning paradigm, the raw activity of a representative type A neuron, the event channel and firing rate of the selected neuron, and the raw EMG activity of the orbicularis oculi (O.O.) muscle during a single CS–US presentation. B, Conditioning paradigm, raster plot of all spikes collected from the same MC neuron during 15 successive trials, and the averaged firing rate. Type A MC neurons were characterized by an increased firing rate before the CR and a noticeable decrease of their firing rates during US presentation. C, D, Same as in A and B for a representative type B MC neuron recorded for 26 trials. Type B neurons were characterized by an initial firing peak preceding the CR and by a second increase of firing rate during US presentation. E, F, Same as in A and B for a representative type C MC neuron recorded for 53 trials. Type C neurons were characterized by a continuous increase in their firing rates preceding the CR and by reaching the maximum peak during US presentation. Time calibration in E is also for A and C. Time calibration in F is also for B and D.
Type A neurons (Figs. 4A,B, 5A) presented action potentials lasting >0.5 ms, and an irregular spontaneous firing rate, with mean values ranging from 3 to 15 spikes/s. To determine whether type A neurons were activated by CS-alone presentations, we compared their integrated activity during the 250 ms preceding versus the 250 ms following CS presentations. Indeed, type A neurons were not significantly (t(21,0.05) = −1.423; p = 0.17; n = 11 neurons from 8 animals) activated during CS-alone presentations—that is, during the two habituation sessions. As illustrated in Figure 4A, type A neurons fired a burst of action potentials preceding (50–90 ms) the EMG activation of the orbicularis oculi muscle during the CS–US interval—i.e., during the generation of the CR. Characteristically, the peak firing of type A neurons took place during the CS–US interval, reaching not very high (20–30 spikes/s) peak firing rates (Figs. 4B, 5A). Their firing rates decreased steadily during US presentation until reaching (irregular) tonic firing 0.2–0.3 s afterward. The averaged firing rates of 11 type A neurons recorded from well trained animals (i.e., from the 9th to the 20th conditioning session) are illustrated in Figure 5A. In this situation, the averaged population of type A neurons was activated at ≈70 ms following CS presentation and preceded the beginning of the CR by ≈95 ms. The averaged peak firing rate of type A neurons took place at ≈200 ms from CS presentation. A total of 23 neurons recorded from eight animals were included in this group, 52% of them (i.e., 12 neurons) being activated antidromically from the FN. No neuron included in this group was activated antidromically from the RN.

Averaged firing rates of representative type A–C MC neurons recorded from well conditioned animals. All recordings were performed after the eighth conditioning session. The averaged firing rates are represented as mean values ± SEM (bin size, 20 ms). A, From top to bottom are illustrated the conditioning paradigm, the averaged firing rate of selected (n = 11) type A neurons, and the average of the rectified EMG responses of the orbicularis oculi (O.O.) muscle. Note that their peak firing rates occurred before US presentation and that they did not respond during the unconditioned response. B, Averaged firing rates and rectified EMG responses collected from n = 15 type B neurons. These MC neurons were characterized by the presence of an initial peak in their firing rates before the CR and then by a second increase of their firing rates during the US. C, Same than as in A for selected (n = 17) type C neurons. These MC neurons presented a continuous increase in their firing rates beginning well before (>90 ms) the start of CRs and reaching the maximum during US presentation—i.e., during the generation of the unconditioned eyelid response.
Type B neurons (Figs. 3D, 4C,D, 5B) presented action potentials lasting >0.5 ms, but with a more stable and higher (10–20 spikes/s) spontaneous firing rate than type A cells. Type B neurons were not activated (t(29,0.05) = −1.336; p = 0.19; n = 15 neurons from 7 animals) during habituation sessions. As illustrated in Figures 3D, 4C,D, and 5B, this type of neuron presented two successive bursts of action potentials: one during the CS–US interval (20–40 spikes/s) and the other immediately following US presentation (25–75 spikes/s). Their firing decreased slowly after the end of the US, reaching a spontaneous firing rate of >0.5 s thereafter. The averaged firing rates of 15 type B neurons recorded from seven well trained animals are illustrated in Figure 5B. In this case, the averaged population of type B neurons was activated at ≈50 ms following CS presentation and preceded the beginning of the CR by ≈110 ms. The averaged peak firing rate of type B neurons took place at ≈130 ms from the CS presentation. A total of 28 neurons recorded from nine animals were included in this group, 46.4% of them (i.e., 13 neurons) being activated antidromically from the FN. No neuron included in this group was activated antidromically from the RN.
Finally, type C neurons (Figs. 4E,F, 5C) also presented action potentials lasting >0.5 ms, and a spontaneous firing rate similar (10–20 spikes/s) to that presented by type B neurons. Like types A and B, type C neurons did not modify their firing (t(29,0.05) = −1.171; p = 0.23; n = 17 neurons from 7 animals) following CS-alone presentations during the two habituation sessions. MC neurons included in this group presented a slow increase in their firing rates during the CS–US interval, reaching their peak firing (30–50 spikes/s) by the time of the US presentation (Figs. 4E,F, 5C). During CS-alone presentations in well trained animals, it was observed that the firing of type C neurons reached a peak rate for the time corresponding to the US presentation. Nevertheless, and as already indicated (Fig. 3C), type C neurons also fired following US-alone presentations. Like type B neurons, their firing decreased slowly after the end of the US presentation and remained above their mean spontaneous discharge rates for >0.5 s. The averaged firing rates of 17 type C neurons recorded from well trained animals are represented in Figure 5C. As shown, the averaged population of type C neurons was activated at ≈70 ms following CS presentation and preceded the beginning of the CR by ≈90 ms. The averaged peak firing rate of type B neurons took place at ≈310 ms from the CS presentation. A total of 37 neurons were included in group C, 20 (i.e., 54%) of them being activated antidromically from the RN. In this case, no neuron included in this group was activated antidromically from the FN. It is important to point out that although 189 neurons were activated antidromically from the RN, only 20 of them (i.e., 10.5%) presented a firing rate related to conditioned eyelid responses.
On the whole, these results indicate that the three types of MC neurons described here are activated during the CS–US interval well in advance of the initiation of the EMG activity of the orbicularis oculi muscle—i.e., of the CR. In addition, there is some specificity in the motor commands sent by MC neurons to the RN and to the FN.
Changes in the activity of MC neurons during the acquisition process of conditioned eyelid responses
Figure 3B illustrates the mean learning curve of classically conditioned animals (n = 10). As already described in preceding studies using similar conditioning protocols and training paradigms (Gruart et al., 2000a; Leal-Campanario et al., 2007; Pacheco-Calderón et al., 2012), conditioned animals started to generate CRs by the third to fourth conditioning session and reached the selected criterion by the seventh to eighth session. In our case, the mean rate of CRs was maintained at >80% from the eighth to the 20th conditioning sessions. As shown above, the three types of MC neurons reported here presented stable values in their latency to CS presentation and in the start of CRs, as well as regarding their mean firing profiles.
However, we also wanted to know the putative relationships between the discharge rates of MC neurons during the acquisition process—i.e., during the first eight conditioning sessions. For this, and as illustrated in Figure 6A–D, we selected the firing profiles of type A–C neurons recorded during these early conditioning sessions (Fig. 6A), together with the rectified EMG activities of the orbicularis oculi muscle collected during the corresponding sessions and trials (Fig. 6B). As shown in Figure 6A,B, both firing profiles and rectified EMG profiles decreased in latency across the successive conditioning sessions. A linear analysis of the collected data (n ≥ 10 neurons recorded from ≥100 trials and collected from 6 animals) indicates that there was a significant relationship between the decrease in the latency to CS presentation (in milliseconds) of recorded type A (y = 94.8 + 1.2x; r(9,0.05) = 0.67; p = 0.025), B (y = 137.3 + 0.4x; r(12,0.05) = 0.57; p = 0.033), and C (y = 31.2 + 1.5x; r(9,0.05) = 0.72; p = 0.012) neurons and the corresponding latencies for rectified EMG responses (in milliseconds; Fig. 6E).

Relationships between changes in firing rates for type A–C neurons and the increase in CRs across conditioning sessions. Analyses were performed for data collected from the third to the seventh conditioning sessions. A, Profiles of firing rates collected from representative type A neurons (inset) across the acquisition process corresponding to the CS–US interval, as indicated in blue. B, Profiles of CRs collected during the conditioning sessions corresponding to data illustrated in A. For A and B, the increase in color intensity indicates the recording order across training. C, Representation of the area of a firing response during the CS–US interval. D, Representation of the area corresponding to the rectified activity of the orbicularis oculi (O.O.) muscle collected during the recording trials for the averaged firing rate illustrated in C. E, Linear relationships between the latency of neuronal responses to CS presentations versus the latency of the conditioned eyelid responses to CS presentations. Note that the three types of MC neurons presented similar relationships with the latency of CRs. F, Linear relationships between integrated neuronal responses during the CS–US interval and the integrated EMG activity of the O.O. muscle corresponding to CRs. The length of the regression lines was restricted to the collected values.
We also quantified the area below these profiles corresponding to the CS–US intervals (Fig. 6C,D). In this regard, an attempt was made to determine the linear relationships between the two variables included in Figure 6C,D—namely, the integrated firing profile area and the integrated EMG amplitude during the CS–US interval. As already reported, eyelid position can be precisely determined from the integral of the rectified activity of the orbicularis oculi muscle (Gruart et al., 1995). A representation (Fig. 6F) of integrated neural responses [in (spikes/s) × s] versus integrated EMG responses (in mV × s) from six animals demonstrated the presence of linear relationships between the firing rates of type A (y = 0.74 + 0.13×; r(10,0.05) = 0.6; p = 0.04), B (y = −0.77 + 0.5×; r(13,0.05) = 0.8; p = 0.0003), and C (y = 4.04 + 1.3×; r(9,0.05) = 0.78; p = 0.005) neurons and the corresponding CRs collected during the same trials and sessions. It is interesting to note that, contrary to values collected for type B and C neurons (0.5 and 1.3 slopes, respectively), type A neurons presented a low slope (0.13) for the linear relationships between integrated neural responses and integrated EMG amplitudes.
In contrast, the three types of neurons presented similar slopes (4.8–6.1; r ≤ 0.6; p ≥ 0.13) when their integrated neural responses were plotted against the acquisition curve for the initial eight conditioning sessions (not illustrated). These data suggest that while type A neurons were more related to the learning curve than to eyelid performance during CS–US presentations, the other two types of MC neurons were related to both (learning curve and integrated EMG activity). Together, these results indicate that MC neurons are significantly related to the acquisition of classically conditioned eyelid responses.
Effects of acute inactivation of the MC on already acquired CRs
In an additional series of experiments, we studied the effects of MC transient inactivation on the acquisition of CRs (Fig. 7A–D) in controls (vehicle-injected) and experimental (lidocaine-injected) animals (n = 3 per group). Lidocaine infusion in the MC of conditioned animals (fourth and fifth training sessions; n = 6 measurements collected from three animals/group) significantly (t(10,0.05) = 10.964; p = 0.001) reduced the percentage of CRs (from 85 ± 3% to 42 ± 2.5%; Fig. 7C). The rectified and averaged (n = 66 trials/session) EMG activity of the orbicularis oculi muscle corresponding to vehicle-injected and lidocaine-injected animals during the fifth conditioning session is illustrated in Figure 7A,B. In accordance with the illustrated data (fourth and fifth training sessions; n = 6 measurements from 3 animals/group; Fig. 7D), lidocaine injection also significantly reduced the amplitude of CRs (by ∼70%, t(10,0.05) = 4.321; p = 0.002), with a lesser effect on the performance of the unconditioned responses (by ∼35%, t(10,0.05) = 2.276; p = 0.046). As already suggested in a previous study (Pacheco-Calderón et al., 2012) using similar lidocaine injections, these results further indicate that the MC plays a significant role in the immediate generation of classically conditioned eyelid responses, affecting both their acquisition and performance. In addition, it could be suggested that the MC could provide a general facilitatory tone to the system, affecting more directly conditioned versus unconditioned eyelid responses, because of the stronger nature of the reflex blinks.

Effects of the chemical inactivation or the electrical stimulation of the MC on the generation and kinematics of CRs. A–D, The contralateral MC was perfused with lidocaine (5% solution at a rate of 0.1 μl/min) or control (vehicle injection at the same rate). Three animals per group were injected. Note that lidocaine inactivation of the contralateral MC significantly decreased the percentage of CRs (C) and the integrated amplitude of both CRs and unconditioned responses (UR; D). *p = 0.046; **p = 0.002; ***p = 0.001. E–G, Representative examples of CRs recorded across successive conditioning sessions. Eyelid movements were recorded with the magnetic search coil technique. Note the wave nature of conditioned eyelid responses, and that the number of downward waves increased across conditioning (1, third session; 2, sixth session; 3, eighth session). Note also in F that the spectral power of CR profiles (n = 60) recorded during the same conditioning sessions increased with the number of waves, at ≈10 Hz. The inset in F illustrates spectral powers obtained from the averaged profiles of the firing rates of A–C neurons collected from six animals from the eighth to the 20th conditioning sessions. G, Effects of the electrical stimulation of the contralateral MC on the EMG activity of the orbicularis oculi (O.O.) muscle and on eyelid position. The MC was stimulated with an increasing number of paired pulses (1 ms interpulse interval) at a frequency of 10 Hz. Note how similar the evoked eyelid responses were compared to those presented by actual CRs—i.e., both of them presented a similar ramp-like wavy profile.
Oscillatory properties of MC neurons compared with those of CRs
An attempt was made to determine whether the firing profiles of identified MC neurons presented oscillatory properties similar to those reported for eyelid CRs. As previously reported (Gruart et al., 2000a; Caro-Martín et al., 2015) and additionally illustrated in Figure 7E–G, eyelid CRs in behaving rabbits consist of a ramp-downward displacement of the upper eyelid formed by successive waves or sags with a dominant frequency of ≈10 Hz. Although the number of waves composing CR profiles increased with the successive conditioning sessions—thereby increasing the duration of the CR (Fig. 7E)—the dominant frequency of these wavy components did not change with training (Fig. 7F). In addition, and following procedures described previously (Caro-Martín et al., 2015), we calculated the spectral power of overlapped firing-rate profiles collected from the three (A–C) types of neurons. Firing rate profiles were collected from six well trained animals, i.e., from the eighth to the 20th conditioning sessions. Indeed, and as indicated above, the three types of neurons described here presented peak firing rates of significantly different intervals with respect to CS presentation. As illustrated in the inset of Figure 7F, the averaged firing-rate profiles of the three types of neurons described in this study presented a dominant frequency of 11.3 ± 0.7 Hz, i.e., very close to that presented by eyelid CRs. Finally, we compared the usual profiles of eyelid CRs recorded using the magnetic search coil technique with those evoked by train stimulation of the MC eyelid area. As illustrated in Figure 7G, the electrical stimulation of the contralateral MC (n = 3 animals) at the same frequency (10 Hz) perfectly simulates the profile and kinematics of eyelid CRs. For example, the amplitude of downward eyelid sags evoked by each single stimulus presented to the MC (median, 2.5°; range, 1.75–9°) was similar (U(60,60,0.05) = 1545.5; p = 0.182) to the amplitude recorded during actual CRs (median, 3.75°; range, 0.62–11.25°). In addition, peak amplitude (19.67 ± 0.803°; n = 6 measurements from 3 animals; range, 17–22°) of train-evoked eyelid responses and that presented by CRs (20.5 ± 0.764°; ± n = 6 measurements from 3 animals; range, 18–23°) were also similar (t(10,0.05) = −0.752; p = 0.469). Thus, it can be concluded that the electrical train stimulation of the MC can generate CRs similar to those that are naturally evoked.
Discussion
Main findings of the present study
In accordance with the present results, the firing activities of identified MC neurons are related to the generation and profiles of eyelid CRs. Recorded neurons were classified as three different types (A–C) depending on the projection sites (FN, RN), activation profiles, and linear relationships with the latency and integrated amplitude of evoked CRs. Importantly, the firing of the three types of MC neurons started during the CS–US interval well in advance (≥90 ms) of the beginning of CRs. Type A neurons increased their discharge rates across conditioning sessions during the CS–US interval and reached peak firing during the CS–US interval, while type B cells presented a second peak during US presentations. Both of them were activated antidromically from the FN and modified their latency with the corresponding changes in latency of CRs across the successive conditioning sessions, but presented a low modulation of their firing rates (mainly type A) in relation to changes in the integrated amplitude of evoked CRs. In contrast, type C cells increased their firing rate across the CS–US interval, reaching peak values at the time of US presentation, and were activated from the RN. Type C cells modified their activation latency and their firing rates in relation to the changes in latency and integrated amplitude of CRs across training. The reversible inactivation of the facial MC area during conditioning evoked a significant reduction in the percentage and in the integrated amplitude of CRs, with a lesser effect on unconditioned responses. In contrast, train (10 Hz) stimulation of the MC simulated the profile and kinematics of CRs recorded with the magnetic search coil technique. In conclusion, results reported here clearly indicate the direct involvement of MC neurons in the acquisition and performance of eyelid CRs.
MC control of orbicularis oculi Mns
The intrinsic organization, within the FN, of the different groups of Mns innervating facial muscles is well preserved across mammals (Morecraft et al., 2001; Sherwood, 2005). In particular, orbicularis oculi Mns occupy preferentially the dorsolateral subdivision of the nucleus in primates (Morecraft et al., 2001), cats (Shaw and Baker, 1985), rabbits (Furutani et al., 2004), and rats (Martin and Lodge, 1977; Furutani et al., 2004). At the same time, facial muscles have distributed and repeated representations in different MC areas (Morecraft et al., 2001; Müri, 2016). Although it has been suggested that direct descending projections from the MC in the FN are present only in catarrhine primates, in relation to their enhanced facial expressions (Sherwood, 2005), the present results indicated the presence of a relatively low projection of MC neurons into the orbicularis oculi subdivision of the FN in the rabbit. In this regard, Grinevich et al. (2005) described in rats a more definite monosynaptic pathway from the vibrissa MC to facial Mns. Although MC projections to orbicularis oculi Mns in rabbits did not appear as dense as the one described for vibrissa Mns in the rat, the effects of MC stimulations on the EMG activity of the orbicularis muscle (Fig. 1E1) and the results collected from the MC spike-triggered activity (Fig. 1F) indicate the presence of effective postsynaptic effects of MC projecting neurons on orbicularis oculi Mns. Fanardjian and Manvelyan (1987) reported similar findings in acute electrophysiological experiments performed in anesthetized cats. As reported here, type A and B neurons started firing well in advance (≈95 and ≈110 ms, respectively) of the initiation of CRs. In contrast, identified orbicularis oculi Mns start their firing ≈2 ms before the initiation of the EMG activity of the innervated muscle (Trigo et al., 1999). These differences are suggestive of a slowly building depolarization of facial Mns preceding their firing during the generation of eyelid CRs. A comparison between the short latencies in the activation of facial Mns during the corneal reflex (Baker et al., 1980; Shaw and Baker, 1985; Trigo et al., 1999) and the long latencies for MC activation of orbicularis oculi Mns (present results) is suggestive of somatic projections of second-order trigeminal neurons versus distal dendritic projections of MC neurons on these Mns. This proposal is supported by acute electrophysiological experiments performed in anesthetized cats (Fanardjian et al., 1983; Fanardjian and Manvelyan, 1987). In addition, the different depolarization profiles and the strength of activation of facial Mns during the corneal reflex and during CRs (Trigo et al., 1999) explain at least in part the different profiles and kinematics of reflex versus conditioned eyelid responses (Trigo et al., 1999; Gruart et al., 2000a).
MC commands also reach the FN across cortical projections to the RN (Miller and Gibson, 2009). In fact, type C neurons described here seem to project to the RN and carry motor command signals preferentially related to the performance of CRs, along with other eyelid motor behaviors, a characteristic also present in RN neurons projecting to the FN (Pacheco-Calderón et al., 2012). Finally, it is well known that the MC also sends descending projections to the cerebellum via pontine nuclei (Brodal, 1987; Kosinski et al., 1988), a fact already taken into consideration in previous studies on classical blink conditioning (Ivkovich and Thompson, 1997). It should be noticed here that this important and massive projection reaches the cerebellum, providing an efference copy of cortical motor commands (Holst and Mittelstaedt, 1950; Sperry, 1950). Feedback projections from cerebellar nuclei to different cortical areas are then able to modulate those motor commands for a more proper performance of the aimed motor responses (Sánchez-Campusano et al., 2007; Bostan et al., 2013; Yang et al., 2015).
What are MC neurons encoding?
Different studies have recently confirmed the presence of activity-dependent mechanisms in the dendrites of MC pyramidal neurons and cortical reorganizations in relation to the acquisition of new motor abilities (Doyon and Benali, 2005). For example, an increase in dendritic length of layer V pyramidal neurons as a result of the acquisition of a motor reaching task has been described (Gloor et al., 2015). These cortical plasticity processes taking place in distal dendrites are dependent on proper NMDA-specific glutamate receptor functions (Hasan et al., 2013). Finally, in two seminal studies, Woody's group convincingly demonstrated the presence of depolarizing EPSPs in the pericruciate cortex of awake cats to CS and US presentations (Birt et al., 2003) and that the activation of recorded cortical units by CS presentations preceded the onset of the evoked CRs (Aou et al., 1992). The results collected by Woody et al. (Aou et al., 1992; Birt et al., 2003), further confirmed here, support the hypothesis that the MC is involved in the initiation of classically conditioned eyelid responses.
According to the present results, MC neurons are encoding both the profiles and kinematics of eyelid CRs. In fact, the firing rate of the three types of MC neurons described here was related not only to the learning curve, but also to the eyelid positions corresponding to CRs presented across the successive conditioning sessions, as determined by the integrated EMG activity of the orbicularis oculi muscle during the CS–US interval (Fig. 6F; Gruart et al., 1995). In addition, the electrical stimulation of the recorded MC area evoked eyelid profiles similar to those characterizing CRs in the rabbit (Fig. 7D–F). This is not a surprise, because the property of encoding different kinematic parameters of acquired motor abilities and the dynamics of the learned responses have been classically ascribed to diverse cortical areas involved in motor control (Evarts et al., 1983; Monfils et al., 2005; Orban et al., 2011; Hardwick et al., 2013).
As shown in a preceding study (Pacheco-Calderón et al., 2012) and further confirmed here (Fig. 7A–C), the reversible inactivation of the MC evoked a significant reduction in the integrated EMG amplitude of both conditioned and unconditioned responses, more noticeable in the former. These results are in contrast with those of classic studies indicating that even large MC lesions do not seem to affect the acquisition or performance of CRs in behaving rabbits (Ivkovich and Thompson, 1997). In contrast, Kelly et al. (1990) described the presence of noticeably modified CRs in the decerebrate-decerebellate rabbit. Moreover, it has been recently proposed that the RN and the surrounding pararubral area can substitute for the respective motor roles of cerebral cortical and cerebellar structures (Pacheco-Calderón et al., 2012), because they receive afferents from different sensory modalities (Padel et al., 1988) and present rich intrinsic circuits (Haley et al., 1988; Horn et al., 2002). Together, these studies suggest the presence of additional neural centers with a limited capacity to generate CRs.
Footnotes
This work was supported by grants from the Spanish Ministry of Economy and Competitiveness (BFU2014-56692-R) and Junta de Andalucía (BIO122, CVI 2487, and P07-CVI-02686) to A.G. and J.M.D.-G. M.Á.G.-C. had a postdoctoral contract (JCI-2011-09013) from the Spanish Ministry of Science and Innovation. We thank Roger Churchill for his help in manuscript editing.
The authors declare no competing financial interests.
- Correspondence should be addressed to Prof. Agnès Gruart, Division of Neurosciences, Pablo de Olavide University, Ctra. de Utrera, Km. 1, Seville 41013, Spain. E-mail: agrumas{at}upo.es


