

Abstract
Ongoing synaptic activity, ever present in cortical neurons, may vary widely in its amplitude and characteristics, potentially having a strong influence on neuronal processing. Intracellular recordings in layer 5 pyramidal cells in prefrontal and visual cortical slices maintained in vitro revealed spontaneous periods of synaptic bombardment. Testing the responsiveness of these cortical cells to synaptic inputs or the injection of artificial excitatory postsynaptic conductances of various amplitudes revealed that background synaptic activity dramatically increased the probability of response to small inputs, decreased the slope of the input-output curve, and decreased both the latency and jitter of action potential activation. Examining the effects of different components of synaptic barrages (namely, depolarization, increase in membrane conductance, and increase in membrane potential variance) revealed that the effects observed were dominated by the membrane depolarization and increase in variance. Depolarization increased the peak cross-correlation between injected complex in vivo-like waveforms through enhancement of responsiveness to small inputs, whereas increases in variance did so through a shift in firing mode from one of threshold detection to probabilistic discharge. These results indicate that rapid increases in neuronal responsiveness, as well as increases in spike timing precision, can be achieved through balanced barrages of excitatory and inhibitory synaptic activity.
Introduction
Neurons, especially cortical cells, are under constant bombardment by synaptic potentials, which can strongly influence the integrative and electrophysiological properties of the neurons (Holmes and Woody, 1989; Destexhe and Paré, 1999; Hô and Destexhe, 2000; Destexhe et al., 2001; Steriade et al., 2001; Chance et al., 2002; Fellous et al., 2003). In the anesthetized animal, this ongoing synaptic activity depolarizes cortical neurons by 5-15 mV and increases membrane conductance by ≥100% (Destexhe and Paré, 1999). Computational models suggest that this synaptic “noise” may have multiple effects on the probability that a given synaptic input may cause the neuron to spike. Pure increases in membrane conductance may shift the input-output relation of neurons to the right, requiring the injection of greater amounts of current to achieve the same firing rate (Holt and Koch, 1997; Chance et al., 2002), whereas increases in membrane potential variance from synaptic activity may instead smooth the input-output relation such that the probability of obtaining an action potential to a small input is enhanced, whereas that to a larger synaptic input may be reduced (Hô and Destexhe, 2000). Such a smoothing of the input-output relation may help the neural network overcome the nonlinearities imposed by action potential threshold, as has been recently investigated in studies of the contrast invariance of orientation tuning in the primary visual cortex (Anderson et al., 2000c; Hansel and van Vreeswijk, 2002; Troyer et al., 2002). Furthermore, combining simulated changes in both membrane conductance and membrane potential variance may result in a pure change in the slope (or “gain”) of the input-output spike relation in single cortical neurons (Hô and Destexhe, 2000; Chance et al., 2002). Extracellular recordings in vivo have found that the gain, the input-output relation, or both in cortical pyramidal cells may be modulated by a wide variety of behavioral circumstances, including selective attention (Spitzer et al., 1988; McAdams and Maunsell, 1999; Reynolds et al., 2000), change in eye position for cells in the posterior parietal cortex (Andersen and Mountcastle, 1983; Andersen et al., 1985), and interactions between different features of sensory stimuli (e.g., contrast and orientation; for review, see McAdams and Maunsell, 1999). Although the above-mentioned mathematical and biological models have suggested that synaptic bombardment may underlie these changes in input-output relations in vivo, it has not yet been demonstrated that normal endogenous synaptic activity in cortical networks may have these effects.
One striking example of strong endogenous synaptic activity in cortical networks occurs during the generation of the so-called slow oscillation (periodicity of 0.1-0.5 Hz), characterized by an alternating pattern of activity and inactivity during slow-wave sleep and anesthesia (Steriade et al., 1993, 2001). During the active (UP) period of the slow oscillation, cortical neurons receive a balanced, strong barrage of inhibitory and excitatory synaptic potentials, resulting in an ∼10 mV depolarization (Steriade et al., 1993, 2001; Sanchez-Vives and McCormick, 2000; Shu et al., 2003). Interspaced between these active periods are periods of relative quiescence (so-called DOWN states). Here we used the UP and DOWN states of the slow oscillation in vitro in combination with the dynamic clamp technique (Sharp et al., 1993; Dorval et al., 2001) to examine how the occurrence of naturally occurring synaptic activity may influence the responsiveness of single cortical neurons.
Materials and Methods
Slice preparation. In vitro experiments were performed on 0.4-mm-thick slices mainly from medial prefrontal but also from the lateral portions of the ferret occipital cortex, including primary and secondary (areas 17-19) visual cortical areas. The slices were maintained in an interface-style recording chamber at 35-36°C as previously described. Slices were formed on a DSK microslicer (Ted Pella Inc., Redding, CA) or a Leica (Nussloch, Germany) Vibratome in a slice solution in which the NaCl was substituted with sucrose. After transfer to the recording chamber, the slices were incubated in “traditional” slice solution containing (in mm): NaCl, 126; KCl, 2.5; MgSO4, 2; NaH2PO4, 1.25; CaCl2, 2; NaHCO3, 26; and dextrose, 10 and was aerated with 95% O2 and 5% CO2 to a final pH of 7.4. After ∼1 hr, the slice solution was modified to contain 1 mm MgSO4, 1 or 1.2 mm CaCl2 and 3.5 mm KCl. Extracellular multiple-unit recordings were obtained with single electrodes (Frederick Haer Corp., Bowdoinham, ME). Simultaneous extracellular multiple-unit and intracellular recordings were performed in layer 5 after 2 hr of recovery. Intracellular recordings were performed with beveled sharp microelectrodes containing 2 m potassium acetate with resistances of 60-90 MΩ.
Dynamic clamp and data analysis techniques. After obtaining a stable intracellular recording from a layer 5 neuron, a number of experiments were performed using the dynamic clamp technique with a DAP-5216a board (Microstar Laboratory) and a program that uses real-time Linux (Dorval et al., 2001) or a personal computer-based system with a modified version of Neuron running in real time (G. Le Masson, unpublished data). To test the responsiveness of cortical neurons in different states, artificial EPSPs were injected at 10 Hz and varied in size from 2 to 24-80 nS in steps of 2 nS. The largest amplitude of the EPSP conductance was several steps larger than the amplitude that consistently evoked an action potential during the DOWN state. The order of the different amplitudes of EPSP conductance was randomized to avoid order-specific effects of current injections. The amplitude-time courses of the artificial EPSPs were defined by a kinetic model of synaptic transmission (Destexhe et al., 1998; Destexhe and Paré, 1999) using only glutamate AMPA receptors.
Extracellular and intracellular data were collected using Spike-2 software (Cambridge Electronic Design, Cambridge, UK) or Elphy (Centre National de la Recherche Scientifique-Unité de Neurosciences Integratives et Computationnelles). The data were segregated into three periods, UP, DOWN, and transitional states, according to activity in the multiple-unit recording. The multiple-unit recording was rectified and smoothed to yield an outline of the increase and decrease in activity associated with the onset and offset of the UP state. Two thresholds were positioned, and the multiple-unit activity was required to rise above the highest threshold to be counted as an UP state. The onset and offset of the UP state were then determined by the crossings of the lower threshold, which was set at approximately two times baseline. Unless otherwise stated, only UP states that were at least 0.5 sec in duration were considered. DOWN states were defined as periods for which the activity level stayed below the lower limit for >0.5 sec. Periods that were not classified as UP or DOWN were not analyzed.
Response probability was calculated simply as the number of EPSPs that generated at least one action potential during the 20 msec after the onset of an injected EPSP divided by the number of injections of that amplitude of EPSP. The 20 msec duration was chosen because plots of the spike response to injected EPSPs revealed this to be the window of time during which these events reliably caused an increase in spike probability. The probability of spikes occurring within the 20 msec before the injection of an EPSP (i.e., spontaneous discharge rates) are also illustrated on the graphs for both the UP and DOWN states.
For measurement of response latency and “jitter” to artificial EPSPs, a time window was determined that extended from the statistically significant bin (0.5 msec duration) with the shortest latency after the injected EPSP to the significant bin with the longest latency; a significant bin was defined as any bin that contained a spike rate that was >2 SEM away from the average spike rate for the 5 msec before EPSP onset for the entire state under consideration. Average latency was then taken as the average time from the onset of the EPSP current to the first spike within that window. Jitter is the SD of latency. To measure the statistical significance of a manipulation on spike latency and jitter, we performed nonparametric sign tests, either on all amplitudes tested or on the values for the smallest amplitude EPSP injected that gave a significant response in both of the manipulations being compared. The slope of the input-output relation was taken as the least squares fit of the data from the 20-80% (or 0.2-0.8 probability) response rates.
The increase in membrane conductance during the UP state in comparison with the DOWN state was measured using the method of Borg-Graham et al. (1998). Postsynaptic currents occurring during the UP state were measured at several different membrane potentials under single-electrode voltage clamp. Multiple UP states were recorded at each membrane potential, and the holding currents for each UP state were averaged together to produce the average holding current as a function of time since the start of the UP state. Only times before the end of the shortest duration UP state were considered. Current-voltage plots were then formed for the DOWN and UP states, and the peak change in slope of these was taken as the peak change in membrane conductance during the UP state (Shu et al., 2003).
In addition to the injection of artificial EPSPs, we also manipulated the level of membrane potential, conductance, and variance (noise) occurring within the cell at the recording (injection) site. Membrane potential was manipulated through the intracellular injection of steady current. Changing membrane conductance was achieved with the dynamic clamp system, with the reversal potential of the conductance set to the measured resting membrane potential of the cell. Noise was modeled according to the method of Destexhe et al. (2001). The total synaptic current, Isyn, was composed of two independent conductances according to the formula Isyn = ge(t)(V - Ee) + gi(t)(V - Ei), where ge(t) and gi(t) are the time-dependent conductances calculated as a one-variable stochastic process similar to the Ornstein-Uhlenbeck process (Uhlenbeck and Ornstein, 1930; Destexhe et al., 2001). In our model, Ee is 0 mV; Ei is -75 mV; and ge is typically equal to gi. The τ for correlations within Ge was typically 5 msec, and for inhibition it was 10 msec. In some experiments, these were lengthened to 30 msec each. The results were similar and therefore combined.
The in vivo-recorded waveforms that were injected into cortical pyramidal cells were from Nowak et al. (1997). Barrages of postsynaptic potentials were intracellularly recorded in vivo in response to an optimal visual stimulus (moving bar) in a layer 2/3 chattering pyramidal cell in cat area 17 while the cell was maintained hyperpolarized to prevent action potential generation. The current that could give this recorded waveform was calculated according to the formula Iinject = Ires + Icap = V/Rin + (dV/dt)Cin, where Rin and Cin were measured in the cell from which the original PSP sequence was recorded (Nowak et al., 1997). Five hundred-millisecond-duration sections derived from three different evoked synaptic barrages were used here.
Cross-correlations were computed by first computing the peristimulus time histogram of spikes generated in response to the injected stimulus with a bin width of 0.5 msec. The peristimulus time histogram was smoothed with an α function of time constant 0.4 msec, correlated with the injected current using MATLAB 6.5 (The MathWorks, Natick, MA), and normalized so that autocorrelations at zero time lag had a value of 1.
The SD of the membrane potential in the UP and DOWN states was measured by the SD of a Gaussian function fit to the distributions of membrane potentials during these two states and after the removal of the depolarizing phase of action potentials with a median filter. The presence of action potentials had a significant effect on the value of the SD measured (presumably through the spike afterhyperpolarizations); therefore, the SD during the UP period was measured during periods of low action potential activity.
Results
Intracellular recordings were obtained from layer 5 regular spiking, presumed pyramidal, cells in both the medial prefrontal (n = 80 cells) and occipital cortical (n = 23 cells) regions in vitro. The average input conductance of a representative sample of these cells ± SD was 28.9 ± 7.7 nS (n = 22 cells), and their average resting membrane potential was -70.5 ± 2.1 mV (n = 33 cells). Maintaining these cortical slices in an ionic medium that closely mimicked that in vivo (see Materials and Methods) resulted in the occurrence of so-called UP and DOWN states (Figs. 1A, 2A) (Sanchez-Vives and McCormick, 2000; Shu et al., 2003), similar to those occurring in vivo during anesthesia and slow-wave sleep (Contreras and Steriade, 1995; Contreras et al., 1996). UP states, which were typically 0.5-3 sec in duration, typically occurred spontaneously (Figs. 1A, 2A) but also could be evoked through local electrical stimulation (Fig. 1A). They were associated with an increase in multiunit activity and, in intracellularly recorded cells, depolarization by barrages of synaptic potentials (Figs. 1A, 2A).

Transition to the UP state results in an increase in responsiveness in layer 5 neurons to synaptic inputs. A, Simultaneous extracellular multiple unit (MU) in layer 5 and intracellular recording from a layer 5 cell. The response of the cell to a single local electrical stimulus (Stim. location 2) was examined while the network was in the DOWN state (evoked PSP) or while it was in an UP state that had been triggered by a separate electrical stimulus (Stim. location 1) applied to the white matter (wm; evoked UP and PSP). B, Probability of initiation of a spike in response to the evoked PSPs during the UP and DOWN states. The UP state facilitates the probability of generating a spike to the smaller-amplitude inputs, whereas the large-amplitude synaptic responses initiate spikes with a high probability in both the DOWN and UP states. C, The UP state is associated with a decrease in the both the latency and jitter (SD of latency) of spikes that are initiated by the PSPs. Error bars indicate SEM; no bars indicates that they were smaller than the size of the symbol.

Characteristics of the UP-DOWN states and the protocol for injection of artificial EPSPs. A, Simultaneous extracellular and intracellular recording of the UP and DOWN states of activity in layer 5 of the prefrontal cortex. The UP state is associated with the arrival of a barrage of EPSPs that depolarize the membrane potential, increase the membrane conductance, and increase the membrane potential variance. MU, Multiple unit. B, Artificial EPSPs of random amplitude conductance (limited by steps of 2 nS; see Materials and Methods) were injected at a rate of 10 Hz and then separated into those that occurred during the UP and DOWN states. C, Expansion of the transition from DOWN to UP for detail. D, Overlay of responses of the cell to the 30 nS EPSP. Three measures were derived: probability that the EPSP will generate a spike, latency to onset of the first action potential, and finally the spike jitter, measured as the SD of the spike latency.
Previously, we demonstrated that the synaptic activity arriving in cortical neurons during the UP state is mediated by both EPSPs and IPSPs (Sanchez-Vives and McCormick, 2000; Shu et al., 2003). Here, the synaptic barrages associated with the UP state resulted in a 4-10 mV depolarization (mean, 7.6 ± 2.1 mV; n = 8 cells), and a peak increase of membrane conductance that ranged from 4 to 32 nS and averaged 12.8 ± 7.8 nS (n = 15 cells; see Materials and Methods). Plots of the distributions of membrane potentials during the UP and DOWN states revealed that the UP state was also associated with a marked increase in membrane variance (data not shown). The average SD of the membrane potential in the DOWN state was 0.5 ± 0.1 mV, whereas in the UP state, this increased to 2.4 ± 0.6 mV (n = 5). This effect did not result simply from depolarization because movement of the membrane potential by 5-10 mV with the intracellular injection of current did not have a significant effect on the SD of the membrane potential in the DOWN state (p > 0.05). Comparing these measures obtained with UP and DOWN states in vitro with those obtained in vivo revealed that they are either in line with in vivo results or are on the low side of what is normally observed (Table 1). The smaller values found in vitro versus those obtained in anesthetized animals may result from the hypersynchronous activity that characterizes cortical activity under anesthesia or from the reduced connectivity of the in vitro slice. In either case, it is clear that the transition from the DOWN to UP state is associated with three changes: depolarization of the membrane potential, increases in membrane conductance, and increases in the membrane potential variance, as has been observed previously (Destexhe and Paré, 1999; Steriade et al., 2001). It also should be noted that the transition from the DOWN to UP and from the UP to DOWN states was relatively rapid, occurring within <0.25 sec (Figs. 1A, 2), although the duration of the UP state varied widely (between 0.5 and 4 sec), even between adjacent UP states.
Changes in membrane potential, conductance, and variance with the UP state
The recurrent network activity is thus characterized by two general periods: the DOWN state, in which synaptic activity is relatively low, and the UP state, in which synaptic activity is relatively high. In extracellularly recorded single neurons (n = 32 cells; data not shown), the action potential rate in the UP state ranged from 2 to 47 Hz (mean, 17.1 ± 11.1 Hz; see intracellular recording in Fig. 2A). In the DOWN state, 18 of these cells did not spontaneously generate action potentials, whereas the remaining 14 cells discharged at a low rate that averaged 3.6 ± 3.0 Hz. Here we examined the influence of the increase in synaptic activity of the UP state on the responsiveness and timing of response to natural and artificially induced EPSPs generated through a dynamic clamp system (Sharp et al., 1993; Dorval et al., 2001). We then examined the relative influence of changes in membrane potential, conductance, and membrane potential variance in the generation of these effects.
Delivery of an electrical stimulus to layer 5 within 0.5 mm of the intracellularly recorded pyramidal neuron during the DOWN state resulted in the activation of a depolarizing PSP (Fig. 1A), which could be followed by the transition of the network into the UP state (data not shown). Increasing the intensity of the local electrical stimulus in layer 5 resulted in progressively larger evoked PSPs (between 1 and 15 mV) and an increased probability that these PSPs would evoke action potentials (Fig. 1B). In the DOWN state, this input-output probability function was very steep, as expected from the action potential threshold in a relatively quiet network. Delivery of an electrical stimulus to the white matter-layer 6 border could also result in the transition of the cortical network from the DOWN to the UP states (Fig. 1A, right). During the evoked UP state, the probability that the PSP evoked by a local electrical stimulus in layer 5 would activate a spike was strongly increased, unless the control stimulus already reliably generated a spike. Thus, during the UP state, the input-output curve was smoothed (Fig. 1B; n = 7 cells). The spikes evoked in the UP state occurred at a shorter latency and with less jitter than those for the DOWN state (Fig. 1C; p < 0.05 threshold intensity; n = 7 cells).
These results indicate that the generation of the UP state is associated with an increased responsiveness of cortical neurons to the activation of synaptic inputs that are subthreshold in the DOWN state. This enhancement is consistent with postsynaptic enhancement of responsiveness but could also involve presynaptic factors. To examine the postsynaptic components in isolation, we used the dynamic clamp technique to inject artificial EPSPs of various amplitudes during the UP and DOWN states (Fig. 2). The amplitude of the EPSP conductance was varied between 2 and a maximum of 24-80 nS, chosen such that the highest two to four EPSP conductances reliably caused the cell to spike in the DOWN state (Figs. 2, 3A). The peak amplitude of the artificial EPSPs (for conductances of <16 nS) during the DOWN state was approximately linearly related to the EPSP conductance with an average slope of 0.5 mV/nS (n = 5 cells; data not shown). Plotting the probability of generating an action potential in response to an artificial EPSP of a given amplitude revealed that in the DOWN state, there was a relatively steep threshold around which the probability of generating an action potential rose rapidly from 0 to 1 (Fig. 3). During the UP state, however, this input-output curve was changed markedly, with a significant shift to the left and a decrease in slope; the average shift was 12.5 ± 4.0 nS (n = 13 cells) for the conductance that caused the cell to discharge 50% of the time. The slope of the input-output curve decreased from 14.9 ± 3.4%/nS (n = 13 cells) in the DOWN state to 4.8 ± 2.5%/nS during the UP state. The response curves of seven representative neurons were normalized relative to the conductance amplitude that had a response probability of 50% in the DOWN state (Fig. 3B). Together, the leftward shift in the input-output curve and a smoothing of its slope resulted in a marked increase in responsiveness to ordinarily subthreshold artificial EPSPs.

Spontaneously occurring UP states result in an increase in responsiveness to mimicked synaptic conductances as well as a change in slope of the input-output relation. A, Examination of the probability of different-amplitude mimicked synaptic conductances to evoke an action potential during the DOWN and UP states. The UP state is associated with an increase in responsiveness to inputs and a decrease in slope of the input-output relation. B, Normalized data from seven cells illustrating the reproducibility of these effects. The synaptic conductance for each cell was normalized such that the conductance that resulted in a 0.5 probability of action potential discharge during the DOWN state was given a value of 1. The amplitude of each synaptic conductance was randomly chosen from a distribution of 2 to 60 nS in steps of 2 nS (see Materials and Methods). Extrapolation of the graphs to 0 conductance yields an estimate of the probability of spontaneous activity generating a response (denoted by an X).
The UP state was also associated with a decrease in latency to action potential generation and decrease in spike jitter (SD of spike latency), when compared with the DOWN state (Fig. 4). The average spike latency (for the smallest artificial EPSP used for latency measures for both DOWN and UP states; see Materials and Methods; Fig. 4 D) was 6.3 ± 2.4 msec (n = 13 cells) in the DOWN state. During the UP state, the latency to action potential generation for this minimal effective conductance (26 nS in Fig. 4 D) was significantly smaller at 2.5 ± 0.9 msec. Similarly, the average response jitter for this minimal conductance during the DOWN state was 2.1 ± 1.1 msec; during the UP state, jitter was reduced to 0.9 ± 0.4 msec (n = 13 cells). Overall, there was a significant decrease in latency and jitter for all values of the artificial EPSPs injected that initiated action potentials in both the DOWN and UP states (n = 7; p < 0.05, nonparametric sign test). The barrage of synaptic activity in cortical neurons associated with the UP state therefore had three main effects: an increase in response probability to smaller inputs, a decrease in spike latency, and a decrease in spike jitter.

The UP state is associated with an increase in neuronal responsiveness and a decrease in spike latency and jitter. A, Example of intracellular recording from a layer 5 pyramidal cell with the injection of random-amplitude artificial EPSPs. B, The UP state is associated with a marked increase in neuronal responsiveness. C, Raster plots and peristimulus histograms for two different-amplitude EPSPs (26 and 40 nS) showing that, during the UP state, the latency and jitter are reduced. The late spikes that occur during the UP state are not included in the latency and jitter calculations because no comparable spikes occurred during the DOWN state (see Materials and Methods). D, The spike latency and jitter (SD of latency) decrease with increases in the amplitude of the injected EPSP. Both the spike latency and jitter are significantly smaller during the UP state in comparison with the DOWN state.
Effects of depolarization, increases in conductance, and increase in membrane potential variance on EPSP input-output relation
To examine the contribution of changes in membrane potential, conductance, and variance on the response probability and spike variability measures in our layer 5 pyramidal neurons, we independently varied each of these parameters (see Materials and Methods). Changing the membrane potential of the cortical neuron through the intracellular injection of current resulted in a shift in the input-output relation. Depolarizations of ∼1-2 mV were sufficient to shift the curve to the left (toward smaller inputs) by 2-4 nS (Fig. 5A); the average response was a 2.6 ± 1.1 nS shift/mV change in membrane voltage (Vm). Depolarization or hyperpolarization of the membrane potential had no significant effect on the slope of the input-output curve for evoking action potentials. The slope of the relation was 15.8 ± 6.7%/nS at an average membrane potential of -72 mV and 17.2 ± 4.7%/nS at a more depolarized membrane potential of -66 mV (n = 7 cells; p > 0.05). Depolarization of neurons by a few millivolts did result in a decrease in spike latency (3.3 ± 1.6 msec at hyperpolarized Vm and 1.92 ± 0.15 msec at depolarized Vm; n = 5 cells; p < 0.05; tested for the smallest EPSP that evoked spikes in all conditions), and spike jitter (SD of latency, 0.93 ± 0.56 msec at hyperpolarized Vm and 0.40 ± 0.14 msec at depolarized Vm; n = 5 cells; p < 0.01; Fig. 5A).

Effects of increase in membrane potential, membrane conductance, and noise on neuronal responsiveness. A, Depolarization of the membrane potential with the intracellular injection of current results in a leftward shift in the input-output response, a decrease in latency, and a decrease in jitter of spike responses. B, Increasing the background membrane conductance (with the dynamic clamp system) from 0 to 40 nS results in a shift of the input-output relation to the right, an increase in latency, and an increase in spike jitter. C, Increases in the variance of the membrane potential (noise) result in a change in the slope and a “smoothing” of the input-output relation. There is also a decrease in spike latency and jitter for lower-amplitude artificial EPSPs. noise 0, No additional noise (although the baseline conductance for the noise is active); noise 1, increases in the SD of both ge and gi to 1 nS; noise 2, increase of these SDs to 2 nS.
Increases in artificial leak membrane conductance of 10, 20, or 40 nS resulted in a shift of the spike probability curve to the right, such that a larger synaptic conductance was required to reach the action potential threshold (Fig. 5B). These increases in membrane leak conductance resulted in an average 0.67 nS EPSP conductance shift for each 1 nS increase in leak conductance (±0.05 nS EPSP/nS leak conductance; n = 4 cells). The slope of the input-output relation was not significantly affected by increases in basal membrane conductance (0 nS, 20.5 ± 11.2%/nS; 40 nS, 15.0 ± 4.8%/nS; n = 4 cells; p > 0.05). Increases in membrane conductance (Gm) from 0 to 40 nS resulted in an increase in spike latency from 1.95 ± 0.8 msec to 3.1 ± 0.98 msec (n = 4 cells; p < 0.01; for the smallest excitatory conductance that elicited spikes at all values of Gm). Similarly, increases in conductance caused an increase in spike jitter from 0.31 ± 0.21 to 1.02 ± 0.69 msec (n = 4 cells; p < 0.01; Fig. 5B).
Increasing the SD (noise) of the excitatory and inhibitory conductances from 0 to 2 nS in the Ornstein-Uhlenbeck process that we used to mimic background synaptic activity resulted in an increase in membrane potential SD to 2.87 ± 0.34 mV (n = 7 cells), which is similar to the SD of the membrane potential during natural UP states (see above). Injection of this background noise (without changing background conductance) resulted in a smoothing of the input-output relation and a decrease in slope (from 20.2 ± 5.1 to 5.8 ± 1.4%/nS; n = 8 cells; p < 0.01), such that the probability of responding to smaller inputs was enhanced, whereas the response to medium and larger inputs was decreased (Fig. 5C). A further increase in the SD of the excitatory and inhibitory conductances from 2 to 4 nS resulted in a further decrease in the slope (to 2.7 ± 0.06%/nS; n = 3 cells; p < 0.01). These effects on the input-output relation pivoted on the 50% spike probability point (Fig. 5C), as expected from computational modeling studies (Destexhe et al., 2001). Increases in membrane potential variance resulted in a decrease in spike latency and jitter to the minimally effective injected EPSPs (Fig. 5C). Increasing the SD of excitatory and inhibitory conductances of the injected noise from 0 to 2 nS resulted in an average decrease in spike latency of 1.92 ± 1.18 from 5.58 to 3.67 msec (n = 8 cells; p < 0.01; see Materials and Methods) and a significant decrease in spike jitter from 1.89 ± 1.11 to 1.31 ± 0.66 msec (p < 0.05; n = 8 cells; for the smallest excitatory conductance that elicited spikes at all levels of injected noise). However, for larger-amplitude inputs, increases in noise did not consistently affect spike latency or jitter (Fig. 5C).
Mimicking the UP state with the dynamic clamp system
Our results suggest that the effects of the UP state on the responsiveness of cortical neurons to artificial EPSPs may be explained by the combined influences of the increase in membrane potential variance, depolarization, and the increase in conductance. Indeed, examining the combined effects of change in membrane potential, conductance, and variance on response probability and comparing these with those occurring during natural UP states confirm this hypothesis. The average depolarization of the membrane potential during the UP state was 7.6 mV, associated with a shift in the input-output curve by 12.5 nS. Changing membrane potential alone results in a shift of the input-output curve of 2.6 nS/mV, predicting a shift of 19.8 nS for the UP state. However, taking into account the expected rightward shift of the input-output curve associated with an average increase in Gm of 12.8 nS (8.6 nS shift) yields an expected shift of 11.2 nS, very close to the 12.5 nS measured. This indicates that the shift of the input-output curve on the x-axis is approximately twice as strong for the change in voltage as for the change in conductance. The decrease in the input-output slope to 4.8%/nS during the natural UP state appears to be mediated entirely by the increase in membrane noise and is similar to the slope of 5.8%/nS found when similar changes in membrane potential variance were generated with the dynamic clamp system. Together, these results indicate that the barrage of synaptic activity will result in a significant increase in response to small synaptic inputs through both a membrane depolarization and an increase in membrane potential variance.
To examine this hypothesis further, we used the intracellular injection of background noise that was adjusted to mimic the naturally occurring UP state in the same neurons. These fake UP states were generated through increases in both artificial excitation and inhibition, the total conductance of which was adjusted to give the same average depolarization as the naturally occurring UP states in each cell (n = 5 cells). The membrane potential variance was then adjusted to approximate that occurring during the spontaneously occurring UP states (∼2.5-4 mV; Fig. 6). Mimicking the UP state in this way had a similar effect on the input-output relation to artificial EPSPs as did the naturally occurring UP state, including a large leftward shift to smaller inputs and a substantial decrease in slope (Fig. 6). These results further support the hypothesis that the major contributors to the input-output changes measured here are the changes in membrane potential, variance, and conductance.
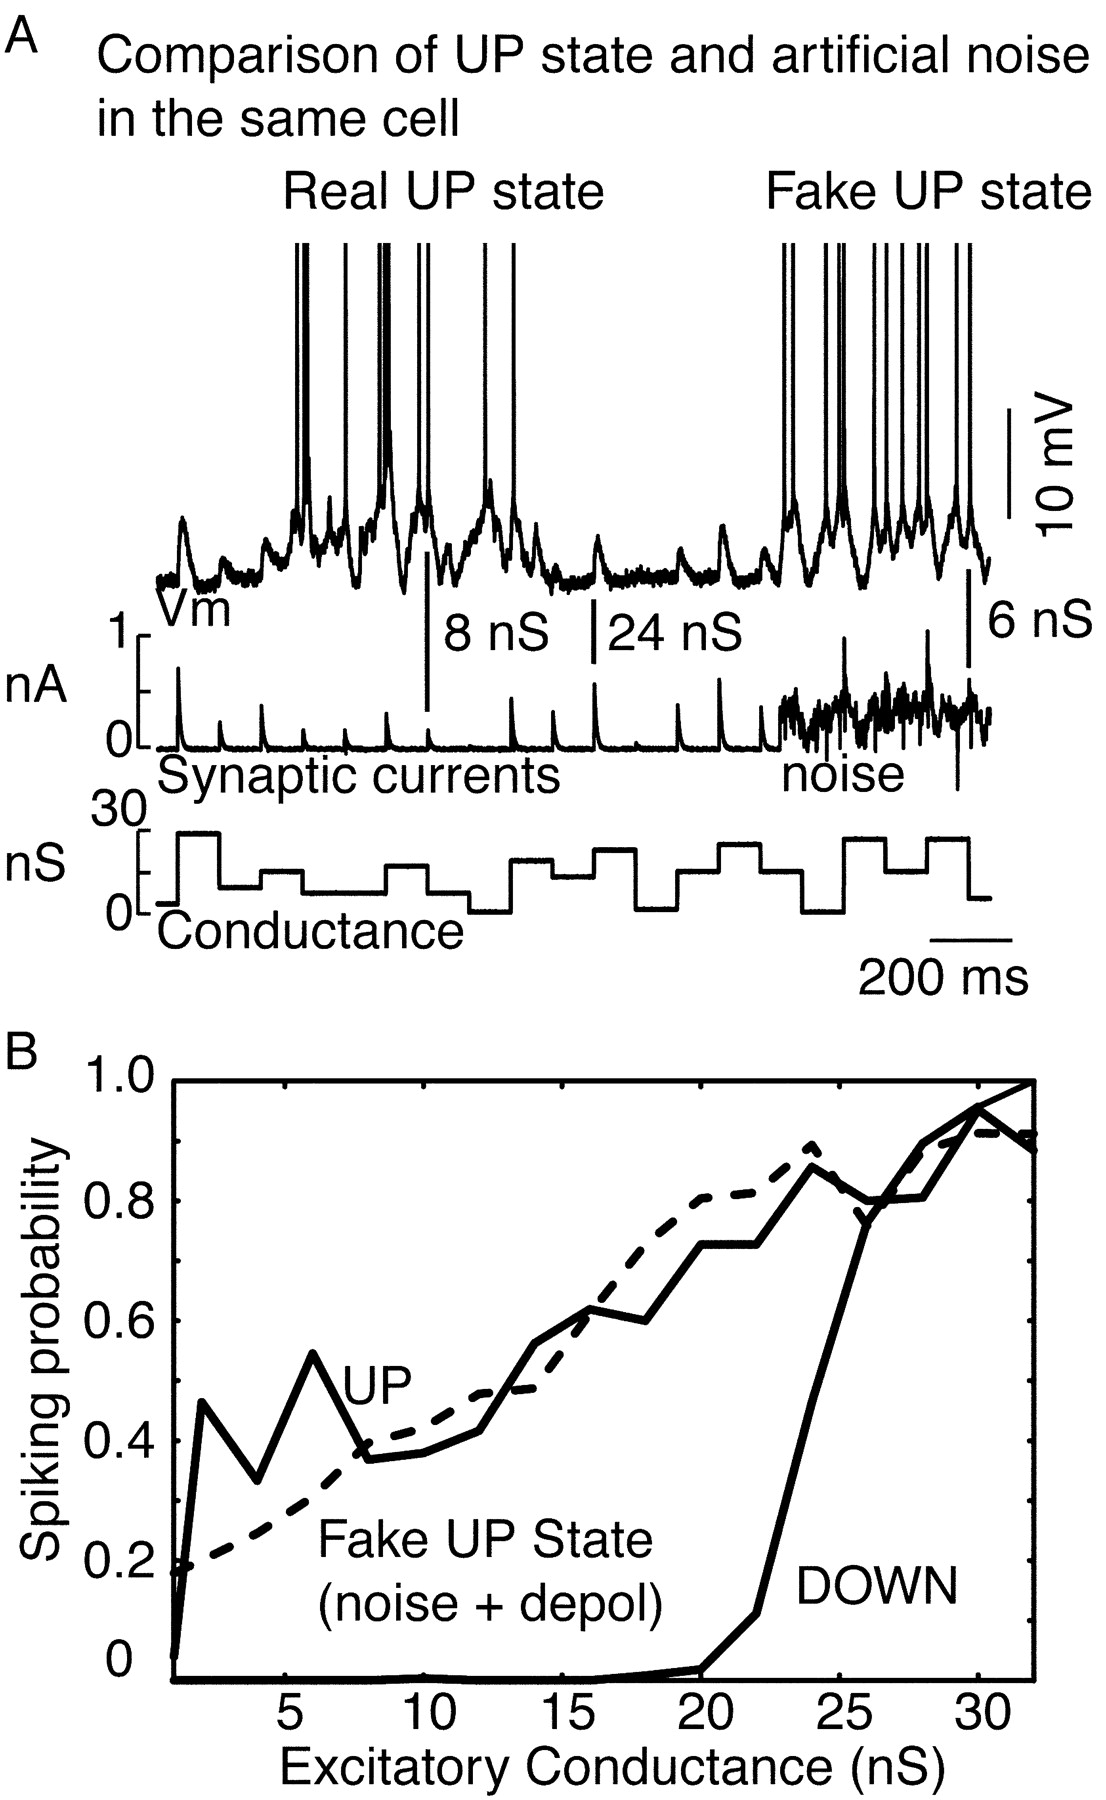
A, Mimicking the UP state with combined depolarization (6.6 mV depolarization), an increase in conductance (11 nS combined excitatory and inhibitory conductance), and an increase in noise (4.2 mV SD) results in effects similar to the real UP state. The level of the bottom trace is a visual indicator of the level of conductance of the concurrent artificial EPSP. B, The natural UP state resulted in a large shift to the left and a change in the slope of the spike probability curve in this cell. Mimicking the UP state with a similar level of depolarization (depol) and membrane potential variance resulted in a similar effect.
The duration of depolarizing events determines the effects of noise
Our results, along with previous studies, reveal that the injection of rapidly varying current (e.g., noise) into cortical pyramidal cells increases the spike-initiating probability of small EPSPs but decreases the probability of spike response to medium and large EPSPs (Destexhe et al., 2001). However, other studies using the injection of prolonged current pulses found that all amplitudes are facilitated, with the degree of the facilitation by the noise decreasing with the amplitude of the pulse (Chance et al., 2002). One possible explanation for these seemingly disparate findings is that the effect of membrane potential variance depends on the precise relationship of the duration of the test pulse to the lower-frequency components of the noise (e.g., whether the pulse fits within the troughs of the noise). Here we sought to test this hypothesis by examining the effects of increases in membrane potential variance on the response to current pulses, with particular attention to the duration of the response period analyzed (Fig. 7).

The influence of noise on the action potential response depends on the duration of the input. A, Action potential response to the intracellular injection of a 400-msec-duration current pulse of varying amplitudes with and without the addition of background noise (4 nS for both ge and gi). Increasing noise enhances the response to the small current pulse (0.4 nA) more than to the large one (1.2 nA). B, Raster plot of the response to a 1.4 nA current pulse without and with the addition of 4 nS of noise. C, Plot of the number of spikes generated per pulse for the first 5 msec of the current pulse versus the amplitude of the current pulse as well as the amplitude of the added noise (Medium Noise, 2 nS; High Noise, 4 nS, for both ge and gi). Note that the noise increases the response to small short-duration events but decreases the response probability to larger short-duration events. D, Number of spikes per pulse for the first 320 msec of the current pulse. Note that the addition of noise enhances the response to small-amplitude pulses, with relatively little effect on the amplitude of large pulses, thereby resulting in a decrease in slope.
The precise influence of increases in membrane potential variance on the response to depolarizing current pulses depended on the portion of the pulse analyzed (n = 4 cells). If the analysis was restricted to the initial 5 or 10 msec of the depolarizing pulse (e.g., approximately the same duration as the artificial EPSCs), then increases in membrane potential variance resulted in an enhancement of responses to small current pulses (meaning those pulses that had a probability of generating an action potential of less than ∼0.5; Fig. 7C). The addition of noise resulted in a decrease in response to larger-amplitude pulses (those that gave >50% response probability; Fig. 7C), although the responses to the largest current pulses were less affected (data not shown). Close examination of the first 5-10 msec of the current pulses revealed that the addition of noise in the injected current brought the cell close to or above the firing threshold on a subset of trials, even if the same-amplitude current pulses never caused action potential generation within 5-10 msec without the addition of this noise (Fig. 7C).
Increasing the proportion (duration from onset) of the current pulse that was analyzed for action potentials (which is similar to increasing the duration of the current pulse) resulted in a change in the effects of noise. With the analysis of more prolonged (e.g., 320 msec) periods of the depolarizing pulse, the increase in variance facilitated the response to smaller-amplitude inputs. This effect diminished with increases in input amplitude, thereby resulting in a decrease in slope of the input-output relation (Fig. 7), as previously reported (Chance et al., 2002). As the duration of the portion of the current pulses that was analyzed was lengthened from 5 to 320 msec, these two effects blended into one another such that durations of greater than ∼10 msec were sufficient to lose the decrease of larger-amplitude inputs. These results indicate that the precise effects of increases in membrane potential variance on input-output relation may depend on the relationship between the duration of the input and the frequency components of the membrane noise.
Depolarization and noise can increase the correlation between input waveform and output spike pattern for a complex stimulus
These results suggest that the UP state increases the responsiveness to synaptic inputs, especially those of smaller amplitude. We hypothesized that the UP state may increase the correlation between arriving barrages of PSPs and spike output in part by enhancing the ability of small inputs to initiate action potentials or by changing the timing of spike generation. To test this hypothesis, we injected into cortical pyramidal cells current waveforms derived from visually evoked synaptic barrages recorded in vivo (Figs. 8, 9) (Nowak et al., 1997). The UP state was associated with a significant (26%; p < 0.05, nonparametric sign test; n = 9 cells) increase in the peak cross-correlation between the input waveform and the spike rate histogram (from an average of 0.47-0.59), as collected over many UP and DOWN states (data not shown).

Depolarization increases the correlation between a complex waveform and neuronal discharge. A, Current waveform, derived from an intracellular in vivo recording (Nowak et al., 1997), that was injected with varying levels of depolarization. The vertical dashed lines are visual guides to help align peaks in activity and the injected current. The histogram illustrates the response of the neuron at a membrane potential of -83 mV. B, Depolarization of the resting membrane potential of the cell to -76 mV with the intracellular injection of current results in a marked enhancement of neuronal responsiveness to the injected waveform. C, Group data (6 cells) demonstrating that depolarization results in an enhancement of the peak cross-correlation between the amplitude of the input and the neuronal firing rate.

Increases in membrane variance can enhance the correlation between the spike response and the injected current waveform. A, Examples of injected current (derived from a visual response recorded in vivo) and the resulting membrane potential deviation in one neuron recorded in vitro. B, Raster plots of spike times over 375 trials in response to the injection of the current waveform in A during the DOWN period and without the addition of injected noise. Note the regularity of the spike response and the six peaks of activity within the box. Red dots are the first spikes to occur after the beginning of the examined period for each trial, as indicated by the dashed box. C, Same neuron as in B but with the addition of noise (2 nS SD). Note the appearance of spikes throughout the injected waveform. The scale is different for the histogram in C versus B. Again, red dots are the first spikes to occur on each trial after beginning of the indicated time period (dashed box). D, Group statistics showing that there is a significant increase in peak cross-correlation between the injected current and the spike histogram with the addition of 1 and 2 nS of added noise, but this effect is less with 4 nS of noise. E, Overlay of the injected current in A and the histograms in B and C plotted to the same scale. Note the increase in correlation between the waveform and the spike output after the addition of noise. F, Reordering of the spike data in B and C according to the time of the first spike (red dots) within the period examined (B, C, boxes). Note that without noise, the cell only discharges at peak 2 if it has not discharged to peak 1. Similarly, the cell only discharges to peak 3 if it has not discharged to peaks 1 or 2. If the cell discharges to peak 3, then the response to peak 4 is delayed. These results indicate that the generation of an action potential has a significant effect on the probability of generation of following spikes for ∼50-80 msec. The addition of background noise results in a reduction of this shadow effect, allowing the cell to discharge throughout the injected waveform. G, Examples of cross-correlations in the no noise and 2 nS noise conditions.
We next tested whether depolarization or increases in membrane variance alone may result in enhanced responses or an increase in correlation between the injected waveform and the spike rate histogram (Figs. 8, 9). Depolarization of cortical neurons with the intracellular injection of current resulted in an increase in the number of spikes generated by the injected waveform as well as an increase in the peak cross-correlation between the waveform and spike rate (Fig. 8A-C). The amplitude of this enhancement in cross-correlation averaged 0.012/mV depolarization and varied between cells from 0.003 to 0.04/mV (Fig. 8C; n = 6 cells; p < 0.01).
Similarly, increasing the SD of the background conductance (e.g., adding noise) from 0 to 1 or 2 nS resulted in a statistically significant (p < 0.01; n = 9 cells) increase in the peak cross-correlation between the injected in vivo-like current waveform (Fig. 9A) and the spike rate of the recorded pyramidal cells (Fig. 9B,C). Increasing the level of noise further to 4 nS resulted in a decrease in the peak cross-correlation in comparison with the 1 or 2 nS levels (Fig. 9D). Examination of the spike rate histograms before and after the addition of noise indicates that this increase in correlation resulted in part from a smearing of the sharp peaks in the histogram as well as the appearances of new peaks after the addition of noise (compare Fig. 9B,C). The mechanisms by which the addition of noise results in an increase in correlation between the injected current and spike rate histogram were explored further.
Examination of the spike trains on individual trials (in the absence of noise) revealed an interesting observation. The time of occurrence of the first spike within a 100-200 msec period of each trial (without the addition of noise) typically varied between multiple peaks (Fig. 9B) such that the generation of a spike on a given peak often occurred only if the preceding peak failed to elicit a spike on that trial (n = 12 100-200 msec periods in the responses of six cells). Overlaying the injected current waveform and the spike histogram revealed that the peaks in spike probability were associated with depolarizing waves in the membrane potential (Fig. 9E, No Noise). The addition of 1, 2, or 4 nS SD of noise on top of the injected current waveform resulted in a marked increase in the number of action potentials generated, and these action potentials occurred throughout the entire waveform (Fig. 9C; n = 6 cells). Comparing the amplitude-time course of the injected current and the spike rate histogram after the injection of noise revealed a significant increase in cross-correlation between the two (Fig. 9E). Reordering the spikes during periods in which spikes were generated at distinct peaks (Fig. 9B) revealed that, without the addition of noise, the probability of generation of a spike to each peak was strongly influenced by whether a spike had occurred recently (Fig. 9F). Thus, the generation of an action potential to a particular portion of the injected current waveform appeared to dramatically decrease the probability that the cell will respond to additional peaks in the current for a period of ∼50-100 msec (Fig. 9F), a finding that we refer to as the “shadow” effect. The addition of noise resulted in a marked decrease in the clustering of first spikes into particular time bins and a decrease in this shadow effect. In the presence of noise, the neuron discharged throughout multiple components of the injected waveform (Fig. 9C,F).
We examined the shadow effect of spike generation by quantifying the effect of spike generation on the subsequent probability of activation of additional spikes to later events. We noticed that many of the larger depolarizing events in the in vivo-recorded waveform were well approximated by the depolarizing half of a 40 Hz sine wave (Fig. 10A) because of the strong presence of membrane potential oscillations in the 40 Hz frequency range in some of our in vivo recordings (Gray and McCormick, 1996). Therefore, we injected into single layer 5 pyramidal cells two sine waves (depolarizing half only) at intervals varying from 10 to 100 msec (Fig. 10B,C; n = 8 cells). The first sine wave varied in amplitude between two similar values that were chosen such that the smaller rarely caused an action potential, whereas the larger did (Fig. 10B). The second sine wave varied semirandomly in both time and amplitude (see Materials and Methods; Fig. 10B,C). The response to the injection of these sine wave currents was a rapidly depolarizing membrane potential that slowly decayed on removal of the current (Fig. 10A). This slow decay resulted in a significant window for temporal summation between the membrane response to the two sine waves. However, the activation of an action potential by the first sine wave current resulted in an increased rate of repolarization of the membrane potential and, therefore, a decrease in the window for temporal summation (Fig. 10C, Overlay).

Examination of the reduced probability of spiking after the generation of an action potential in cortical neurons. A, Example waveforms of the response of cortical cells to activation of a real EPSP (from Fig. 1), a dynamic clamp EPSP (from Fig. 2), one of the larger “events” in the complex waveform (from Fig. 9A), and injection of the depolarizing phase only of a 40 Hz sine wave (see B). The peak amplitudes of the waveforms were normalized to the same value to facilitate the comparison of time courses. All of the wave forms are of a similar time course. B, Protocol for examining the effect of spike generation on the responsiveness of the neuron. The depolarizing half of a 40 Hz sine wave was injected, followed at various intervals by injection of the same waveform but at different amplitudes. The first current injection was of two different amplitudes and adjusted so that the larger amplitude caused an action potential, whereas the smaller failed to do so. C, Example of raw data. The amplitude and time of occurrence of the second sine wave were pseudorandomized (between discrete time steps of 9-10 msec). Overlay, Membrane potential response of the cell to the sine wave injection that caused a spike (black) and one that did not cause a spike (red). Note that the occurrence of a spike shortens the falling phase of the response. D, Plot of the change in probability of eliciting an action potential by inputs of various amplitudes and at various intervals after the generation of a spike. The change in probability is calculated by subtracting the probability curve with a spike from the curve without a spike for each amplitude-time point (e.g., see E-H as indicated by arrows). There are four distinct regions. Region I represents a separation of the two stimuli by ≥70 msec. In this region, the occurrence of a spike to the first input has little or no effect on the probability of generating a spike to the second. Region II represents amplitudes and time intervals in which the probability of generating an action potential to either input was 0. Region III represents those amplitude and time intervals in which the occurrence of a spike to the first stimulus significantly reduced the probability of spiking to the second stimulus. In region IV, the test stimulus was so large and at such a short interval that the occurrence of a spike to the first had no effect. E, Example of the spike probability curve for different-amplitude inputs with and without a preceding spike at an interval of 27 msec. F, At an interval of 80 msec, the generation of a spike has no effect. G, Effect for different intervals at a fixed amplitude of the test stimulus. At short intervals, there is significant temporal summation, which is reduced by the occurrence of an action potential. H, Example curves for 1.4 nA input at different intervals. There are two main effects. At short intervals, there is temporal summation, which overcomes the suppressive effect of a preceding spike. At long intervals, the preceding spike has no effect. Between these extremes, the occurrence of a spike reduces the probability of generating another action potential.
The initiation of an action potential resulted in a decreased probability that a second depolarizing event will cause another action potential for a period of ∼60 msec, depending on the amplitude of the second depolarizing event (Fig. 10D-H; n = 8 cells). For example, plotting the probability of generating an action potential in response to different-amplitude inputs that follow the generation of a spike by a short interval (27 msec; Fig. 10E) revealed that the occurrence of a spike results in a significant shift in the input-output curve to the right, resulting in a marked increase in the amplitude of the current needed to initiate a spike. However, this suppressive effect of spike generation on the ability to initiate another spike disappears at intervals of 80 msec (Fig. 10 D).
If one considers the response to inputs of a constant size, it becomes clear that the generation of an action potential suppresses the responsiveness of the neuron to additional inputs for ∼60-80 msec (Fig. 10G,H). This effect is complicated by the fact that stimuli that are presented at intervals <50 msec exhibit temporal summation (Fig. 10G, red trace) and for larger inputs, this temporal summation may negate the suppressive effects that follow action potential generation (Fig. 10H).
These data suggest that the addition of noise will facilitate the representation of the injected wave form by both increasing the response of the cell to smaller inputs (e.g., see Figs. 3, 4) as well as through the occasional prevention of action potential generation to larger events on some trials, thereby leading to an increased possibility that subsequent events (within ∼70 msec) may themselves generate an action potential.
The effects of added noise on the response to the intracellular injection of complex waveforms suggest that a moderate level of noise may also reduce the shadow effect, allowing spikes to occur shortly after the generation of an action potential. To examine this in more detail, we tested the effect of spike generation on subsequent neuronal responsiveness in the presence of various levels of added membrane variation (Fig. 11). Increasing membrane noise from 0 to 4 nS SD (both ge and gi) resulted in a progressive decrease in the effects of a preceding spike on the probability of generating additional spikes (Fig. 11; n = 6 cells). Thus, the addition of membrane variance significantly reduced the decreased probability of action potential generation that follows the occurrence of a spike.

The addition of background noise reduces the spike shadow effect. A, Effect of the generation of an action potential on the subsequent probability of the generation of an additional action potential in response to the second injection of the depolarizing phase of a 40 Hz sine wave at the indicated amplitude and latency (see Fig. 10 D). Graphs are generated by subtracting the probability of generating an action potential with a preceding spike (to a stimulus injected at time 0) from the probability curves when there was no preceding spike. B-D, Increasing the level of added membrane variance (noise) results in a marked decrease in the spike shadow effect, thereby allowing the cell to recover quickly from having generated a preceding action potential. Noise 1, 2, and 4 correspond to 1, 2, and 4 nS of added noise. The same added background conductance was present in all four conditions (A-D) with only the variance changing between conditions. Thus, the average membrane potential and conductance are not different in the four cases shown.
The increase in correlation between the injected complex waveform and the average spike rate output after the injection of noise suggests that moderate levels of noise may facilitate the representation of an input by increasing the jitter of the spikes throughout the waveform with the amplitude-time course of injected waveform. To examine this hypothesis, we measured the timing of spikes generated in response to the intracellular injection of the depolarizing half of the sine wave in the presence of no additional noise or during the injection of an added SD of 1, 2, or 4 nS (for both ge and gi; Fig. 12; n = 8). The addition of random membrane variance resulted in an increase in neuronal responsiveness to small inputs and a decrease in response to moderate-size inputs, as expected (Fig. 12). The addition of this level of membrane variance also resulted in a significant increase in jitter in action potential timing (Fig. 12B,D; p < 0.01 for all amplitudes) and a significant increase in the peak cross-correlation between the injected sine wave and the probability of action potential generation (Fig. 12B,D; p < 0.01 for all amplitudes; n = 6).

Noise can facilitate the cross-correlation between the injected 40 Hz sine wave current and the resulting average spike rate histogram. A, Spike histogram over 350 trials of the action potential discharge of a cortical pyramidal cell in response to the intracellular injection of the depolarizing phase of a 40 Hz sine wave of various amplitudes. The spikes show little variation from trial to trial in their timing. B, The addition of background noise (4 nS SD of both excitatory and inhibitory components) results in a smoothing of the discharge rate of the pyramidal cell, as well as increased responsiveness to previously subthreshold stimuli (e.g., 0.8 nA). Note that the addition of noise also lessens the phase lag of spike times to threshold stimuli (e.g., 1 nA). C, Plot of the number of spikes generated per trial versus the current amplitude in the presence and absence of added noise. D, The addition of membrane noise results in a significant increase in spike jitter (SD of spike times) and an increase in the peak cross-correlation between the average spike rate and current amplitude.
Discussion
We have demonstrated that barrages of synaptic activity can strongly influence the generation and timing of action potentials in response to additional real or artificial synaptic inputs. During the synaptic barrages of the UP state, there is a marked increase in probability of action potential generation, at a shorter latency and with less jitter, in response to all depolarizing PSP- or EPSP-like subthreshold inputs. This effect could be large enough that it could allow even very small inputs (e.g., 4 nS, ∼2 mV depolarization), on the order of the average expected input from one or two pyramidal cells (Markram et al., 1997; Thomson and Deuchars, 1997), to generate action potentials.
Examining the independent influence of changes in membrane potential, noise, and conductance on the input-output response probability of cortical neurons revealed that depolarization shifts the curve such that smaller inputs can make the cell discharge, as expected. Increases in membrane conductance decrease neuronal responsiveness to smaller inputs, with no significant change in slope of the input-output curve (Holt and Koch, 1997; Chance et al., 2002). For single artificial EPSPs, increases in noise result in a change in slope, pivoting on the 50% response point, as predicted from modeling studies (Hô and Destexhe, 2000; Destexhe et al., 2001). Functionally, this results in an increased probability of responding to small inputs and a decreased probability of responding to medium-sized inputs (see Fig. 5C). Previously, it was shown with intracellular recordings in vivo that the UP state is associated with an enhanced responsiveness of cortical pyramidal cells to the activation of subcortical inputs (Timofeev et al., 1996). This enhanced responsiveness resulted not only from the depolarization of cortical cells by the UP state but also from the depolarization of subcortical (e.g., thalamic) neurons by the synaptic barrages of the UP state.
Effects of membrane potential variance on spike responses
Increases in membrane potential variance resulted in an enhancement of the probability of spike generation to small artificial EPSPs but a decrease in response probability to medium-sized ones (Fig. 5C). This is because, when considering small inputs, the facilitatory effects of the depolarizing components of the noise are greater than the decremental effects of the hyperpolarizing components (because of a floor effect). In contrast, for inputs that cause the cell to spike with a probability of >0.5, the decremental effects of the hyperpolarizing components of the noise are greater than the facilitatory effects of the depolarizing components (because of a ceiling effect). This amplitude dependence of the effects of noise results in a pivoting of the input-output curve around the 50% probability point. Finally, for very large events, the addition of noise may not influence the probability of initiating spikes because even the largest hyperpolarizing events in the noise are insufficient to prevent the generation of a spike response.
If the duration of the injected events becomes longer, such as with prolonged current pulses (Chance et al., 2002), and one considers average firing frequency instead of the probability of activating a single spike, the effects of added noise differ from those outlined above. For small depolarizing pulses, the effects of noise will be primarily facilitatory because of a floor effect (e.g., a subthreshold input that fails to cause spikes on its own can only be facilitated by noise). Larger inputs, however, are only limited by the frequency firing capability of the cell and will be approximately equally affected by the depolarizing and hyperpolarizing components of noise. Thus, the addition of noise results in a decrease in slope of the input-output response to current pulses, primarily through the facilitation of responses to small inputs.
The differences between the effects of noise on short- and long-duration inputs indicates that noise will have differential effects on the various frequency components of an input. Short-duration depolarizations can be completely prevented by hyperpolarizations that are approximately its (the depolarizing event) duration or longer. Longer-duration events require, to have the same effect, equally long-duration hyperpolarizing events in the injected noise (of which there are proportionally fewer). The results complicate the interpretation of the overall effects of noise on the encoding of synaptic inputs in spike trains. By injecting complex in vivo-like waveforms, we have found that the UP state, increased noise, and depolarization can all increase the peak cross-correlation between spike rate and the amplitude-time course of the underlying input. This effect results from a shift in the firing mode of cortical cells from one of threshold detection to probabilistic firing, with the probability of action potential generation being determined by the amplitude-time course of the arriving current waveform (e.g., PSP barrage). In vivo, this could be achieved on a single-trial basis through the occurrence of noise throughout a network of neurons that were encoding the same input.
Functional consequences of background activity
Cortical neurons receive up to tens of thousands of synapses from thousands of presynaptic cells (see White, 1989; Abeles, 1991). This large degree of convergence suggests that, more often than not, each cortical neuron is under the influence of hundreds of synaptic inputs or more. These inputs may play a variety of roles in generating neuronal activity, not only deciding precisely when action potentials are initiated but also providing a mechanism by which “context” is provided to the cell (e.g., attention, eye position, and stimulation of receptive field surround). Thus, changes in the barrages of synaptic activity may underlie diverse changes in neuronal responsiveness, owing to the combined influences of changes in membrane potential, conductance, and membrane potential variance (Matsumura et al., 1988; Bernander et al., 1991; Carandini and Heeger, 1994; Borg-Graham et al., 1998; Hirsch et al., 1998; Anderson et al., 2000b,c; Steriade et al., 2001). Even more complex changes are possible if one considers the local nature of synaptic activities in dendritic branches (for review, see Yuste and Tank, 1996; Magee, 2000).
Our results and those of others (Bernander et al., 1991; Carandini and Heeger, 1994; Holt and Koch, 1997; Hô and Destexhe, 2000; Destexhe et al., 2001; Chance et al., 2002; Fellous et al., 2003; Mitchell and Silver, 2003) reveal that the precise changes that occur in neuronal responsiveness with synaptic bombardments will depend on a mixture of the influences of changes in membrane potential, conductance, and variance. Electrophysiological studies in vivo have provided evidence for multiple forms of modulation of neuronal excitability depending on the behavioral or stimulation context. For example, studies of attention have reported changes to the input-output (sensory stimuli to firing rate) relation of visual cortical neurons. These alterations include a proportional enhancement to all stimuli, consistent with a multiplicative gain (McAdams and Maunsell, 1999; Treue and Martínez-Trujillo, 1999), or a particular enhancement of weak stimuli (Reynolds et al., 2000) in a nonmultiplicative manner. A similar nonmultiplicative enhancement of weak visual responses in lower visual areas (V1-V3) is thought to occur through feedback activity from higher (MT and V5) visual areas (Hupé et al., 1998). These nonmultiplicative gain changes are consistent with the effects that we have demonstrated here for barrages of synaptic activity: weak inputs are enhanced to a greater extent than strong ones.
What are the possible cellular mechanisms of multiplicative and nonmultiplicative changes in neuronal gain?
Recently, it was shown that increases in membrane potential variance along with increases in membrane conductance (without changes in average membrane potential) may result in a decrease in the slope of the input-output firing rate of cortical neurons in response to the intracellular injection of prolonged current pulses in vitro (Chance et al., 2002). On the basis of these findings, Chance et al. (2002) proposed that decreases in background activity may underlie the multiplicative changes associated with attention and other behavioral tasks. This model, however, suffers from the requirement of precise tuning of not only excitatory and inhibitory inputs but also membrane noise versus changes in background conductance (Chance et al., 2002). It is unclear how this precise tuning may be achieved under the continuously varying membrane potential and conditions of cortical neurons. Changes in neuronal sensitivity based on membrane depolarization and increases in membrane potential variance are more robust in enhancing neuronal responsiveness because they do not require such precision of mechanism.
Together these results indicate that multiple mechanisms may be involved in modulating the response properties of cortical neurons and include, but are not limited to, rapid changes in membrane potential, conductance, and variance. Barrages of synaptic activity, generated either locally within a cortical area or by (or in response to) excitatory inputs from another cortical region, have the distinct advantage over slow modulatory transmitters in that the former can both activate and inactivate rapidly and have an almost infinite degree of flexibility in their precise spatial and temporal pattern of activation. Barrages of synaptic potentials could modulate circumscribed regions of the cortex as well as individual neurons or groups of neurons within those regions and could facilitate their interaction. Further investigation into the complex mixture of the effects of synaptic barrages on single-neuron (or even dendritic) responsiveness with local and global network dynamics will undoubtedly yield a better understanding of the control of gain within the cerebral cortex.
Footnotes
This work was supported by the National Institutes of Health (D.A.M.), the Howard Hughes Foundation (A.H.), Institute Henri Poincare, Centre National de la Recherche Scientifique, the Action Pluri-etablissements “Bioinformatique,” the European Commission (IST-2001-34712), and Bonus Qualite Recherche 3BA1 Paris XI, Action Concertee Incitative neurosciences integratives et computationnelles (T.B. and M.B.). We thank Michael Rudolf and Alain Destexhe for helpful suggestions and Gwendal Le Masson and Yann Le Franc for technical help with the real-time Neuron dynamic clamp system.
Correspondence should be addressed to David A. McCormick, Department of Neurobiology, Yale University School of Medicine, 333 Cedar Street, New Haven, CT 06510. E-mail: david.mccormick{at}yale.edu.
Copyright © 2003 Society for Neuroscience 0270-6474/03/2310388-14$15.00/0
↵* A.H. and Y.S. contributed equally to this work.


