

Abstract
We investigated gap-junctional coupling of rods and cones in macaque retina. Cone voltage responses evoked by light absorption in neighboring rods were briefer and smaller than responses recorded in the rods themselves. Rod detection thresholds, calculated from noise and response amplitude histograms, closely matched the threshold for an ideal detector limited by quantal fluctuations in the stimulus. Surprisingly, cone thresholds were only approximately two times higher. Amplitude fluctuations in cones could be explained by a Poisson distribution of photoisomerizations within a pool of seven or more coupled rods. Neurobiotin coupling between rods and cones was consistent with our electrical recordings, with approximately six rods labeled per injected cone. The spatial distribution of tracer-coupled rods matched the light-evoked cone receptive field. The gap junction inhibitor carbenoxolone abolished both electrical and tracer coupling. Amplitude fluctuations in most rods were accounted for by the expected rate of light absorption in their outer segments. The fluctuations in some rods, however, were consistent with a summation pool of up to six rods. When single rods were injected with Neurobiotin, up to 10 rods were labeled. Rod-rod and rod-cone electrical coupling is expected to extend the range of scotopic vision by circumventing saturation at the rod to rod-bipolar cell synapse; however, because coupling also renders the rod synapse less effective at separating out photon signals from dark noise, coupling is expected to elevate the absolute threshold of dark-adapted observers.
Introduction
The light-evoked signals of rod photoreceptors in mammalian retina are transmitted via chemical synapses to bipolar cells and via gap junctions to cone photoreceptors (Nelson, 1977; Schneeweis and Schnapf, 1995; Bloomfield and Dacheux, 2001; Tsukamoto et al., 2001). Gap junctions have been observed at the tips of telodendria projecting from cone synaptic terminals to both rod and cone synaptic terminals (Raviola and Gilula, 1973; Tsukamoto et al., 1992). In rodent but not primate retina, gap junctions have also been observed between rods (Tsukamoto et al., 2001).
A portion of the light response in a cone can be attributed to photon absorption in coupled rods, as evidenced by its temporal, spectral, and adaptational properties (Schneeweis and Schnapf, 1995, 1999). The importance of rod-cone coupling for vision remains uncertain. Human psychophysical studies suggest that rod signals are processed by two distinct neural pathways (Conner and MacLeod, 1977; Sharpe et al., 1989b; Stockman et al., 1991). The slower more sensitive pathway was postulated to involve the transmission of rod signals to rod-bipolar cells, and the faster less sensitive pathway was postulated to involve transmission of rod signals through coupled cones to cone-bipolar cells. One goal of this study was to compare in rods and cones the noise, kinetics, and sensitivity of rod photon signals. We found that rod signals are high-pass filtered in cones and that rod and cone detection thresholds are surprisingly similar.
Photon signals in primate rods stand out clearly above the electrical noise in the dark; when “optimally filtered,” the peak amplitude of the response to a single photoisomerization is approximately five times larger than the SD of the dark noise (Baylor et al., 1984; Schneeweis and Schnapf, 2000). The human visual system, however, integrates signals across a pool of ∼104 rods (Graham and Bartlett, 1939). With linear summation, the size of a single photon response relative to the pooled dark noise is expected to be 100 times smaller than the signal-to-noise ratio of a single rod. Thus it is remarkable that human observers can detect stimuli evoking only 10 photoisomerizations (Sharpe, 1990); the signal-to-noise ratio for this stimulus would be only ∼0.5. Considering the problem of rod summation, Baylor et al. (1984) proposed that the rod synapse filters out low-amplitude dark fluctuations and preferentially transmits the larger photon responses. The existence of such a nonlinear filter at the synapse between rods and rod-bipolar cells has been confirmed by electrical recordings in mouse retina (Field and Rieke, 2002; Robson et al., 2004). We were surprised, therefore, to discover that macaque rods are electrically coupled to one another by gap junctions; coupling will render synaptic thresholding less effective at separating out signals from noise. We used computer simulation to explore the effects of gap-junctional coupling on visual detection in human observers.
Materials and Methods
Retinal preparation. Membrane voltage was recorded from rod and cone photoreceptors from 11 cynomolgus monkeys (Macaca fascicularis) and 4 rhesus monkeys (Macaca mulatta). No differences were found in the physiology of the two species. Monkeys were housed and cared for according to guidelines established by the National Institutes of Health. All procedures were approved by the University of California San Francisco Committee on Animal Research, which has approved assurance from the Office of Protection from Research Risks at the National Institutes of Health.
Enucleation was performed under general anesthesia. The eye was hemisected just anterior to the ora serrata. The vitreous was removed, and the eyecup was placed within a light-tight container in 36°C bicarbonate-buffered Ames' solution (Sigma, St. Louis, MO) equilibrated with 95% O2/5% CO2. The retina was dark adapted for a minimum of 1 h. All subsequent procedures were performed under infrared illumination with the aid of infrared image converters.
A 4 × 4 mm piece of retina was isolated and placed photoreceptor side up in the recording chamber. Photoreceptors were visualized with infrared Nomarski optics through an upright microscope and a 40× water immersion objective. To give recording electrodes clean access to photoreceptor plasma membranes, the retina was incubated for 3-15 min in Ames' solution containing the following enzymes (in U/ml): 80 collagenase, 300 hyaluronidase, 500 deoxyribonuclease, and 0.2 chondroitin ABC lyase. The enzymes collagenase CLSPA, hyaluronidase HSEP, and deoxyribonuclease I DPFF were obtained from Worthington Biochemical (Lakewood, NJ). Chondroitin ABC lyase 190334 was obtained from ICN Biochemicals (Aurora, OH). After enzyme treatment, the retina was superfused with bicarbonate-buffered Ames' medium. The bath temperature was maintained at 36°C (Cell Micro Controls, Norfolk, VA).
Electrical recording and light stimulation. Membrane potentials of rods and cones were measured with the whole-cell perforated-patch method (Horn and Marty, 1988; Schneeweis and Schnapf, 1995) at retinal eccentricities of ∼1 cm from the fovea. The electrode solution contained (in mm): 130 K-gluconate, 10 KCl, 4 MgCl2, 10 HEPES, 3 ATP-Na2, 1 GTP-Na3, and 0.12 amphotericin B, and was titrated to pH 7.25 with KOH. The chemicals were obtained from Sigma.
The electrical signals were recorded with an Axopatch 2D amplifier (Molecular Devices, Union City, CA). Signals were low-pass filtered by the Axopatch four-pole Bessel analog filter with a cutoff frequency of 2 kHz and by an eight-pole Bessel analog filter (Frequency Devices, Haverhill, MA) with a cutoff frequency of 250 Hz. Additional digital filtering of signals shown in the figures is indicated in the figure legends. Phase shifts resulting from the filtering were corrected. Membrane voltage was corrected for the electrode junction potential. Data acquisition, analysis, and stimulus presentation were performed with a Macintosh G4 computer, an ITC-18 interface (Instrutech, Port Washington, NY), and the program Igor Pro Carbon 4.0 (Wavemetrics, Lake Oswego, OR). Signals were digitized at 2 or 5 kHz.
Photoreceptors were stimulated with unpolarized light incident perpendicular to the retinal surface. Unless indicated otherwise, light flashes were 500 nm and 10 ms in duration. Light intensity was calibrated before each experiment with a radiometer (model 350; UDT Instruments, Baltimore, MD). The expected number of photoisomerizations (R*) evoked per rod was estimated from the product of the measured photon density (i) and an assumed collecting area of photon capture (AC) of 1.0 μm2 (Schneeweis and Schnapf, 1995).
Cones were distinguished from rods by their faster light responses (see Fig. 1) and larger cell bodies as visualized with Nomarski optics (see Figs. 7, 8, 9). Photoreceptor types were further distinguished by their relative sensitivities to flashes of 500 and 660 nm light (Baylor et al., 1984, 1987).
Data analysis. The amplitude and kinetics of rod photon signals in rods and cones were determined from the ensemble mean response to 50 or more flashes in the linear range. Results were averaged across cells by scaling the ensemble mean responses of individual cells to a normalized peak amplitude and peak time and then averaging across the population of rods or cones. The population average was then rescaled to reflect the average peak amplitude and peak time. The amplitude distributions of the temporal frequency components of the photon responses were characterized from the fast Fourier transform of rod and cone population averages.
A matched filtering method was used to determine the distribution of response amplitudes to dim flashes (Baylor et al., 1979). In brief, responses to 50-150 flashes of a fixed intensity were recorded, and the ensemble mean response was calculated. The ensemble mean was fit with the impulse response of a third-order low-pass filter to create a response template. The peak amplitude of an individual response r was taken as the peak amplitude of the response template, scaled to minimize the squared differences between the individual response and the template. Response linearity and stability were verified by interleaving flashes of two intensities in blocks of ∼50 responses.
For a given flash photon density i, two amplitude histograms were constructed: a signal histogram pS(r) obtained from flash-evoked responses, and a dark noise histogram pN(r) obtained from recordings in intervening dark periods. The fit to the mean flash response was used as the scaling template for both the flash-evoked and dark histograms. The dark histograms were fit to Gaussian distributions with SDs σ0. The signal histograms were fit to a theoretical function fS(r), which assumed that the number of photoisomerizations was Poisson distributed within an electrical coupling pool of N rods and that the response amplitudes were dispersed by baseline dark noise and variability in the size of the single photon response. The equation, modified from Baylor et al. (1979) is as follows:  (1)
(1)
where a is the average peak amplitude of a single photon response, σ0 is the SD of the dark noise, and σ1 is the SD in the peak amplitude of a single photon response. The value for σ0 was taken from the fit of pN(r) to a Gaussian distribution. For the rod histograms, σ1 was adjusted to minimize the squared differences between the measured and theoretical functions. For cone histograms, σ1 was fixed to 0 because empirically σ1 ≪ σ0. On the assumption that the ensemble variance is dominated by variability in the number of photoisomerizations, the values of a and N were determined from the peak amplitudes μE and  of the light-evoked ensemble mean and variance, respectively, from
  and
and  (Schneeweis and Schnapf, 1995). These calculations make the simplifying assumption that electrical coupling is “perfect,” i.e., photon responses are equivalent in all coupled rods. To the extent that a varies within the coupling pool, the value of N can be viewed as the effective pool size, and a can be viewed as the equivalent photon response amplitude. The probability PC that the amplitude of the response to a flash exceeded the amplitude measured in the dark was calculated as follows:
  (2)
(2)
Detection threshold, defined as the value of i where PC = 0.73, was calculated by linear interpolation from the measured values of PC close to 0.73.
Network modeling. Rod amplitude histograms were used to model the effects of rod-rod coupling on the absolute sensitivity of dark-adapted human observers. The signal and noise amplitude distributions of coupled and uncoupled rods were simulated from Equation 1 at varying flash strengths (R*/rod = iAC) and pool sizes (N). Assuming perfect coupling, we took the constants in Equation 1 to be as follows: a = 1/N mV,  mV, and σ1 = 0.4/N mV. The effects of spontaneous photopigment isomerizations were included, with an assumed rate of 0.0063 R* rod-1 s-1 (Baylor et al., 1984). We assumed that spontaneous isomerizations occurring within the rod integration time (400 ms) were indistinguishable from flash-evoked isomerizations. The integration time was obtained from the time integral of the normalized flash response. Given that the rod synapse preferentially transmits photon signals while selectively filtering out the lower amplitude dark noise (Field and Rieke, 2002), the dark and light histograms were modified by a nonlinear operation like that described in mouse rod synapses (Field and Rieke, 2002, their Eq. 1).
The rod to rod-bipolar cell synapse saturates with stimuli evoking more than ∼1 R*/rod (Robson and Frishman, 1995; Berntson et al., 2004). Saturation is insignificant, however, for dark-adapted thresholds when retinal illumination is uniform, because the probability of two or more R* occurring in one rod at the threshold intensity is very small. For spatially restricted stimuli, however, the photon density of the threshold stimulus increases with decreasing stimulus diameter, so saturation needed to be included. To account for saturation, response amplitudes ≥2 mV were set to 2 mV.
We assumed that after these nonlinearities, signals were summed linearly across 104 rods (Graham and Bartlett, 1939). The pooled histograms of the 104 rod detection pool were derived as sums of MonteCarlo-simulated data generated from single rod histograms by the transformation method (Press et al., 1992). Equation 2 was used to calculate PC of the pool. For comparison with a human psychophysical two-alternative forced-choice task with a criterion of 73% correct (Sharpe, 1990), we calculated the total number of flash-evoked R* within the detection pool required to achieve a PC of 0.73.
Tracer coupling. The tracer coupling of rods and cones in macaque retina was examined by including Neurobiotin (Vector Laboratories, Burlingame, CA) and Lucifer yellow (Sigma) in the patch electrode. Lucifer yellow, which does not diffuse across photoreceptor gap junctions (Hornstein et al., 2004), was used to identify the recorded cell. The patch solution contained (in mm): 127 K-gluconate, 4 MgCl2, 10 HEPES, 3 ATP-Na2, 1 GTP-Na3, 12.4 Neurobiotin chloride, and 0.58 Lucifer yellow dipotassium. Solutions were titrated to pH 7.25 with KOH. The tracer was loaded into photoreceptors by recording from cells in whole-cell mode for ∼5-10 min. Whole-cell recording allowed the tracer to diffuse readily from the electrode solution into a photoreceptor, but it did not support the maintenance of normal cell function much beyond 10 min. This duration was sufficient to allow us to determine the spectral type of the tracer-injected cell, the magnitude of rod input in cones, and the receptive field shape. Determination of the detection threshold and coupling pool size N required longer recording times; consequently, these values were obtained with the perforated-patch method in a population of cells separate from those labeled by tracer injection.
Twenty minutes to 1.5 h after tracer loading, the retina was placed in 4% paraformaldehyde in sodium phosphate buffer (0.1 m) for 0.5-2 h. The retina was then rinsed in phosphate buffer and incubated overnight in a 1:200 dilution of streptavidin/cyanine 3 (Jackson ImmunoResearch, West Grove, PA) and 0.3% Triton X-100 in phosphate buffer. Finally, the retina was rinsed in phosphate buffer and coverslipped with Vectashield (Vector Laboratories). Cells were imaged with an LSM 5 Pascal confocal microscope (Zeiss, Oberkochen, Germany) or an RT Spot camera (Diagnostic Instruments, Sterling Heights, MI) mounted on a Zeiss Axioskop microscope. Serial reconstructions of rods and cones were made from z-stacks of confocal images with the isosurface routine in MatLab 6.5 (MathWorks, Natick, MA). Neurobiotin was also injected into rods from a single squirrel monkey, Saimiri sciureus. The resulting pattern of tracer coupling was indistinguishable from that found with macaque rod injections.
Results
Rod photoresponses in cones
Rod and cone voltage responses were measured as a function of flash intensity (Fig. 1A,B). The cone photovoltage is composed of two kinetically distinct components: a fast component with peak amplitudes that can exceed 25 mV and a slow component with peak amplitudes of up to 6 mV, but more typically 1-2 mV (Fig. 1B). The fast component arises primarily from phototransduction in cone outer segments (Schneeweis and Schnapf, 1995, 1999). The slow component arises from phototransduction in rods that are coupled to the cone through gap junctions (Schneeweis and Schnapf, 1995, 1999) and is the subject of this study. Rod signals were evident in 90% of the red and green cones recorded (n = 144), with no observed differences between the two cone types. Rod input was not seen in the two recorded blue cones.

Rod signals measured in cones and rods. A, B, Photovoltage responses in a rod (A) or cone (B) to flashes of increasing flash strength ranging from 0.3 to 803 photons μm-2 in A and 2.0 to 3874 photons μm-2 in B. Traces are averages of one to four responses. A, Bandwidth, DC-20 Hz. B, Bandwidth, DC-50 Hz. C, D, Response fluctuations to dim flashes in a rod (C) or cone (D). The smooth curves through the noisy measured responses are the scaled response templates from matched filtering. Flash photon densities are 1.0 photons μm-2 (C) and 2.0 photons μm-2 (D); bandwidth, DC-5 Hz.
The rod component of the cone response was smaller in amplitude but kinetically similar to the photovoltages recorded directly in rods. To compare rod and cone responses in detail, we recorded photovoltages in response to flashes of 500 nm light that evoked on average between 0.25 and 2.0 R*/rod. At these low light levels, the contribution of cone phototransduction to the cone photovoltage is negligible (Schneeweis and Schnapf, 1999). In part, the trial-to-trial variability in response amplitude reflects fluctuations in the number of photons absorbed (Baylor et al., 1979; Schneeweis and Schnapf, 1995). Response variability was smaller in cones than in rods (Fig. 1C,D), presumably because cones averaged signals within the pool of coupled rods and because the voltage evoked by a rod photoisomerization was smaller in cones than in rods.
In a population of 13 cones and 7 rods from 10 animals, the peak amplitude of the rod photon response recorded in cones was approximately eight times smaller than the response recorded directly in rods: 0.11 ± 0.10 mV rod/R* (mean ± SD) in cones and 0.86 ± 0.35 mV rod/R* in rods (Fig. 2A). Differences in response amplitude were accompanied by a twofold difference in the time to the peak of the response: 112 ± 25 ms in cones and 215 ± 31 ms in rods (Fig. 2B). The smaller and faster cone responses indicate high-pass filtering within the rod-cone coupling network. To characterize these filtering properties, the temporal frequency components of the responses were calculated from the Fourier transform of the averages (Fig. 2C). At the lowest temporal frequencies, the cone response was attenuated by a factor of ∼10 compared with the rod response, whereas at higher frequencies the rod and cone functions converged. High-pass filtering has been described previously for electrically coupled rods in salamander, turtle, and frog retinas (Detwiler et al., 1978; Attwell and Wilson, 1980; Torre and Owen, 1983), where it was attributed to voltage-dependent conductances.
Response variation
If responses to single photons were all stereotypic in shape, then the waveform of the ensemble variance would be proportional to the square of the waveform of the ensemble mean. Instead, for both rods and cones, the variance was somewhat longer lasting than the squared mean (Fig. 3). These differences in waveform might reflect trial-to-trial variation in the duration of light-activated rhodopsin in individual rod outer segments (Schneeweis and Schnapf, 1995; Rieke and Baylor, 1998; Whitlock and Lamb, 1999). Alternatively, light responses generated by photon absorption in rods that are distant from the recorded cell could have kinetics that are different from those generated in the impaled rod (Detwiler et al., 1978). The positional dependence of the response waveform was not evaluated in this study.
Assuming that the number of photoisomerizations evoked by a flash of fixed intensity is Poisson distributed, the peak amplitude a of the average single photon response can be estimated from  , the ratio of the peak amplitudes of the ensemble variance and mean. In 9 of 13 cones, the light-evoked variance was too small to resolve. For the remaining four cones in which the variance was large enough to measure, a was 0.051 ± 0.022 mV. In the same population of four cones, the effective number of rods coupled to a cone, calculated from
  , was 2.2 ± 1.1. Because we were constrained to analyze cones with variances that were atypically large, these estimates are biased toward large values of a and small values of N.
Electrical coupling between rods
The value of a calculated in 10 rods was 0.64 ± 0.48 mV. In eight of these rods, N was close to 1 (1.4 ± 0.9; mean ± SD), as would be expected for rods that are uncoupled from neighboring rods (Schneeweis and Schnapf, 1995; Tsukamoto et al., 2001). Unexpectedly, however, N was considerably larger for two rods: 5.2 and 5.9. The estimate of N was independent of stimulus intensity. As expected for a Poisson process, both the mean and variance increased linearly with flash strength (Fig. 4); however, the relative slopes of these two functions were inconsistent with photon capture in a single rod outer segment. For an uncoupled rod, the slope of the variance function ( ) should be equal to the square of the slope of the mean function (μE/AC i)2. Instead, for the cell in Figure 4, (
 ) was 5.2 times smaller than (μE/AC i)2, consistent with responses generated by the summation of signals in a pool of approximately five rods.
The calculation of N depends critically on estimates of the photon capture rate and hence on the assumed value of AC (1.0 μm2). As an alternative to rod-rod coupling, the unusual intensity dependence of these rods could be explained by an atypically large collecting area. If that were the case, however, flash sensitivity (SF) would also be five times larger, and the incident photon density that evoked a half-maximal response (i1/2) would be five times smaller. Instead, the mean values from these two rods (SF = 1.2 mV photon-1 μm2; i1/2 = 23 photons μm-2) were close to average values of the five rods in which N was estimated to be <2 (SF = 0.83 mV photon-1 μm2; i1/2 = 19 photons μm-2). Although we cannot rule out the possibility that some rods have both larger collecting areas and correspondingly smaller photon responses, the simplest explanation of the results, also consistent with tracer coupling experiments described below (in Rod-rod tracer coupling), is that some rods are coupled by gap junctions to other rods.

High-pass filtering of rod signals in cones. A, Dim flash responses averaged across 7 rods (dashed trace) and 13 cones (solid trace) and normalized by photoisomerizations per rod. See Materials and Methods for averaging procedure. Bandwidth, DC-10 Hz. B, Same responses as in A on an expanded time scale, with cone response rescaled to match rod response peak. C, Amplitude density of the Fourier components of the flash responses in A.

Response fluctuations in dim light. Ensemble variance (solid line) and square of ensemble mean (dashed line) recorded in a rod (A) and cone (B) from 100-147 flashes. Flashes = 0.5 photons μm-2 (A) and 2.0 photons μm-2 (B). Bandwidth, DC-5 Hz.
Detection threshold
Reliable detection of dim light is limited both by variations in the number of photons absorbed and by neural noise (de Vries, 1943; Rose, 1948; Barlow, 1956, 1957). Detection limitations in 10 rods and 16 cones were evaluated from dark and flash-evoked amplitude histograms. The cone responses evoked by the dim 500 nm flashes were generated by their rod inputs. Response amplitudes were measured by using a matched-filter technique (see Materials and Methods), on the basis of the idea that photoreceptor outputs are “optimally” filtered by the visual system to extract photon signals from the underlying noise (Baylor et al., 1979; Schnapf and Copenhagen, 1982; Bialek and Owen, 1990). The histograms measured in the dark were well fit by Gaussian distributions with SDs of 0.46 ± 0.14 mV (rods) (Fig. 5A) and 0.14 ± 0.08 mV (cones) (Fig. 5B). The larger dark noise in rods is caused in part by the larger input impedance of rods (∼1.2 GΩ) as compared with cones (∼0.1 GΩ).

Evidence of rod-rod signal coupling. A, Average rod response at three flash strengths. Bandwidth, DC-5 Hz; 142-147 responses per average. B, Circles plot peak amplitude of mean responses in A as a function of flash strength. The line is the least squares fit of the data points to a line intersecting the origin (slope, 1.17 mV per R*/rod). C, Ensemble variance of the same responses as in A. D, Circles plot peak amplitude of the variance in C as a function of flash strength. The solid line is the best linear fit through the origin (slope, 0.265 mV2 per R*/rod). Dashed line indicates the expected function of an uncoupled rod. From the slopes in B and D, a = 0.23 mV and N = 5.2 rods.

Probability density distribution of response amplitudes of a rod (A, C) and cone (B, D). Dark noise histograms pN (A, B) and signal histograms pS (C, D), obtained from matched filtering, are plotted by the bars. Number of trials = 675-805 (A, B) and 143-149 (C, D). Flash strength = 1.0 photons μm-2. Smooth curves drawn through noise histograms are Gaussian distributions with SD σ0 = 0.43 mV (A) and 0.12 mV (B). Smooth curves through signal histograms are from Equation 1, with the constants in C and D, respectively: i = 1.0, 1.0 photons μm-2; a = 0.23, 0.049 mV; N = 5.2, 3.1 rods; σ0 = 0.43, 0.12 mV; and σ1 = 0.03, 0 mV. PC = 0.95 (A, C), and PC = 0.82 (B, D).
In some rods, the flash-evoked histograms were multimodal (Schneeweis and Schnapf, 1995), reflecting the quantal nature of photon absorption of uncoupled rods (Baylor et al., 1979); however, in other rods and all cones (Fig. 5C,D), multiple peaks in the flash histograms were not evident. These histograms could be accounted for by a Poisson distribution of photoisomerizations in a pool of coupled rods (Eq. 1).

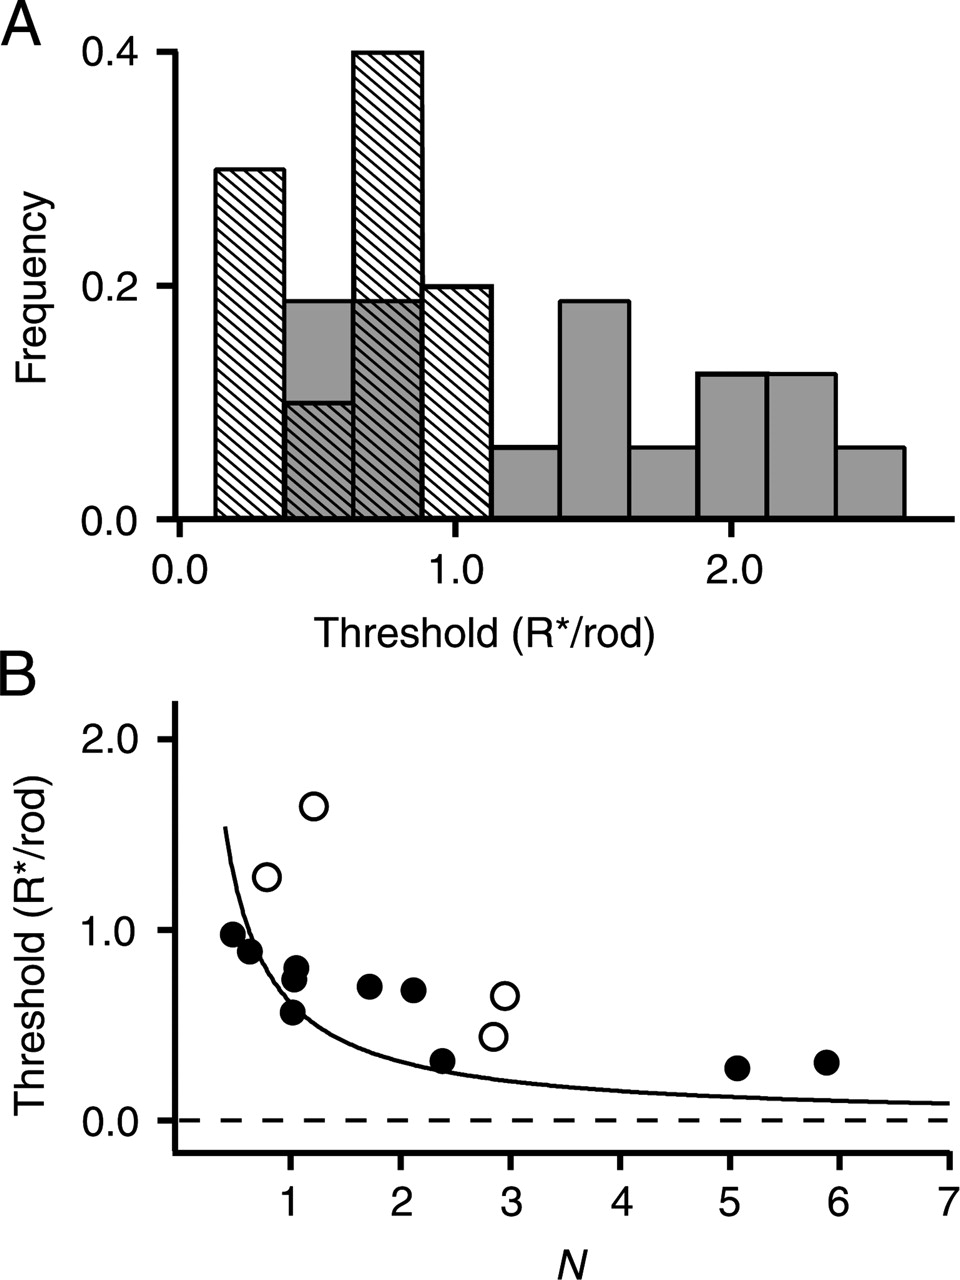
Detection thresholds of rods and cones. A, Frequency distribution of thresholds (at PC = 0.73) from 10 rods (striped bars) and 16 cones (shaded bars). B, Electrical coupling reduces detection threshold. Thresholds versus rod pool size N in 10 rods (•) and 4 cones (○). N was obtained from variance and means analysis (see Materials and Methods). Smooth curve is for an ideal (noiseless) detector, given by -[ln(0.54)] N-1 R*/rod.
The noise and signal histograms were used to calculate the fraction of trials in which the amplitude of the response to a flash exceeded the amplitude in the dark (Eq. 2). This fraction PC is equivalent to the probability of making a correct choice in a two-alternative forced-choice psychophysical detection paradigm (Green and Swets, 1966). For a given cell, PC increased with increasing flash strength in a manner expected from the Poisson distribution of response amplitudes (Eqs. 1, 2). Detection threshold was defined as the flash strength (in R*/rod) at which PC = 0.73. Surprisingly, despite the eightfold difference in rod and cone flash sensitivities, the distribution of rod and cone thresholds largely overlapped (Fig. 6A). The average thresholds in 10 rods (0.62 ± 0.25 R*/rod) and 16 cones (1.36 ± 0.69 R*/rod) differed by only a factor of ∼2.
The detection limitation imposed on cones by their lower flash sensitivity was partially offset both by lower cone dark noise and by signal averaging across multiple rods. The expected threshold at a criterion of PC = 0.73 for an ideal noiseless detector (limited only by the Poisson statistics of light) is -[ln(0.54)] N-1R*/rod. A comparison of the estimated values of threshold and N are roughly consistent with this relationship (Fig. 6B). That most of the points lie above the ideal line is expected from the added variability associated with the phototransduction noise and dark noise of “nonideal” photoreceptors.
Rod-cone tracer coupling
Tracer-coupling between rods and cones was assessed by injecting single cones with Neurobiotin. Neurobiotin was detected in the injected cone as well as in neighboring rods and cones (Fig. 7A,D). Of the 33 cone injections, 3 cones were found to be tracer coupled to both rods and cones, 18 to rods only, and 2 to cones only; 10 were uncoupled. The number of labeled rods per injected cone varied from 0 to 28, with a mean of 5.7 ± 6.7. The size of the maximal rod response in an injected cone correlated with the number of rods to which the cone was tracer coupled, with a Spearman rank-order correlation coefficient (Zar, 1999) of 0.59 ± 0.20 (p < 0.002; n = 28).

Tracer and signal coupling between rods and cones is blocked by the gap junction inhibitor carbenoxolone. A, B, Combined confocal and Nomarski contrast images of the outer nuclear layer after cone injection of Neurobiotin (green). The cone in A, injected in control solution, is coupled to neighboring rods. The cone in B, injected in the presence of 100 μm carbenoxolone, was not tracer coupled to other cells. C, Rod responses measured in a cone in control solution (top) and again after application of 100 μm carbenoxolone (bottom). Flashes = 28 photons μm-2. Traces are averages of four to six responses. Bandwidth, DC-5 Hz. D, Three-dimensional reconstruction of Neurobiotin-labeled rods and cones after injection in a cone. OS, Outer segment; ONL, outer nuclear layer; OPL, outer plexiform layer. Scale bars: A, B, D, 10 μm. Results in A-D were obtained from four separate cone recordings.
To test whether the spread of Neurobiotin into neighboring photoreceptors was mediated by gap junctions, cones were injected with Neurobiotin in the presence of the gap junction inhibitor carbenoxolone (100 μm). Under these conditions, only the recorded cone was labeled (Fig. 7B) (n = 4). Carbenoxolone also abolished the rod component of the cone light response (Fig. 7C) (n = 4). The abolition of the rod component further supports the tracer-coupling result, although a direct inhibitory effect of carbenoxolone on rod phototransduction (Verweij et al., 2003) or other photoreceptor conductances (Xia and Nawy, 2003; Vessey et al., 2004) has not been ruled out.
Close contacts between colabeled rods and cones (Fig. 7D) were observed at their synaptic terminals, the location of rod-cone gap junctions described previously from electronmicroscopic studies in primate retina (Raviola and Gilula, 1973; Tsukamoto et al., 1992). Unexpectedly, the pattern of labeled rods was often not symmetrical around the recorded cone. Instead, the pattern tended to be skewed toward one side of the cone (Figs. 7A, 8A). By means of hemicircular light stimuli to map out the spatial distribution of rod inputs in the cone, the skewed distribution of tracer coupling was found to match the skewed receptive field (Fig. 8B) (n = 4). The anatomical basis of the spatial distribution is unclear. There was no relationship between the orientation of the skew and retinal eccentricity, the direction of the fovea, or left versus right eye. There was a tendency for tracer-filled rods to lie in the direction of the recording electrode; that is, labeled rods were found preferentially on the electrode side of the cone in 54% of cone injections, on the side opposite the electrode in 23% of injections, and on both sides in the remaining 23%. This observation suggests that the electrode might alter the coupling efficiency of the rod-cone junctions by mechanical disturbance. Whatever the mechanism responsible for the skewed field, it appears not to involve tracer uptake via an extracellular route, as evidenced by the correspondence in the patterns of tracer and electrical coupling and the suppression of tracer coupling by carbenoxolone.

Correspondence of tracer coupling and receptive field. A, Neurobiotin labeling (green) of rods coupled to injected cone (asterisk). Scale bar, 10 μm. B, Rod responses in the cone shown in A to flashes of light covering a hemifield rotated around the recorded cone. Traces are averages of 6-12 responses to flashes of 16 photons μm-2. Bandwidth, DC-5 Hz. Cone membrane potential was recorded in whole-cell mode. Symbols to left of traces denote orientation of the stimulus hemifield relative to the recorded cone.
Rod-rod tracer coupling
Of the 35 rods injected with Neurobiotin, 11 (31%) were not tracer coupled to neighboring photoreceptors (Fig. 9A). The remaining 69% were coupled to one or more additional rods (Fig. 9B). Sites of close contact between colabeled rods were often found in regions containing rod cell bodies, inner segments, and passing rod axons (Fig. 9C), the region described in mouse retina where rod-rod gap junctions are located (Tsukamoto et al., 2001). Some labeled rods had no apparent sites of physical contact with labeled neighboring rods (Fig. 9C), although the occasional presence of faintly labeled “ghost” cells suggests that intervening labeled cells may have been lost during tissue processing.

Tracer and signal coupling between rods. A, B, Combined confocal and Nomarski contrast images after Neurobiotin injection of single rods. Only the injected rod is labeled in A; four rods were labeled in B. C, Three-dimensional reconstruction of rods in B. OS, Outer segment; ONL, outer nuclear layer; OPL, outer plexiform layer. Scale bars: A-C, 10 μm. D, Frequency distribution of rod pool size (N). Tracer coupling is indicated by green bars. Signal coupling, determined from mean and variance analysis of dim flash responses, is indicated by striped bars. N = 1 indicates an uncoupled rod.
The total number of rods labeled with rod injection of Neurobiotin ranged from 1 to 10, with an average of 3.4 ± 2.6 (n = 35). The distribution in the number of tracer-coupled rods overlapped with the distribution of N, the effective number of electrically coupled rods calculated from the mean and variance analysis (Fig. 9D). The spread of Neurobiotin from rods to cones was rare. Rod-cone tracer coupling was observed in only 2 (6%) of 35 rod injections as compared with 64% of cone injections.
The effects of rod-rod coupling on detection
The rod to rod-bipolar cell synapse is highly nonlinear, transmitting signals over a narrow range of rod membrane potentials. The synapse attenuates fluctuations in membrane potential close to the dark potential, and it saturates with light-evoked hyperpolarizations of only a few millivolts (Robson and Frishman, 1995; Field and Rieke, 2002; Berntson et al., 2004). Thus the synapse effectively transmits single photon responses at high gain and attenuates both dark noise and multiple photoisomerizations within single rods. Electrical coupling of rods will affect photon signaling at both ends of the transmission range. Coupling will reduce the size of the single photon response relative to the dark noise in a single rod, thus rendering the rod synapse less effective at separating dark noise from single photon responses (Smith et al., 1986; Field and Rieke, 2002). At the same time, the spread of photon signals within the pool of coupled rods reduces the effects of synaptic saturation (Tessier-Lavigne and Attwell, 1988). To investigate the effects of rod-rod coupling on the detection of dim light, the sensitivity of dark-adapted observers was modeled from the signal and noise histograms of single rods and a theoretical detection pool of 104 rods (see Materials and Methods). For uniform illumination of a detection pool of uncoupled rods, the model estimated a threshold (at PC = 0.73) of 9 R*, a value nearly identical to the 10 R* estimated in human psychophysical tests at a criterion of 73% correct (Sharpe, 1990). Electrical coupling of rods increased threshold. For an assumed coupling pool size of two rods, close to our measured average of N, threshold increased to 15 R*. With more extensive coupling, the threshold continued to increase, asymptotically approaching 35 R* (Fig. 10A), the threshold expected for uncoupled rods that lack a dark noise synaptic filter.

Effect of rod-rod coupling on psychophysical thresholds of dark-adapted human observers. A, Psychophysical threshold (R*) in a two-alternative forced-choice experiment, calculated from model simulations, as a function of rod pool size N (for details of the model, see Materials and Methods). The shaded region represents the range of experimentally determined electrical pool sizes of macaque rods (N = 1-6). The dashed line indicates the expected threshold in the absence of synaptic nonlinearities. B, Psychophysical threshold intensity of coupled rods (RC *) relative to uncoupled rods (RU *) as a function of stimulus diameter, with N = 2. Coupling lowered threshold (RC */RU * < 1) for stimulus diameters <0.066° (arrow).
Including synaptic saturation in the model did not affect thresholds for uniform illumination because the likelihood of two or more R* occurring in the same rod at the dark-adapted threshold intensity was miniscule. Saturation became a significant factor, however, as the stimulus diameter was reduced and photon density increased. Consequently, although detection thresholds for diffuse light were elevated by electrical coupling, thresholds for small-diameter stimuli were actually reduced by electrical coupling (Fig. 10B). For an assumed saturation level of 2 mV and a pool size of two rods, electrical coupling lowered dark-adapted thresholds relative to that of uncoupled rods for stimulus diameters <0.066° visual angle. This critical diameter was largely insensitive to the assumed degree of coupling (N) but depended on the assumed level of saturation. With lower saturation levels, electrical coupling became beneficial with larger stimulus diameters. The critical diameter also increases with background illumination (data not shown) because backgrounds elevate the threshold intensity of the test flash and hence increase the likelihood of multiple R*/rod.
Discussion
Temporal properties of rod-cone coupling
By using dim flashes to assess the temporal properties of coupling, we found that rod signals were high-pass filtered in cones: the low-frequency components of the signals were preferentially attenuated. Because the energy of the dim flash response is limited to frequencies <10 Hz, the transfer of higher-frequency signals could not be assessed by this method. A previous study in macaque retina showed that higher frequency signals (>10 Hz) were also attenuated (Schneeweis and Schnapf, 1999). Together, these results indicate that the rod-cone coupling network in primates, like the cone-cone network (Hornstein et al., 2004), is bandpass in character. These temporal properties are reminiscent of the bandpass characteristics of the so-called π′0 mechanism of human vision (Sharpe et al., 1989a), a psychophysically defined rod signaling mechanism thought to depend on rod-cone coupling.
Pattern of tracer coupling
Rod-cone tracer coupling was observed 10 times more frequently in Neurobiotin injections of cones as compared with rods. An asymmetry of tracer spread across gap junctions has been described previously in other heterologously coupled cells (Flagg-Newton and Loewenstein, 1980; Robinson et al., 1993; Zahs and Newman, 1997) in which it was speculated to reflect an asymmetry in the free-energy barrier for permeation (Flagg-Newton and Loewenstein, 1980). An asymmetric barrier between rods and cones can arise if the rod and cone hemichannels are composed of different connexins. Consistent with this idea, immunohistochemical studies in guinea pig and mouse retina (Lee et al., 2003; Dang et al., 2004) showed that connexin Cx36 was expressed in cones but not rods. Alternatively, the observed asymmetry in rod-cone tracer flux might be caused by differences in the convergence of rod and cone contacts. In mouse retina, each rod makes gap junctional contacts with only approximately one cone, whereas each cone contacts ∼30 rods (Tsukamoto et al., 2001).
The distributions of pool sizes for rod-rod tracer and electrical coupling were similar to one another (Fig. 9D); however, if coupling forms a continuous network of rods across the retina, the precise meaning of these two measures of pool size is unclear. If, on the other hand, rods were coupled into small local syncytia as was observed in mouse retina (Tsukamoto et al., 2001), then the correspondence of tracer and electrical coupling is more straightforward. The pattern and number of tracer-coupled rods observed here is reminiscent of the radial clusters of labeled rods in rat retina derived from common progenitor cells during late retinal development (Turner and Cepko, 1987). This similarity suggests the possibility that the clusters of tracer-coupled rods observed here may reflect discrete pools of rods of common clonal lineage.
Importance of photoreceptor coupling for low-light detection
Light responses of primate rods increase in amplitude with increasing stimulus intensity up to ∼100 R*/rod (Baylor et al., 1984; Kraft et al., 1993; Schneeweis and Schnapf, 1995); however, the response in rod-bipolar cells reaches maximal size with only one or a few R*/rod (Robson and Frishman, 1995; Field and Rieke, 2002; Berntson et al., 2004). Thus, in the range of ∼2-100 R*/rod where the rod-bipolar synapses are saturated and photo-transduction within cone outer segments is minimal (Schnapf et al., 1990; Schneeweis and Schnapf, 1995), intensity encoding within the retina depends on the transmission of rod signals via pathways other than rod-bipolar cells.
Two alternative pathways have been described. One alternative is the rod-cone coupling pathway studied here. Measurements in cat and primate cones (Nelson, 1977; Schneeweis and Schnapf, 1999) show that rods transmit signals to coupled cones up to rod-saturating intensities. Our results show that in the dark-adapted retina, lights evoking fewer than two R*/rod can be reliably detected in the cone membrane potential. On the basis of theoretical considerations, Smith et al. (1986) proposed that rod-cone gap junctions are closed in dark-adapted retina. Our present measurements conflict with this hypothesis.
The second alternative pathway for rod signaling described in mouse retina (Soucy et al., 1998; Tsukamoto et al., 2001) uses a chemical synapse to connect rods to cone OFF-bipolar cells. If this connection is also present in primates, the relative contributions of this pathway and the rod-cone coupling pathway for signaling in the mesopic range need to be examined.
Applying our measurements of rod photon signals and noise to a simplified model of coupled rods, we calculated that rod-rod coupling could raise human detection thresholds for large-diameter stimuli by as much as a factor of 3.5. The deleterious impact of coupling on detection is expected to diminish with decreasing stimulus diameter, and, in fact, coupling would actually lower the detection threshold for very small stimuli. Our model yields only an approximate account of the impact of coupling on signal detection. A more complete model would include further evaluation of the temporal requirements for detection, the falloff of signal and noise amplitude with distance across of the rod network (Tessier-Lavigne and Attwell, 1988), the effects of rod-cone coupling, and additional noise contributions such as the quantal noise of synaptic transmission. The development of a more realistic model of signals and noise within a distributed network of coupled rods and cones will first require direct measurements of rod-rod and rod-cone coupling conductances. The effects of light adaptation and circadian rhythm on coupling strength also need to be examined further.
Footnotes
This work was funded by National Institutes of Health Grants R01-EY07642, F32-EY07001, and T32-EY07120, a National Science Foundation Graduate Research Fellowship, a grant from That Man May See, Inc., and additional support from Research to Prevent Blindness. We thank Drs. Loren Frank and Karen Cusato for helpful discussions.
Correspondence should be addressed to Julie L. Schnapf, Department of Ophthalmology, K227, 10 Koret Way, University of California, San Francisco, San Francisco, CA 94143-0730. E-mail: schn{at}phy.ucsf.edu.
E. P. Hornstein's present address: Molecular Devices Corporation, 3280 Whipple Road, Union City, CA 94587.
Copyright © 2005 Society for Neuroscience 0270-6474/05/2511201-09$15.00/0


