

Abstract
Object recognition is traditionally viewed as a hierarchical, bottom-up neural process. This view has been challenged recently by theoretical models and by findings indicating that top-down processes are involved in facilitating recognition. However, how such high-level information can be activated quickly enough to facilitate the bottom-up processing is yet unknown. We propose that such top-down facilitation is triggered by magnocellular information projected early and rapidly to the orbitofrontal cortex. Using human neuroimaging, we show that stimuli designed to bias processing toward the magnocellular pathway differentially activated the orbitofrontal cortex compared with parvocellular-biased stimuli. Although the magnocellular stimuli had a lower contrast than the parvocellular stimuli, they were recognized faster and just as accurately. Moreover, orbitofrontal activity predicted the performance advantage for the magnocellular, but not for the parvocellular-biased, stimuli, whereas the opposite was true in the fusiform gyrus. Last, analyses of effective connectivity using dynamic causal modeling showed that magnocellular-biased stimuli significantly activated pathways from occipital visual cortex to orbitofrontal cortex and from orbitofrontal cortex to fusiform gyrus. Conversely, parvocellular-biased stimuli significantly activated a pathway from the occipital visual cortex to fusiform gyrus. Our findings support the proposal that fast magnocellular projections linking early visual and inferotemporal object recognition regions with the orbitofrontal cortex facilitate object recognition by enabling the generation of early predictions.
- top-down facilitation
- fMRI
- inferotemporal cortex
- object recognition
- prefrontal cortex
- effective connectivity
- dynamic causal models
- vision
Introduction
Our visual system enables us to recognize objects quickly in varying viewing conditions. Object recognition has been commonly viewed as a feedforward, bottom-up process in which visual input is analyzed by a hierarchy of visual regions situated along the ventral visual stream. However, several models of object recognition have proposed that feedback, top-down information is important in facilitating object recognition (Grossberg, 1980; Kosslyn, 1994; Ullman, 1995), and others have noted that the efficiency of visual recognition cannot be fully explained by bottom-up processes alone (Mumford, 1994; Lamme and Roelfsema, 2000; Bullier, 2001). To facilitate the bottom-up processing, top-down information must be activated and available to the low-level areas before recognition is completed. A recent model specified a mechanism for such fast triggering of top-down facilitation (Bar, 2003). According to this model, a coarse version of the visual input, comprising mainly the low spatial frequencies (LSFs), is rapidly projected from early visual regions to the orbitofrontal cortex (OFC). The LSF image is sufficient to activate “initial guess” predictions about what objects might have given rise to such visual input. These predictions activate the corresponding visual representations in object processing regions in the ventral temporal cortex, which is hypothesized to facilitate recognition by biasing the bottom-up processes to concentrate on a small set of the most likely object representations (Fig. 1). This model has received strong support from a recent study integrating functional magnetic resonance imaging (fMRI) and magnetoencephalography (MEG) (Bar et al., 2006), which found that OFC is differentially activated by images containing LSF information and that this activation occurs early (∼130 ms) in the recognition process, critically preceding activity in inferotemporal cortex (IT).

An illustration of the top-down facilitation model. A partially processed, LSF image of the visual input is rapidly projected to OFC from early visual regions, although detailed slower analysis of the visual input is being performed along the ventral visual stream. This “gist” image activates predictions about candidate objects similar to the image in their LSF appearance, which are fed back to the ventral object recognition regions to facilitate bottom-up processing.
We propose that such rapid activation of OFC is triggered by a magnocellular (M) projection to OFC, which generates “initial guesses” based on M information. The M pathway is known to convey low-resolution, achromatic information rapidly (Maunsell et al., 1990; Shapley, 1990; Merigan and Maunsell, 1993; Bullier and Nowak, 1995; Chen et al., 2006). Conversely, parvocellular (P) and the much fewer koniocellular (K) neurons conduct information more slowly and can resolve fine details and chromatic contrast but require substantially higher luminance contrast (>8%) (Tootell et al., 1988) to detect achromatic stimuli (Hicks et al., 1983; Lee et al., 1990). The question of what type of information and which anatomical pathways trigger top-down facilitation is critical for understanding visual recognition, and it has never been tested explicitly. Therefore, the purpose of this study was to examine directly whether OFC could generate predictions from rapidly available M information by probing it with stimuli designed to bias visual processing toward either the M or P pathway. Because this M projection would convey predominantly M-biased visual information, we hypothesized that M-biased stimuli would activate OFC to a significantly greater extent than would P-biased stimuli. Furthermore, observers should be able to use top-down information earlier with an M projection to OFC and a subsequent feedback of predictions from OFC to IT, and therefore show improved recognition performance for M-biased stimuli.
Materials and Methods
Stimuli.
We used line drawings of objects that were either of low-luminance contrast and achromatic (M-biased), or chromatically defined and isoluminant (red-green; P-biased), to examine directly which of the two main pathways is used to trigger top-down facilitation in object recognition (Fig. 2). The third, koniocellular, pathway inputs are very few compared with the M and P projections, which constitute the vast majority of inputs into V1 (Callaway, 2005) and would not be sensitive to the red-green or achromatic, low-luminance-contrast stimuli in any case because of their response properties (Casagrande, 1994; Hendry and Reid, 2000). M- and P-biased stimuli have been shown in the past to be effective in studying visual search and attention (Steinman et al., 1997; Cheng et al., 2004) and M- and P-biased letter and mask stimuli have also been used in studying visual perception abnormalities in schizophrenia (Schechter et al., 2003; Butler et al., 2006). We chose to use line drawings rather than pictures of objects, because the uniform foreground of line drawings allows precise control over the luminance and chromatic properties of the stimuli that was necessary for this experiment. We used 160 line drawings of everyday objects as stimuli in this study; 40 line drawings were used solely to determine the stimulus characteristics essential to the experimental manipulation in separate pretesting stages and were not seen in the experiment proper. These characteristics, namely the foreground–background luminance contrast for the achromatic, M-biased, stimuli, and the isoluminance values for the chromatic stimuli, differ somewhat between individuals. Therefore, they were established for each participant immediately before commencing functional scanning, with the participant positioned in the scanner and with the exact viewing conditions subsequently used in the experiment proper. The following procedures used to establish the isoluminance point and the appropriate luminance contrast are standard techniques and have been successfully used in many studies exploring the M and P pathway contributions to attention, visual search, schizophrenia, and dyslexia (Steinman et al., 1997; Schechter et al., 2003; Cheng et al., 2004; Butler et al., 2006). The appropriate luminance contrast was determined by first finding the luminance threshold via a multiple staircase procedure, during which the subjects were required to report whether they could recognize the stimulus. One-fourth of the trials were catch trials in which the stimulus did not appear. Our luminance threshold-finding algorithm computed the mean of the turnaround points above and below medium-gray background and reliably converged around the true background value. From this threshold, the appropriate luminance (∼3.5% Weber contrast) value was computed for the grayscale line drawings to be used in the low-luminance-contrast (M-biased) condition.

Stimuli and procedure. We used an event-related design with 33% interspersed fixation trials. M-biased, P-biased, and fixation stimuli were presented in sequences optimized for hemodynamic response estimation efficiency. The stimuli in the figure are slightly brightened to enhance visibility in print. In the experiment, the stimulus pictures appeared with a light-gray screen background to prevent adaptation to darkness.
For the chromatically defined stimuli in the isoluminant (P-biased) condition, the isoluminance point was found using heterochromatic flicker photometry with the line drawings of objects displayed in alternating colors, specifically, pure red and pure green. Briefly, this procedure allows finding an isoluminance point for two colors by having a stimulus rapidly alternate between two colors. When the alternation frequency is in the range of 12–20 Hz, the flicker caused by luminance differences between these two colors seems to disappear for a very narrow range of luminance values, and the two colors fuse. In pilot testing, we found that the alternation frequency of ∼14 Hz gave the best isoluminance point estimates (narrow range within-subjects and low variability between-subjects). The color values at which the stimulus appears steady is the (very narrow) isoluminance interval. Subjects were required to report via a key press whether the stimulus was flickering or appeared steady. Depending on the response, the output of the red gun was adjusted up or down in a pseudorandom manner so that many passes over the isoluminance point occurred during the procedure. The average of the values in the narrow range when a subject reported a steady stimulus became the isoluminance value for the subject used in the experiment. Thus, isoluminant stimuli were defined only by chromatic contrast between foreground and background, which appeared equally bright to the observer. It is important to note that the foreground brightness value for the P stimuli was substantially higher than for the M stimuli. The participants were queried after the experiments about the visibility of the stimuli. Eleven of the 12 participants reported that the P stimuli appeared more visible to them.
Subjects.
Twelve paid volunteers (20–32 years of age; eight females), recruited from the greater Boston academic community, participated in the experiment. All had normal or corrected-to-normal vision, including normal color vision and no history of neurological or psychiatric disorders, and were right-handed. Eleven of the subjects were native English speakers, and the non-native speaker was fluent in English; all had had at least 15 years of formal education. One subject was excluded from the analysis during filtering for statistical outliers. None of the subjects knew the purpose of the study. The informed consent of each participant was obtained before the experiment according to the procedures approved by Massachusetts General Hospital (Human Studies Protocol 2001P-001754).
Procedure.
In the experiment, participants were required to make an object size decision that required recognition of the stimulus, reporting whether an object they were shown was bigger or smaller than a shoe box. A third option (“Not sure”) was provided, but almost never used, likely because only stimuli with an unambiguous size relationship to a prototypical shoe box were used in the experiment. Note that this decision was orthogonal to the manipulation of interest (M-biased vs P-biased stimuli). The proportion of object size decisions (“bigger”/“smaller”) was equalized within-subjects and within-condition, and the key-press assignment was counterbalanced across subjects. Subjects were given instructions about all parts of the experiment verbally before entering the scanner, and then the same instructions were presented on the screen before each part of the experiment. Stimuli of both types were presented in a centered 256 × 256 pixel square for 1500 ms, with 480 stimulus trials collected in each condition. We used a rapid event-related design and therefore added 33% (240) null trials across four experimental runs. The event sequences were pseudorandom and optimized for hemodynamic response estimation efficiency by the rapid event-related design optimization program Optseq2 (https://surfer.nmr.mgh.harvard.edu/optseq). Stimulus presentation and behavioral data acquisition were controlled by a custom program written in MatLab (MathWorks, Natick, MA) using Psychtoolbox (Brainard, 1997) and running on an Apple G4 laptop computer with Mac OS 9 (Apple Computers, Cupertino, CA). The stimulus images were projected by a Sharp Notevision LCD projector through the head end of the scanner bore and a translucent rear-projection screen and were synchronized with functional volume acquisitions via timing pulses. Subjects viewed stimuli in a mirror integrated into the Siemens head coil. The head and viewing position were stabilized with adjustable padded head restraints and cushions. Responses were collected with a fiber-optic button box using the index, middle, and ring fingers of the right hand. The time elapsed from stimulus onset was computed on-line for each trial and stored as reaction time along with the key-press code.
Data acquisition and analysis.
All MRI scans were acquired on a 1.5T Siemens Avanto scanner with a 12-channel “TIM” system. We first obtained high-resolution, T1-weighted structural images for the reconstruction of each subject's cortical surface. The functional scans were acquired using gradient-echo EPI with a repetition time (TR) of 2.5 s, echo time (TE) of 25 ms, flip angle of 90°, and 33 interleaved slices (3.125 × 3 × 3 mm resolution with 1 mm skip), tilted anterior ∼30° up from the AC-PC line to improve signal in the orbitofrontal cortex and minimize susceptibility artifacts in OFC (Kringelbach and Rolls, 2004). We acquired 720 functional volumes per subject in four functional runs, each lasting 7.5 min. We used the Massachusetts General Hospital FS-FAST and Freesurfer Analysis software to analyze fMRI data (Dale and Sereno, 1993; Dale et al., 1999; Fischl et al., 1999, 2001; Segonne et al., 2004, 2005). The functional images were first realigned to the first volume in the series using the analysis of functional neuroimages motion-correction algorithm (Cox, 1996) and then smoothed with an isotropic 8 mm full width half-maximum (FWHM) Gaussian kernel. The surface-based analysis techniques have been used successfully in the past and are reported in detail previously (Bar et al., 2006).
Results
Behavioral results
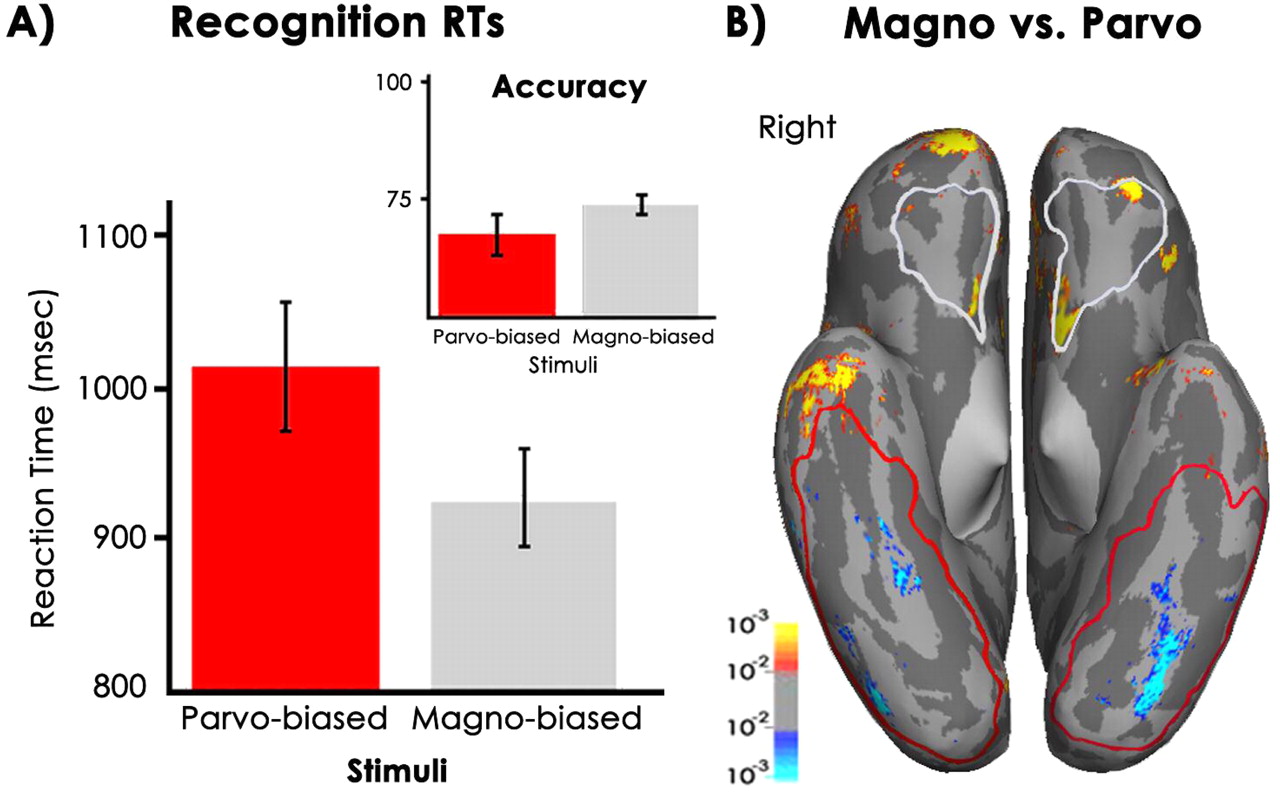
We first screened the data for outliers (>2 SD ± the mean) and incorrect responses from the reaction time (RT) data. This screening resulted in the exclusion of one of the 12 subjects as a result of being a statistical outlier. Correct response RT results revealed a significant recognition speed advantage for M-biased stimuli (mean p = 1010 ms; mean M = 905 ms; SEM ± 27.6; 95% CI 43–166; two-tailed paired samples t test; t11 = 3.8; p < 0.003) (Fig. 3A). The faster RT for M-biased stimuli did not arise because of a speed-accuracy trade-off, because the response accuracy was similar in the M and P conditions (meanP 68% vs meanM 73%; p < 0.06). Including incorrect trials did not qualitatively alter the RT relationship between the M and P conditions, resulting only in 10–20 ms shifts in mean RT for both conditions but preserving the M-P difference of ∼100 ms. However, our subjects apparently were unaware of any recognition advantage for M, with all but one reporting in the postexperiment debriefing that the chromatic (P) stimuli were easier to see than the grayscale (M) stimuli. This speed advantage for M-biased stimuli supports our proposal that magnocellular processing plays a critical role in facilitating object recognition, perhaps without subject awareness.

Comparison of M and P conditions. A, The reaction time results for M (gray; 905 ms) and P (red; 1010 ms). Only the correct responses, without outliers (more than ±2 SD), are included, although the M-P relationship does not change qualitatively when all trials are included (see Results, Behavioral results). B, Statistical parametric map of the activations in the M (Magno) versus P (Parvo) contrast. The average fMRI activity of all subjects is shown on the ventral surface of the “inflated” brain. The sulci are in dark gray, and the gyri are in light gray. The M > P activations are displayed in red-yellow; P > M activity is displayed in blue-cyan. The regions in OFC encircled in white, and the regions in the ventral temporal cortex encircled in red represent the inclusive average labels, or all the voxels from which BOLD data were extracted for our cortical ROI analyses. The following cortical regions were activated above a threshold of t > 3 by the M > P contrast: orbitofrontal cortex [−30, 28, −11], inferior frontal gyrus [−40, 33, 16], anterior inferior/middle temporal gyrus [−65, −21, −6], and the inferior parietal lobule [−40, −44, 49] in the left hemisphere; and orbitofrontal cortex [10, 23, −19], anterior inferior temporal gyrus [52, −12, −22], and inferior parietal lobule [39, −18, 60] in the right hemisphere. The P > M contrast activated the left middle and posterior fusiform cortex [−49, −68, −12], and the right mid-fusiform [28, −50, −12] gyrus and occipitotemporal sulcus [40, −80, −12].
Although the RTs we obtained are relatively long, it is important to keep in mind two things about the paradigm. First, both M and P stimuli were quite difficult to recognize because of the manipulation that biased processing toward particular (M or P) neurons, which required low luminance contrast (<4% Weber contrast) for M-biased stimuli to minimize the contribution of P cells, and isoluminant, color-only stimuli to minimize M neuron contribution and bias processing toward the P cells. Second, the RTs include not only the time to recognize the stimulus, but also the time to make the size decision (“Bigger or smaller than a shoe box?”), which requires recognition of the stimulus. Although this decision component added a time constant (in the aggregate), it also enabled us to obtain a tangible measure of recognition success, rather than having the subjects report their recognition success by pressing a key at the recognition instant, which cannot be verified.
fMRI results
The main contrast of interest in the present study was comparing the blood oxygen level-dependent (BOLD) response elicited by M-biased stimuli with the response elicited by P-biased stimuli. The statistical parametric map of fMRI activity resulting from this contrast is displayed in Figure 3B.
Activity in OFC and the ventrotemporal regions was of greatest interest in the present study because of our hypotheses about M- versus P-driven activation of OFC and the previously identified anatomical substrates of object recognition (Logothetis and Sheinberg, 1996; Tanaka, 1996; Malach et al., 2002). Hence, we focus here on the ventral surface activations. As can be seen in the statistical parametric map in Figure 3B, the M condition activated OFC to a significantly greater extent, whereas the P condition differentially engaged the ventral occipitotemporal cortex, particularly the middle and posterior fusiform gyrus. The left OFC site is close (<7 mm between centers) to the OFC site that was activated more for recognized versus not-recognized objects previously (Bar et al., 2001), as well as the OFC activation evoked when comparing LSF versus HSF stimuli (Bar et al., 2006).
This differential OFC activation, coupled with faster recognition of M-biased stimuli, supports the notion that M-biased stimuli trigger the activation of top-down facilitation in OFC, resulting in improved recognition efficiency. In addition, M-biased stimuli also elicited stronger activity, compared with P-biased stimuli, in the very anterior part of the right temporal cortex, which may be related to either the projection of M information to OFC or feedback from of OFC to IT when M information is available. The amygdala also showed increased activation for M-biased compared with P-biased stimuli.
Conversely, the object recognition regions in the middle and posterior fusiform gyri and the right occipitotemporal cortex were activated to a greater extent in the P condition (Fig. 3B). This larger activation for P versus M, along with slower recognition of P-biased object drawings might have arisen because of the lack of top-down input from OFC for P-biased stimuli, and this reduction of top-down feedback to the fusiform cortex necessitated more extensive (and slower) bottom-up analysis in the ventral temporal cortex. We examine and discuss activity in these cortical regions in detail below.
Region of interest analyses
To explore our hypotheses about the neural activity in OFC and in the ventral temporal object recognition regions in more depth, we performed region of interest (ROI) analyses in these areas. We extracted the BOLD signal from voxels in these regions that were active during the general task compared with the baseline (an ALL vs NULL contrast, minimum voxel extent of 15 voxels) and examined whether the BOLD signal in these ROIs was predictive of recognition efficiency as indicated by RT changes for M and P conditions. We normalized the RT change measure by transforming each subject's RT distribution into z-scores and then computing the z-values of each condition mean (M and P) in the overall RT distribution. This is a more sensitive measure of performance change for a particular condition than using raw RT differences, because it puts the deviation of each condition's mean from the grand mean in the context of that individual's RT distribution and makes the M and P condition differences more comparable across subjects. We then tested the correlation between the normalized RT means for M and P trials with the corresponding BOLD signal change in the M and P conditions. In OFC, the BOLD signal in the M condition was predictive of M condition recognition advantage, negatively correlating with the normalized RT mean for this condition (r = −0.87, p < 0.005 in the left OFC; r = −0.69, p < 0.04 in the right OFC) (Fig. 4, bottom panels). In other words, larger BOLD signal for the M condition in OFC was associated with greater recognition speed advantage for M-biased stimuli compared with P-biased stimuli. Conversely, OFC signal for the P condition did not predict recognition performance in either hemisphere (r = 0.47, p > 0.24 in the left OFC ROI; r = 0.14, p > 0.71 in the right OFC ROI) and indeed showed the opposite tendency (Fig. 4, top panels). We computed Fisher's Z, or the difference between the effect sizes (Rosenthal and Rosnow, 1991), for each pair of correlations to ascertain whether the dissociation between M and P BOLD signal correlations with recognition performance was significant. For left OFC correlations, we obtained Fisher's Z = −3.7, p < 0.0001; and for the right OFC, Z = −1.98, p < 0.024. These results suggest that OFC activity plays a critical role in facilitating recognition but only when the stimuli are able to engage magnocellular processing, as was indeed the case with our M-biased stimuli.

Correlation between BOLD signal in OFC and M and P recognition speed change from the grand mean. Top panels show the correlation plots for the P condition, the bottom panels for the M condition for all subjects that had enough significant voxels in these ROIs to meet the extent threshold (15 voxels). The left hemisphere correlation plots are displayed on the left. The P condition (red; top panels) correlations were not significant. The units on the X-axes are the z-values of the M (squares) or P (circles) condition mean, a normalized measure of change relative to each subject's overall RT distribution. Negative z-values denote an RT advantage for that condition. Note that almost all the RT mean z-values for the M condition (squares; bottom panels) are negative, whereas the inverse applies to the P condition.
We next examined activity in the ventrotemporal ROIs encompassing the fusiform gyri and occipitotemporal sulci in both hemispheres. These regions were activated to a greater extent by P stimuli compared with M stimuli (Fig. 3B). In both the left and the right hemispheres, signal in voxels activated by a task versus baseline contrast showed significant positive correlations for the P condition between performance and fMRI signal change (r = 0.62, p < 0.04 in the left hemisphere; r = 0.66, p > 0.03 in the right hemisphere) (Fig. 5, top panels). This finding suggests that inferotemporal object recognition regions are engaged proportionately more as recognition difficulty increases, at least when M-biased top-down guidance from OFC is absent. In the M condition, this relationship did not exist: BOLD signal in either hemisphere was not significantly correlated with recognition performance (r = −0.06, p < 0.85 in the left hemisphere; r = −0.46, p < 0.15 in the right hemisphere) (Fig. 5, bottom panels). Fisher's Z for these correlation pairs was Z = −1.57, p < 0.058 (left IT) and Z = −2.58, p < 0.005 (right IT), indicating a dissociation between the correlations of P and M BOLD signal with recognition performance. It seems somewhat counterintuitive that M BOLD signal in IT does not significantly correlate with behavior (although there is a nonsignificant trend in the right IT, perhaps reflecting the right hemisphere bias for M information). Although M information facilitates object recognition processes in IT, the activity in this case may mainly reflect P information processing (as indicated by the P BOLD correlations with behavior). In real-world situations, both types of information are present in the stimulus, and OFC presumably contributes M information to frame and guide P information processing in IT. However, in our paradigm, P information is unavailable in the M condition, and therefore IT may be unable to contribute much to the top-down information being sent from OFC. If most of the work in interpreting these M stimuli is done by OFC, it would lead to a relative lack of M-related modulation in IT.

Correlation between BOLD signal in the middle/posterior fusiform cortex and M and P recognition speed change from the grand mean. Top panels show the correlation plots for the P condition; the bottom panels show the correlation plots for the M condition for all subjects that had enough significant voxels in these ROIs to meet the extent threshold (15 voxels). The left hemisphere correlation plots are displayed on the left. In the M condition (bottom panels; squares), BOLD signal in the fusiform cortex was not significantly correlated with recognition performance in either hemisphere. The units on the X-axes are the z-values of the subjects' M (squares) or P (circles) condition mean, a normalized measure of change relative to each subject's overall RT distribution. Negative z-values denote an RT advantage; positive values indicate an RT cost.
In addition to OFC and IT, we examined activity in the right anterior temporal pole (Fig. 3B). In this ROI, BOLD signal elicited in the P condition positively correlated with RT (r = 0.71; p < 0.03), whereas the M condition negatively correlated with RT (r = −0.52; p < 0.15). This difference in r values was significant (Fisher's Z = −2.43; p < 0.008). This site may be a part of the feedback projection from OFC to the temporal lobe, possibly via the uncinate fasciculus, which connects OFC with the temporal poles (Catani et al., 2002; Mori et al., 2002). Given that for P stimuli the correlations in this ROI are similar to the correlations found in the more occipital part of the ventrotemporal cortex, and for the M stimuli the correlations in this focus resemble those obtained in OFC, this region may be a functionally important junction where top-down and bottom-up processes interact directly. Future research using imaging methods with better temporal resolution (e.g., MEG) will help in elucidating the neural processes in this region.
We also performed ROI analyses in the left and right amygdala to explore whether these nuclei were sensitive to the M versus P manipulation. In the right amygdala, the BOLD signal in the M condition indeed was significantly greater than in the P condition (t–10 = 3.4; p < 0.008). In the left amygdala, the pattern was the same (M > P) but did not reach significance (t10 = 1.6; p < 0.15). However, performing the same correlation analyses for the left and right amygdala revealed that these differences were not related to the M versus P recognition speed advantage observed in OFC (correlation, p > 0.60 and p > 0.81 for the M, and p > 0.31 and p > 0.81 for the P bold signal, in the left and right amygdala, respectively). This finding indicates that the amygdala receives a substantially greater M input than P input, possibly as part of a subcortical M projection to OFC. However, given the insensitivity of the amygdala responses to the M versus P recognition advantage, it appears to have had no direct relation to recognition performance per se.
Analyses of functional connectivity
Dynamic causal modeling
To examine functional changes in interregional connectivity related to our experimental manipulation (M vs P), we used dynamic causal modeling, a recently developed and validated method of inferring directional connectivity between neural regions based on fMRI time series from those regions (Friston et al., 2003; Penny et al., 2004a; Friston, 2006). Dynamic causal models (DCMs) have three sets of parameters: extrinsic input into one or more regions, intrinsic connectivity among the modeled regions, and bilinear parameters encoding the modulation of the specified intrinsic connections by experimental perturbations (Friston et al., 2003; Friston, 2006). Typically, a set of plausible DCMs is specified and compared using Bayesian model selection (BMS) (Penny et al., 2004a; Stephan and Penny, 2006). BMS performs pair-wise comparisons of all the models that take into account the parameter fit as well as the complexity of the models. BMS uses two approximations, the Bayesian information criterion (BIC) and the Aikake information criterion (AIC), to estimate the Bayes factor (BF), or the evidence of one model versus another given the observed data. BIC favors simpler models, whereas AIC favors more complex models (Kaas and Raftery, 1993). Therefore, a conservative convention has been established in which one model is deemed a better fit than another if both BIC and AIC BFs concur and both are > e or ∼2.78 (Penny et al., 2004a; Fairhall and Ishai, 2007; Stephan et al., 2007). As an additional safeguard, here, we take the smaller of the BIC and AIC BFs and use a robust method called the “positive evidence ratio” (PER) for group comparisons (Stephan and Penny, 2006), in which the number of individuals within the sample in whom a particular model is deemed optimal is divided by the number of individuals whose data favor another model.
To perform DCM and BMS analyses, we first reanalyzed our data with SPM5 (http://www.fil.ion.ucl.ac.uk/spm/software/spm5/). The following preprocessing steps were performed: all functional images were realigned to the first image in the series, motion-corrected, normalized to the standard Montreal Neurological Institute (MNI) template, and smoothed with an 8 mm FWHM Gaussian kernel. The general linear model (GLM) included regressors for the M- and P-biased conditions, as well as a third condition comprising all visual input. The latter condition was added specifically for DCM analysis to be used as a direct input into a lower visual region from which connections to higher regions propagate and are modulated by our experimental manipulations. The GLM also included the motion-correction parameters to regress out any remaining contributions of motion in the scanner. The activation pattern was very similar to what we had found in the surface-based analysis with FS-FAST/Freesurfer reported above. For DCM analysis, we obtained fMRI time series from three regions in the right hemisphere located in the middle occipital gyrus (MOG), fusiform gyrus (FG), and OFC for each subject that had significant activation clusters in the three regions. Activity in OFC and FG, as well as connectivity between these regions, are the focus of our experimental manipulation, and MOG is an early object form processing region (Ishai et al., 2000) that was strongly activated (t10 = 9.9; p < 0.00001 uncorrected) by all object stimuli in our study. Voxels within a 6 mm sphere centered on the most significant voxel in a cluster and activated at a significance level of p < 0.001 were extracted. For two subjects, the significance level had to be lowered to p < 0.01 to obtain time series from all three regions, and one subject could not meet these criteria and had to be excluded from the analysis. The mean Talairach coordinates (Talairach and Tournoux, 1988) for the time series extracted from these regions were [41(2.1), −78(1.4), −7(1.1)] for MOG, [44(3.9), −50(5.8), −7(1.6)] for FG, and [7(2), 31(5.5), −18(1.6)] for OFC. The SE is reported in the parentheses, and the conversion from MNI to Talairach coordinates was performed with the mni2tal conversion utility (http://imaging.mrc-cbu.cam.ac.uk/downloads/MNI2tal/mni2tal.m).
We defined simple three-tier DCMs with the six possible permutations of intrinsic connectivity patterns among the three regions, given extrinsic visual input into MOG and forward connections from MOG to FG and OFC (Fig. 6). The intrinsic connectivity patterns in the DCMs were modeled after those tested in Fairhall and Ishai (2007). Comparison of the estimated DCMs with BMS (Penny et al., 2004a) generally favored a model with parallel forward connections to OFC and FG from MOG with a backward connection from OFC to FG (Fig. 6, model 4), with the next-best model positing a forward connection from MOG to OFC and a backward connection from OFC to FG (Fig. 6, model 3), both in agreement with the top-down framework tested here. Models 4 and 3 were the only models specifying a unidirectional feedback connection from OFC to FG, and they were strongly favored over the rest of the models. There was very strong positive evidence for model 4 in four subjects, whereas model 3 was favored over model 4 in two subjects, giving a PER of 2:1. Three other subjects showed strong evidence for models 4 and 3 versus the remaining models, but the two leading models could not be differentiated, and in one subject, model 2 was favored. It is important to note that the strong positive evidence for model 4 (and to a lesser extent, model 3) was not a result of an inherent bias in the models (e.g., because of differences in the complexity of their connections). Model 4 typically prevailed whether it was simpler or more complex than the model with which it was being compared. It is also the model that has the architecture proposed by Bar (2003) and tested here: that is, separate bottom-up projections from the early visual regions to IT and OFC, with the latter (M-biased) projection triggering top-down facilitation via a backward projection from OFC to IT.

Top, The six intrinsic connectivity patterns of dynamic causal models tested in our functional connectivity analyses. Bottom, Left, Intrinsic connection weights; middle and right, modulatory connections activated by P and M bias in the stimuli. The thick arrows indicate significant effects at p < 0.05.
We next examined the modulatory connectivity in this leading model, model 4. In DCM, modulatory connections reflect increases (or decreases) in connectivity between two regions given some experimental manipulation, compared with the intrinsic connections between the same regions that capture connectivity in the absence of experimental input (Friston et al., 2003; Friston, 2006). Our hypothesis, encoded in the bilinear, modulatory connectivity parameters, was that in the P-biased condition, the forward connection from MOG to FG would be positively modulated, whereas in the M-biased condition, the forward connection from MOG to OFC, and the backward connection from OFC to FG, would increase its connection strength. Examining each of the modulatory connections revealed that P-bias in the stimuli significantly increased connectivity in the forward MOG → FG connection, with the average rate constant of 0.09 ± 0.04 Hz (p < 0.045), whereas M-bias strengthened connectivity in the forward MOG → OFC pathway, 0.12 ± 0.04 Hz (p < 0.011) and in the backward OFC → FG connection, 0.07 ± 0.03 Hz (p < 0.025). These average modulations constitute increases of 32, 68, and 183% in connection strength over the intrinsic connections among these regions. Thus, our predictions for the activity in this network were confirmed, and these findings are consistent with the framework proposed by the top-down facilitation model tested here (Bar, 2003). It is important to note that these findings provide support for functional connections between particular regions in our network but are unable to specify the exact anatomical pathways that mediated the observed modulation of activity. Future studies with more complex DCM structures may be able to elaborate the structure of these pathways.
Discussion
The primary goal of this study was to test our hypothesis that fast magnocellular pathways connecting the early visual areas with OFC are used in top-down facilitation of object recognition. We used stimuli designed to bias visual processing toward either the magnocellular or the parvocellular processing pathways, and showed the following: (1) M-biased stimuli were recognized faster than P-biased stimuli despite the higher brightness and perceived recognizability of P-biased stimuli; (2) M-biased stimuli activated OFC more than P-biased stimuli did, whereas P-biased stimuli activated the ventrotemporal object recognition regions to a greater extent; (3) for M-, but not for P-biased stimuli, larger BOLD signal in OFC was correlated with a recognition speed advantage; (4) larger BOLD signal in the fusiform cortex was associated with an increase in recognition RT for P-biased stimuli; and (5) M-bias in stimuli increased conduction of information from MOG and OFC, and from OFC to FG; whereas P-bias increased conduction in the MOG → FG pathway (all relative to intrinsic connections).
These findings provide strong support for the recognition facilitation mechanism tested here (Bar, 2003), which posits that fast magnocellular pathways connecting early visual and object recognition regions with OFC are critical for top-down facilitation of object recognition. When this projection can be engaged early, as was the case for our M-biased stimuli, recognition speed and accuracy improve along with positive signal changes in OFC. When M-driven top-down facilitation is reduced, as was the case with our P-biased stimuli, OFC is less able to trigger top-down facilitation, resulting in greater engagement of the bottom-up object recognition regions in the fusiform cortex, as shown by increased effective connectivity in the MOG → FG pathway and the increased ventral activation for the P stimuli, and slower recognition.
Although the function of OFC, particularly the medial OFC, has been often implicated in reward association learning, decision-making, cognitive control, and emotion, it receives inputs from all the sensory modalities, making it one of the most polymodal cortical regions (Kringelbach and Rolls, 2004). The somewhat more lateral orbitofrontal regions have been shown to be sensitive to visual stimuli, including faces and facial expression (Blair et al., 1999; Aharon et al., 2001; Winston et al., 2002; Morris and Dolan, 2004; Nomura et al., 2004; Strauss et al., 2005), as well as visual object stimuli (Thorpe et al., 1983; Bar et al., 2001; Hurliman et al., 2005; Zago et al., 2005; Bar et al., 2006), consistent with the lateral sensory OFC network proposed previously (Ongur and Price, 2000; Ongur et al., 2003). OFC sends feedback projections to many cortical regions, including strong connections with object recognition regions in the ventral temporal cortex (Cavada et al., 2000). Indeed, the effectiveness of object recognition has been shown to be impaired when the connections between these ventrotemporal areas and the prefrontal cortex are severed (Tomita et al., 1999; Chafee and Goldman-Rakic, 2000). We reduced the effectiveness of these connections with our psychophysical manipulation, by using stimuli (P-biased) that were ill-suited for magnocellular processing and showed that it impaired the recognition of these stimuli. In other words, the low-resolution information processed by magnocellular neurons is critical for facilitation of recognition, because it is used in fast triggering of the relevant top-down processes. It is worth noting that we do not claim that recognition is impossible without this top-down, M-driven facilitation, but rather that without informative magnocellular input, recognition processes are less able to benefit from top-down guidance and thus require more time to be completed.
What exact anatomical pathways might be subserving these connections? One possibility may be via the dorsal visual stream, which is known to have a substantial magnocellular input (Bullier, 2001), projects to the parietal cortex, and has connections with the frontal eye fields in the prefrontal cortex and with OFC (Cavada and Goldman-Rakic, 1989; Fang et al., 2005). However, our analyses revealed relatively little difference between M and P activation in the parietal regions. Another intriguing possibility is a subcortical projection from the pulvinar or mediodorsal nuclei of the thalamus. These pathways are poorly understood, but it is thought that the pulvinar nucleus receives partially processed information from the sensory cortices and projects to the prefrontal cortex and possibly other subcortical structures (Goldman-Rakic and Porrino, 1985; Giguere and Goldman-Rakic, 1988; Guillery, 1995; Romanski et al., 1997; Grieve et al., 2000; Guillery and Sherman, 2002). This pathway may be part of a bypass route from the early visual regions to the higher-order regions, such as OFC (Sherman and Guillery, 2004). OFC also has massive reciprocal connections with multiple nuclei within the amygdala (Rempel-Clower and Barbas, 2000; Ghashghaei et al., 2007), which are intermingled with inputs from the temporal visual association cortices (Ghashghaei and Barbas, 2002). The amygdala receives a subcortical projection from the superior colliculus via the pulvinar nucleus of the thalamus, and amygdala lesions result in impaired cortical visual processing (Vuilleumier et al., 2002; Dolan and Vuilleumier, 2003). This subcortical, possibly magnocellular, pathway (Schiller et al., 1979) has been proposed as an alternate visual input route enabling the processing of affective stimuli (emotional faces) in patients with striate cortex lesions (Morris et al., 1999), neonates (Morton and Johnson, 1991), and prosopagnosia patients (de Gelder et al., 2003). Morris et al. (1999) found increased right, but not left, amygdala activation in healthy subjects exposed to “unseen” (masked) fear faces, which is similar to the observed amygdala activation pattern in this study with M-biased stimuli (i.e., greater right amygdala activation). Moreover, Vuilleumier et al. (2001) showed that responses in the amygdala were not attenuated by lack of spatial attention to fearful faces, suggesting that the amygdala is involved in fast, preattentive responses to threat stimuli, possibly based on low-resolution information. Our findings of greater BOLD signal in the amygdala for M-biased stimuli, compared with the activity elicited by P-biased stimuli, provide some support to this hypothesis. Furthermore, the lack of a direct relationship between amygdala activity and recognition performance implies that the amygdala is not primarily involved in facilitating the recognition of stimuli, at least of the emotionally neutral stimuli we used here, beyond screening M information for danger and relaying it to OFC for additional interpretation. Future research, including neural fiber tracking with diffusion imaging and more complex dynamic causal models are needed to characterize the exact neural pathways involved in triggering and mediating top-down facilitation of object recognition.
Conclusions
Our results show that stimuli biased toward magnocellular processing were recognized faster and evoked greater activity in the orbitofrontal cortex, compared with stimuli biased to include primarily parvocellular information. The fMRI signal in the orbitofrontal cortex predicted recognition speed advantage for M versus P stimuli. Last, M-bias in the stimuli increased the connection strength between the middle occipital gyrus and the orbitofrontal cortex, as well as between the orbitofrontal and the inferior temporal cortex. These findings provide strong evidence that fast magnocellular projections to the orbitofrontal cortex, combined with a top-down projection from the orbitofrontal to the inferior temporal cortex, play a critical role in top-down facilitation of visual object recognition.
Footnotes
-
This work was supported by the James S. McDonnell Foundation 21st Century Science Research Award #21002039, National Institute of Neurological Disorders and Stroke Grants NS50615 and NS44319 (M.B.), National Institutes of Health National Center for Research Resources Grant 5P41RR014075, Massachusetts General Hospital Fund for Medical Discovery Grant (K.K.), and the Mental Illness and Neuroscience Discovery Institute. We thank A. S. Ghuman for insightful suggestions; R. B. Adams for statistical advice; K. E. Stephan and A. Ishai for help with DCM analyses; and E. Aminoff, M. J. Fenske, N. Gronau, and M. Mason for valuable discussions.
- Correspondence should be addressed to Moshe Bar, Martinos Center at Massachusetts General Hospital, Harvard Medical School, 149 Thirteenth Street, Charlestown, MA 02129. bar{at}nmr.mgh.harvard.edu


