

Abstract
Normal human consciousness may be impaired by two possible routes: direct reduced function in widespread cortical regions or indirect disruption of subcortical activating systems. The route through which temporal lobe limbic seizures impair consciousness is not known. We recently developed an animal model that, like human limbic seizures, exhibits neocortical deactivation including cortical slow waves and reduced cortical cerebral blood flow (CBF). We now find through functional magnetic resonance imaging (fMRI) that electrically stimulated hippocampal seizures in rats cause increased activity in subcortical structures including the septal area and mediodorsal thalamus, along with reduced activity in frontal, cingulate, and retrosplenial cortex. Direct recordings from the hippocampus, septum, and medial thalamus demonstrated fast poly-spike activity associated with increased neuronal firing and CBF, whereas frontal cortex showed slow oscillations with decreased neuronal firing and CBF. Stimulation of septal area, but not hippocampus or medial thalamus, in the absence of a seizure resulted in cortical deactivation with slow oscillations and behavioral arrest, resembling changes seen during limbic seizures. Transecting the fornix, the major route from hippocampus to subcortical structures, abolished the negative cortical and behavioral effects of seizures. Cortical slow oscillations and behavioral arrest could be reconstituted in fornix-lesioned animals by inducing synchronous activity in the hippocampus and septal area, implying involvement of a downstream region converged on by both structures. These findings suggest that limbic seizures may cause neocortical deactivation indirectly, through impaired subcortical function. If confirmed, subcortical networks may represent a target for therapies aimed at preserving consciousness in human temporal lobe seizures.
Introduction
The normal, alert conscious state is critical for functioning in the real world. Patients with temporal lobe seizures, a common form of epilepsy, often experience transient episodes of impaired consciousness, with major negative impact on quality of life (Williamson et al., 1998; Sperling, 2004). However, the mechanisms of impaired consciousness in temporal lobe seizures are not well understood. Normal consciousness depends on the association cortex along with subcortical arousal systems in the thalamus, upper brainstem, and basal forebrain (Steriade et al., 1997). Impaired consciousness occurs in disorders that either directly reduce function of the cerebral cortex or indirectly affect the cortex through disruption of subcortical activating systems (SAS). What is the route through which focal temporal lobe seizures, arising from mesial temporal structures such as the hippocampus, disrupt function in the neocortex?
Previous neuroimaging studies in humans have shown decreased cerebral blood flow (CBF) in frontal and parietal neocortices during partial temporal lobe seizures, contrasted with increases seen at the seizure foci (Rabinowicz et al., 1997; Menzel et al., 1998; Chang et al., 2002; Van Paesschen et al., 2003). Using single photon emission computed tomography, we previously reported that frontoparietal decreases in CBF during seizures in temporal lobe epilepsy (TLE) are specifically correlated with deficits in consciousness (Blumenfeld et al., 2004a). Examining the electrophysiological correlates of these frontoparietal decreases, we showed that these same regions exhibit large-amplitude 1–2 Hz slow waves on intracranial electroencephalography (EEG) (Blumenfeld et al., 2004b). Although some assume that ictal neocortical slow activity represents the propagation of excitatory seizure activity to the cortex, we have hypothesized that this phenomenon may represent a depressed cortical state, which occurs indirectly through impaired function of the SAS (Blumenfeld et al., 2004a,b).
We recently developed an animal model that has allowed us to investigate the fundamental cellular and network mechanisms of ictal neocortical slow activity (Englot et al., 2008). We reported that ictal neocortical slow activity during partial limbic seizures in lightly anesthetized rats is associated with decreases in neuronal firing, neurovascular responses, and cerebral metabolism in the frontal cortex (Englot et al., 2008). Furthermore, in awake-behaving rats, ictal neocortical slow activity during spontaneous partial seizures closely resembled cortical EEG seen during natural sleep and was associated with behavioral arrest without convulsions. In contrast, propagating seizures were associated with fast poly-spike activity in the frontal cortex and convulsive activity (Englot et al., 2008). These findings suggest that ictal neocortical slow activity is a distinct state of altered cortical function, more closely resembling sleep, coma, or deep anesthesia than excitatory seizure activity. However, the long-range network mechanisms of this phenomenon remain unknown.
To investigate this problem, we studied partial limbic seizures in lightly anesthetized and awake-behaving rats. We show that although the hippocampus, medial thalamus, and septum are all intensely involved in the seizures, only stimulation of the septal area produces a phenomenon resembling ictal neocortical slow activity. Furthermore, neocortical slow activity and behavioral arrest during hippocampal seizures can be prevented by severing the fornix connections between hippocampus and subcortical structures.
Materials and Methods
Animal preparation and surgery.
All procedures were in full compliance with approved institutional animal care and use protocols. A total of 109 adult male and female Sprague Dawley rats (Charles River Laboratories) weighing 190–480 g were used in these experiments. Eight animals were used for blood oxygen level-dependent (BOLD) functional magnetic resonance imaging (fMRI) studies, 65 animals were used for electrophysiology recordings in lightly anesthetized rats, and 36 animals were used for experiments in awake-behaving rats. For clarity, all experiment types described in the following paragraphs are summarized in Table 1.
Summary of experiments performed
All surgeries were performed under anesthesia with ketamine (90 mg/kg) and xylazine (15 mg/kg, i.m., q1 h). Responsiveness was checked every 15 min by toe pinch. After surgery, animals used for awake-behaving experiments were allowed at least 6 d for recovery before recordings, whereas animals used for light anesthesia experiments (including fMRI experiments) were switched to a low-dose, “light-anesthesia” ketamine/xylazine (40/7 mg/kg) regimen for immediate recordings, as described in detail previously (Englot et al., 2008). All stereotactic coordinates were measured in millimeters relative to bregma (Paxinos and Watson, 1998). At the conclusion of all experiments, animals were killed with an intraperitoneal injection of Euthasol (Virbac), and brains were collected to histologically verify electrode and lesion locations.
fMRI experiments (Table 1). At least 6 d before fMRI recordings, animals were stereotactically implanted with an MRI-compatible bipolar tungsten stimulating/recording electrode (part number WE35ST30.1A10; 356 μm shaft diameter, 0.1 MΩ resistance; Microprobe) in the right dorsal hippocampus [anteroposterior (AP), −3.8; mediolateral (ML), +2.5; superior–inferior (SI), −2.6). The electrode was lowered at a 50° angle from the vertical using a posterior approach and fixed to the skull with two to four plastic screws and dental acrylic. Immediately before fMRI scans, animals were anesthetized, tracheotomized, artificially ventilated (70% air and 30% O2), and paralyzed with d-tubocurarine (0.5 mg/kg, i.v.), and a femoral artery and vein were cannulated as described previously (Englot et al., 2008; Schridde et al., 2008). All physiological values were maintained within physiological range throughout the experiments (Schridde et al., 2008). fMRI recordings were acquired on a 9.4 tesla horizontal bore (16 cm bore diameter) spectrometer (Bruker Avance), equipped with passively shielded shim/gradient coils (47.5 G/cm) operating at 400.5 MHz for 1H. The transceiver system consisted of a 1H radiofrequency surface coil (15.18 mm diameter). Acquisition of anatomical and BOLD images was performed using parameters described in detail previously (Englot et al., 2008). The functional MR image acquisitions of 10 slices were obtained over 1 s (or over 2 s) with the total time from one image onset to the next of 3 s. Therefore, with eight dummy scans and 200 repetitions, a total of 2000 slices were obtained per 600 s experiment.
Partial seizures were induced with a 2 s stimulus train delivered between the bipolar hippocampal stimulating contacts consisting of square biphasic (1 ms each phase) pulses at 60 Hz, using an Isolated Pulse Stimulator (model 2100; A-M Systems). The current intensity was titrated by ∼200 μA steps to the lowest stimulus intensity (typically 200–800 μA, not exceeding 1500 μA) that would produce a seizure >45 s duration in the hippocampus. One to two stimulation experiments were performed in each animal, with at least 20 min between stimuli (Englot et al., 2008). EEG signals were amplified (100×) and filtered (1–100 Hz) using a Data Recording System (model 79D; Grass Instruments). Hippocampal local field potentials (LFPs) were recorded simultaneously with fMRI using two copper wires (custom ∼0.3 mm diameter with insulation; Microprobe) bound to the holder with plastic tape and filtered 1–100 Hz (100×) with a Microelectrode AC Amplifier (model 1800; A-M Systems). EEG and LFP signals were digitized, recorded (sampling rate, 1000 Hz) using a CED Micro 1401 and Spike2 software (CED), and processed by applying a low-pass filter at 30 Hz using Spike2 software to reduce residual artifacts in the EEG from magnetic field gradients. All data were realigned according to individual stimulus time.
MR images were initially processed using in-house software running on a MATLAB platform (MathWorks) written by F.H. and others to analyze individual experiments. All fMRI series were first screened for movement artifacts using a MOVIE function and center-of-mass analysis (restricted to voxels within the brain boundaries) to ensure that all runs exhibited movement of <25% of a pixel in either plane of the center of mass image. Group data t-map analysis was performed using BioImage Suite 2.6, a collaborative image analysis project at Yale University (http://www.bioimagesuite.org/). All images were first manually coregistered using rigid body transformations to a single template image, which consisted of one rat's functional MR images from within the data set. A two-sample paired t-map was calculated using all consecutive image acquisitions from stimulus artifacts until seizure cessation (determined using hippocampal LFP and scalp EEG), compared with 10 baseline image acquisitions (collected consecutively over 30 s) immediately preceding the stimulus, and superimposed onto a high-resolution template structural image (taken from within the data set) using a height threshold of t = 2 (corresponding to p = ∼0.05) and an extent threshold of 50 voxels (analysis voxel dimensions of 390 × 390 × 1000 μm). Separate t-maps were calculated using images corresponding to either the first half or the last half of the electrographic seizure versus the 10-image baseline. When more than one seizure was recorded in one animal (two seizures maximum per animal), these were averaged to give the values for that animal before group analysis (n is number of animals).
Electrophysiology and CBF recordings in lightly anesthetized rats (Table 1).
Before recordings, a bipolar Teflon-coated stainless steel stimulating/recording electrode (200 μm shaft diameter, 50–100 kΩ resistance; Plastics One) was stereotactically placed in the dorsal hippocampus (AP, −3.8; ML, +2.5; SI, −2.6) and fasted to a nearby screw in the skull with dental cement. A high-impedance tungsten recording microelectrode (250 μm shaft diameter, 2–4 MΩ resistance; FHC) was fixed to an OxyFlo XP needle probe (Oxford Optronix) for laser-Doppler-based CBF measurements and placed in the right lateral orbital frontal cortex (AP, +4.2; ML, +2.2; SI, −2.4). A second microelectrode and either an OxyFlo XP needle probe or a bipolar Teflon-coated stainless steel stimulating/recording electrode was placed in either the septal area, targeting the lateral septal nuclei (AP, +0.2; ML, +0.5; SI, −5.0), or the mediodorsal thalamus (AP, −2.3; ML, +0.6; SI, −5.6) on the right side. A screw in the midline skull behind lambda served as ground and recording reference.
After electrode placement, the animal was allowed to reach a state of light anesthesia (Englot et al., 2008). Electrode recordings were collected using model 1800 Microelectrode AC Amplifiers, broad-band filtered from 0.1 Hz to 10 kHz (100× gain) (Shmuel et al., 2006; Maandag et al., 2007; Schridde et al., 2008). Stimuli (model 2100 stimulator) were used to either (1) induce partial limbic seizures or (2) regionally stimulate the hippocampus, septal area, or mediodorsal thalamus without inducing a seizure. For experiments with partial limbic seizures, seizures were induced by 2 s hippocampal stimulation as in fMRI experiments (above).
During regional stimulations, pilot experiments showed neocortical slow activity with septal but not thalamic or hippocampal stimulation below seizure threshold (data not shown). Therefore, we selected current values that were consistently below seizure threshold for all three areas and studied a range of stimulus frequencies. Stimulus trains were 60 s duration, square biphasic (1 ms each phase) pulses at 10, 3, 1, and 0.33 Hz applied consecutively to each of the three regions, allowing at least 60 s of uninterrupted baseline between stimulus trains. The current was 50 μA for each stimulus, except that 30 μA was used for the 10 Hz stimulus to avoid eliciting seizures. Signals were filtered with a model 3363 filter (Krohn-Hite Corporation) into LFPs (0.1–100 Hz) and multiunit activity (MUA; 400 Hz to 10 kHz) and further amplified 15× (total amplification, 1500×).
For CBF measurement experiments, we used a laser-Doppler flowmetry (LDF) system (model 4000; Oxford Optronix). Electrophysiology and CBF signals were digitized with a Power 1401 (CED), at a sampling rate of 1 kHz for LFP and CBF and 10 kHz for MUA, and recorded using Spike2 software.
To track changes in LFP, MUA, and LDF signals during partial seizures and regional stimulations, the root mean square (RMS) voltage (used as a measure of signal power) or mean LDF signal was calculated in nonoverlapping 5 s time bins and plotted as mean percentage change ± SEM from an uninterrupted baseline. During seizure recordings, we used the RMS amplitude of MUA as an estimate of action potential firing because template matching during seizures is unreliable since single units in the hippocampus are replaced by population spikes (Englot et al., 2008; Schridde et al., 2008). During recordings of regional stimulations, spiking activity of the neuronal ensemble was extracted from extracellular recordings by shape recognition of high signal-to-noise ratio spikes with the Spike2 software, which utilizes a template-matching procedure (Lewicki, 1998) Up to three well resolved units per recording electrode were followed to create a temporal history of spikes per second (Smith et al., 2002).
Seizure data were analyzed by defining “baseline” (last 45 s of recordings before the stimulus), “seizure” (first 45 s after the stimulus), and “postictal' (first 45 s after the cessation of hippocampal seizure activity). For regional stimulation experiments, we defined “baseline” (last 60 s before stimulus), “stimulus” (60 s), and “poststimulus” (first 60 s after stimulus). LFP signals were subjected to fast Fourier transform (FFT) analysis in Spike2 to generate mean power spectra, with all power amplitudes normalized to baseline (peak power at baseline was 1). Mean total LFP, delta-range (1–4 Hz) LFP, MUA, and LDF signal changes during the seizure (or stimulation) and postictal (or poststimulation) periods were each compared with baseline with a paired, two-tailed t test with Bonferroni correction for multiple comparisons using SPSS 15 (SPSS) or Excel (Microsoft), and significance was assessed at p ≤ 0.05. For most experiments, one recording was obtained per animal, but in any instances in which more than one sample was obtained, these were first pooled by averaging within animal and then subjected to group statistics across animals.
Electrophysiology recordings and behavioral observations in awake-behaving rats (Table 1).
At least 6 d before recordings, animals were implanted with bipolar Teflon-coated stainless steel stimulating/recording electrodes (Plastics One) in the right lateral orbital frontal cortex (AP, +4.2; ML, +2.2; SI, −2.4) and the bilateral septal area (AP, +0.2; ML, +0.5 and −0.5; SI, −5.0), and a third electrode was placed in either the dorsal hippocampus or mediodorsal thalamus (coordinates as above). The distance between the contacts of stimulating electrodes in each region was equivalent at ∼1 mm. A screw in the midline skull behind lambda served as ground and recording reference. LFP signals were recorded with a model 1800 Microelectrode AC Amplifier, filtered at 1–100 Hz, and digitized at 1 kHz using a Power 1401. In some animals, a bilateral window was opened at the skull at coordinates (AP, −1.4; ML, +0.5 to +5.2 and −0.5 to −5.2) to lesion the fornix. A #11 surgical blade was lowered at 15° (with respect to the vertical), and a bilateral knife transection was performed in the coronal plane at coordinates (AP, −1.4; ML, +0.8 to +3.1 and −0.8 to −3.1; SI, −5.0) using techniques described previously (Addy et al., 2005; Almaguer-Melian et al., 2006).
As in the lightly anesthetized animals, stimuli in the awake animals were used either for regional stimulation without producing a seizure or for induction of a partial limbic seizure. For regional stimulation, a 60 s stimulus train of square biphasic (1 ms each phase) pulses at 10 Hz was applied between the bipolar stimulating electrode contacts of each region. Although regional stimulation of lightly anesthetized animals was performed with a consistent stimulus current amplitude below seizure threshold (see above), it is possible that the same current could have different effects in different animals or regions. Therefore, in awake experiments, we individually titrated the stimulus relative to seizure threshold in each animal and in each region to provide a more physiologically comparable stimulus across all conditions. The current was increased stepwise during sequential trains to determine the level at which the 10 Hz stimulus train would produce a seizure, which was defined as a large-amplitude (more than two times the baseline voltage) after-discharge in the hippocampal signal lasting >30 s. After determining the seizure threshold for each region, a low dose of the antiepileptic diazepam (1.5 mg/kg, s.c.) was administered to prevent the seizure activity. Fifteen minutes after antiepileptic administration, another 60 s stimulus train at 10 Hz was applied to each region at a current 0–33% greater than the predrug seizure threshold. In 50% of thalamic stimulation experiments, the 10 Hz thalamic stimulations did not produce a seizure even before diazepam administration (maximum current, 1 mA), so in these animals the thalamus was stimulated using the same current as the septal stimulation. To determine the effect of the regional stimulations on LFPs in the orbital frontal cortex, LFP signals during three defined states (baseline, stimulus, and poststimulus; 60 s each) were subjected to FFT analysis in Spike2 to generate mean power spectra.
Partial limbic seizures were induced with 2 s hippocampal stimulation as in lightly anesthetized animals (above). All awake animals were treated with low-dose diazepam (1.5 mg/kg), which prevented secondary generalization of seizures, similar to human patients where anticonvulsants typically prevent secondary generalization in TLE (Perruca, 2004). In some animals with a fornix lesion, a second hippocampal seizure was recorded in which the septum was stimulated in synchrony with the hippocampal seizure activity. To accomplish this, a Spike2 script was applied, which triggered a model 2100 Isolated Pulse Stimulator to send a single square biphasic pulse (1 ms each phase) between the septal electrodes each time a seizure spike (large voltage deflection) in the hippocampal LFP recordings crossed a threshold voltage, adjusted in real time to detect large-amplitude seizure spiking. The delay between each hippocampal seizure spike and septal pulse delivery was ∼1 ms. The current used for each individual septal pulse was set to the threshold current described above (0–33% above the lowest current that produced a limbic seizure before antiepileptic administration) via 60 s, 10 Hz septal stimulation. LFP data for baseline, seizure, and postictal were analyzed as above.
Behavioral observations were recorded for all awake experiments. For most experiments, this was performed by an unblinded observer (D.J.E.). To validate this approach and to provide a more objective assessment, a subset of experiments was analyzed by performing video recordings and blinded review. Fourteen video recordings of behavior before (30s), during (60s), and after (30s) regional stimulation were viewed by two independent reviewers (B.M. and H.B.) who were blinded to the location of stimulus (hippocampus vs septal nuclei). During each time period, the blinded reviewers recorded the presence or absence of the following three spontaneous exploratory behaviors: (1) forepaw exploratory movements on floor of cage; (2) forepaws used to explore or climb on sides of cage; (3) locomotion requiring movement of both forelimbs and hindlimbs. A score between 0 and 3 was assigned to each time period based on how many exploratory behaviors were observed, averaged between the two observers. Scores from baseline, stimulus, and poststimulus periods were compared with the two-tailed t test with Bonferroni correction for multiple comparisons. Behavioral arrest was defined as cessation of spontaneous exploratory behaviors during stimulation (i.e., a behavioral score of 0 during stimulus, compared with a score of 1–3 during baseline). Exact behavioral rating scores were in agreement between the two independent observers for 95% of the time periods analyzed (52 total time periods from 14 videos × 3 time periods each). The unblinded observer independently rated behavior during stimulation in all 14 animals (before the blinded video review), and determination of behavioral arrest was in agreement with the blinded reviewers in 100% of animals. Unblinded behavioral observations were then used for all other awake experiments.
Results
fMRI shows subcortical increases and neocortical decreases during partial seizures
We first examined BOLD fMRI changes throughout the brain during partial limbic seizures in the lightly anesthetized rat. We recorded 11 electrically stimulated partial seizures in eight rats, with a mean duration (±SEM) of 59 ± 7.6 s. Group analysis revealed BOLD signal increases in the dorsal hippocampus, in the lateral and medial septal areas, and, less prominently, in the mediodorsal thalamus during early limbic seizure (Fig. 1A). In contrast, bilateral BOLD decreases were seen in the orbital frontal cortex, anterior cingulate cortex, and the retrosplenial granular cortex during early seizure (Fig. 1A). These changes persisted during the latter part of seizures, although hippocampal and thalamic activations appeared less prominent and neocortical deactivations appeared somewhat more prominent (Fig. 1B) compared to early seizure (Fig. 1A). By examining individual t-maps from all 11 experiments (data not shown), it was noted that fMRI activations were most frequently seen in three regions bilaterally: the septal area (during 11 seizures), hippocampus (7 seizures), and the mediodorsal thalamus (4 seizures). In contrast, BOLD decreases were typically seen in the bilateral orbital frontal cortex (10 seizures), anterior cingulate cortex (8 seizures), and the posterior cingulate/retrosplenial cortex (7 seizures). Other regions occasionally displaying signal changes during seizures included the primary somatosensory cortex and basal ganglia, but the presence and direction of changes in these areas were not consistent. These results suggest that partial limbic seizures consistently cause activation in several subcortical structures that is contrasted with deactivation of frontal cortical regions, most notably the orbital frontal cortex. The septal nuclei, mediodorsal thalamus, and hippocampus were therefore investigated further to determine their possible role in ictal neocortical deactivation.

Partial limbic seizures are associated with BOLD increases in the hippocampus, septal area, and mediodorsal thalamus and decreases in the frontal cortex. Seizures were induced by 2 s hippocampal stimulation. A, fMRI changes during early seizure. During the first half of seizures, BOLD signal increases are observed in the dorsal hippocampus and septal nuclei, and less prominently in the mediodorsal thalamus. BOLD decreases are seen in the orbital frontal, anterior cingulate, and retrosplenial granular cortices. The arrow signifies an hippocampal electrode artifact. B, fMRI changes during late seizure. During the second half of seizures, BOLD increases in the hippocampus and thalamus are diminished, compared with A, although septal increases remain prominent. Signal decreases in frontal cortical regions are seen in the same regions as in A and are somewhat more prominent. Slices are shown from anterior to posterior, with approximate coordinates relative to bregma (Paxinos and Watson, 1998). T-maps (threshold t = 2) were generated using group data of the first half (A) or second half (B) of all seizures compared with a 30 s prestimulus baseline and overlaid on high-resolution anatomical images (see Materials and Methods). n = 8 rats, with 11 seizures (3 rats had 2 seizures each, for which fMRI data were averaged to yield one data set per animal before group analysis). Seizure duration was 59 ± 7.6 s (mean ± SEM). Ten slices were imaged per animal, although only the eight posterior slices are shown. Colored bars indicate t values for increases (warm colors) and decreases (cold colors). Cg1/2, Anterior cingulate cortex; HC, hippocampus; LO/VO, lateral and ventral orbital frontal cortex; LS/MS, lateral and medial septal nuclei; MD, mediodorsal thalamus; RSG, retrosplenial granular cortex.
Fast poly-spike activity propagates to the septal area and medial thalamus during partial limbic seizures
We next sought to characterize septal and medial thalamic activity during partial limbic seizures and to compare electrical and blood flow signal changes in each region with those associated with hippocampal seizure activity versus ictal neocortical slow activity. A total of 74 seizures in 53 lightly anesthetized rats were recorded, with an average length of 74 ± 2.3 s (mean ± SEM). Electrographic recordings revealed fast 9–12 Hz poly-spike LFP activity and large-amplitude MUA population spikes in the septum during partial limbic seizures, which resembled fast spiking seen in the hippocampus (Fig. 2A and inset). In contrast, frontal cortical LFP traces displayed large-amplitude 1–2 Hz slow waves during the seizures, associated with Up and Down states of neuronal firing in MUA recordings that persisted into the postictal period (Fig. 2A). This cortical firing pattern resembles the Up and Down states seen during slow oscillations in other depressed cortical states (Steriade et al., 1993; Cowan and Wilson, 1994; Haider et al., 2006). Mediodorsal thalamic recordings also revealed fast 9–12 Hz LFP activity and large MUA population spikes during limbic seizures, more closely resembling poly-spike hippocampal seizure activity than slow waves observed in the frontal cortex ictally (Fig. 2B).

During partial limbic seizures, fast poly-spike activity propagates to the septal area and mediodorsal thalamus. A, Example LFP and MUA traces, including septal recordings, during a partial seizure in a lightly anesthetized rat. At baseline, recordings show a stable theta rhythm in hippocampal LFP and low-voltage beta and delta activity in the septum and orbital frontal cortex (see also inset). MUA recordings reveal relatively stable neuronal firing in the septum and frontal cortex. During the seizure, hippocampal and septal LFP recordings show 9–12 Hz fast poly-spike activity ictally, associated with population spikes in septal MUA recordings. Septal population spikes are markedly larger in amplitude than individual baseline units and are thus shown truncated here. Septal LFP signals also show increased delta activity compared with baseline. In the orbital frontal cortex, 1–2 Hz large-amplitude slow waves are seen in LFP recordings, associated with Up and Down states of neuronal firing (black arrows) in MUA recordings. No fast poly-spike activity is present in the frontal cortex. After the seizure, hippocampal and septal MUA are depressed while frontal cortical slow oscillations persist postictally. B, Example LFP and MUA traces, including mediodorsal thalamic recordings, during a partial seizure in a lightly anesthetized rat. During baseline, recordings show a stable theta rhythm in hippocampal LFP and relatively stable LFP and MUA in the mediodorsal thalamus and frontal cortex. During the seizure, hippocampal and thalamic LFP recordings show 9–12 Hz fast poly-spike activity ictally associated with large population spikes in thalamic MUA recordings (shown truncated). In the orbital frontal cortex, 1–2 Hz slow waves are seen in LFP recordings, with Up and Down states of neuronal firing (black arrows) in MUA recordings. No fast poly-spike activity is present in the frontal cortex. Postictally, hippocampal activity is depressed, some cortical slow activity continues, and slow waves are seen in the mediodorsal thalamus. LFP recordings are filtered 0.1–100 Hz, and MUA recordings are filtered 400 Hz to 10 kHz. stim, Stimulation.
Table 2 summarizes mean electrophysiology as well as CBF signal changes measured by LDF for all partial seizures and postictal periods in lightly anesthetized animals. LFP signals increased significantly in all regions (hippocampus, septum, mediodorsal thalamus, orbital frontal cortex) during seizures compared with baseline, as both fast poly-spike seizure spiking and large-amplitude neocortical slow activity caused elevated LFPs. However, whereas MUA and CBF increased in the hippocampus, septum, and thalamus during seizures, reflecting increased neuronal activity compared with baseline, neuronal firing, and CBF decreased in the frontal cortex ictally, suggesting diminished neuronal activity. Both MUA and CBF were also reduced in the cortex postictally, during continued slow oscillatory LFP activity. These data suggest that fast 9–12 Hz poly-spike activity present in the septal area and medial thalamus during partial limbic seizures represents seizure propagation to these regions, contrasting considerably with reduced neuronal activity associated with ictal neocortical slow oscillations. Thus, subcortical seizure spikes and neocortical slow waves likely underlie the neuroimaging increases and decreases, respectively, observed in these regions using fMRI (Fig. 1).
Summary electrophysiology and CBF signal changes during and after partial limbic seizures in lightly anesthetized rats
Septal stimulation, but not hippocampal or thalamic stimulation, produces neocortical slow activity in the absence of limbic seizures
As fMRI studies revealed three primary regions of activation during partial limbic seizures (the hippocampus, septal area, and medial thalamus), our next objective was to investigate whether ictal involvement of one of these regions plays a role in producing neocortical slow activity. Our specific goal was to mimic the poly-spike activity we observed in all three of these regions during limbic seizures by eliciting a similar activation pattern in one area at a time, without inducing a seizure that might propagate to other regions. We thus stimulated the dorsal hippocampus, septal area, and mediodorsal thalamus in lightly anesthetized rats for 60 s (the typical seizure length) using stimulus trains below seizure threshold. A current of 50 μA was used at 0.33, 1, and 3 Hz, whereas a 30 μA current was used during 10 Hz stimulations as 50 μA typically resulted in a seizure at this frequency. We observed that stimulus trains in the septal area produced episodes of large-amplitude neocortical slow activity without inducing a hippocampal seizure, as evident from the lack of spike activity in the hippocampus (Fig. 3A). The 1–2 Hz slow oscillations seen in frontal cortical LFP during the stimulus were associated with Up and Down states of neuronal firing in MUA recordings, resembling ictal neocortical slow activity (Fig. 3A).

Stimulation of the septal area produces slow oscillations, diminished neuronal activity, and reduced CBF in the frontal cortex. A, Example recordings during 3 Hz stimulation of the septum at 50 μA. Baseline recordings show stable theta rhythm in the hippocampus and relatively stable neuronal firing in the frontal cortex with occasional slow waves. During the stimulation, 1–2 Hz large-amplitude slow waves are observed in the frontal cortex, associated with Up and Down states of neuronal firing. Hippocampal recordings during the stimulus reveal that no limbic seizure is present. After the stimulus (POST-STIM), activity in the frontal cortex resembles baseline levels. LFP recordings are filtered 0.1–100 Hz, and MUA recordings are filtered 400 Hz to 10 kHz. B, Summary of frontal cortical changes during septal stimulation in lightly anesthetized rats. Stimulation (stim) of the septum at 3 and 10 Hz produces a statistically significant increase in frontal LFP delta power, whereas stimulation at 1, 3, and 10 Hz causes significant decreases in MUA and CBF. All 0.33, 1, and 3 Hz stimulus trains are 60 s at 50 μA, whereas all 10 Hz stimulation trains are 60 s at 30 μA (to avoid eliciting seizures). *p ≤ 0.05; **p ≤ 0.01, two-tailed t test compared to baseline. Results are mean (+SEM) from n = 7 animals (1 stimulation per animal per stimulus frequency).
Importantly, as stimulus frequency was increased above 1 Hz (e.g., to 3 or 10 Hz), the dominant frequency of the frontal slow activity did not track the stimulus, but rather remained at 1–2 Hz (Fig. 3A). Stimulation of the septal area produced significant elevations in delta frequency LFP power in the frontal cortex during 3 and 10 Hz stimulus trains (Fig. 3B). Meanwhile, significant decreases in MUA and CBF were observed in the frontal cortex during 1, 3, and 10 Hz septal stimulations (Fig. 3B).
In contrast to septal stimulation, no obvious changes in frontal cortical rhythms were seen during identical stimulations of the hippocampal formation (supplemental Fig. 1A, available at www.jneurosci.org as supplemental material) or mediodorsal thalamus (supplemental Fig. 2A, available at www.jneurosci.org as supplemental material), and cortical activity was not significantly altered during stimulation of these regions at any of the four frequencies used (supplemental Figs. 1B, 2B, available at www.jneurosci.org as supplemental material), although 1 Hz thalamic stimuli did result in small but significant (p = 0.04) increases in cortical CBF and MUA (supplemental Fig. 2B, available at www.jneurosci.org as supplemental material). These data illustrate that in lightly anesthetized rats, stimulation of the septal area, but not the mediodorsal thalamus or dorsal hippocampus, elicits large-amplitude slow oscillations, Down states of reduced neuronal firing, and diminished CBF in the frontal cortex.
Interestingly, although stimulation of the septal area needed to be above 1 Hz to significantly increase mean delta power (averaged over the entire 60 s stimulus period) (Fig. 3B), stimulation even at the lowest frequency (0.33 Hz) produced brief isolated slow waves in the frontal cortex. Unlike higher-stimulus frequencies, we noted that each stimulus at 0.33 Hz elicited slow waves that occurred immediately after an individual septal pulse (Fig. 4A). Specifically, 75% of individual septal pulses during 0.33 Hz stimulus trains across eight animals elicited a large-amplitude slow wave and simultaneous Down state of firing in the cortex, characterized by 300–500 ms of neuronal quiescence, in a seemingly all-or-none manner. This allowed us to evaluate the latency of resultant neocortical effects immediately after a pulse to the septal area, to provide insight into whether the circuit underpinnings for this effect might involve one or many synapses. We calculated the mean waveform produced by all septal stimuli at 0.33 Hz, using the 20 individual stimuli across each 60 s train at 0.33 Hz in eight animals, and measured the average peak and half-peak latencies. We found that each slow wave in frontal cortical LFP produced by septal stimulation peaked 268 ± 30 ms (mean ± SEM) after the pulse, with a half-peak latency of 120 ± 16 ms (Fig. 4B). We also observed that the upward slope of the voltage deflection typically began at ∼60–70 ms (Fig. 4B). The slow wave was associated with a 300–500 ms Down state in neuronal firing (Fig. 4C). The mean neuronal responses during the first 300 ms after the stimulus resulted in an increase in LFP voltage (+0.11 ± 0.04 mV; mean ± SEM) and a reduction in neuronal spiking (−15 ± 3 spikes/s) that differed significantly from a 1000 ms baseline before the stimulus (p ≤ 0.01 for each, two-tailed t test, with 160 stimuli collapsed across eight animals). Subsequently, as neurons “recovered” from the Down state, a synchronized Up state of neuronal spiking was seen (Fig. 4C), paralleled by a negative LFP voltage deflection (Fig. 4B). Importantly, although each Down state in firing was typically characterized by complete neuronal quiescence (∼0 spikes/s), only 75% of septal pulses caused a Down state (Fig. 4A); thus, the mean firing rate associated with all septal pulses is not equal to 0 (Fig. 4C). Examining the mean LFP and MUA cortical response to only those septal stimuli that produced a Down state revealed a similar, although slightly more dramatic, increase in LFP voltage (+0.15 ± 0.04 mV) and reduction in neuronal spiking (−18 ± 4 spikes/s) during the first 300 ms after the stimulus compared with a 1000 ms baseline (p < 0.01, two-tailed t test). These findings suggest that (1) the mechanism of neocortical slow oscillations induced after stimulation of the septal area likely involves more than one synapse, as monosynaptic effects would likely be apparent within the first 20 ms (Lee and Hablitz, 1991; Racine et al., 1995), and (2) an individual septal pulse can trigger a single Down state of cortical firing. Stimulation at higher (e.g., 3–10 Hz) frequencies, however, induce continuous 1–2 Hz slow oscillations in the frontal cortex, as described above.
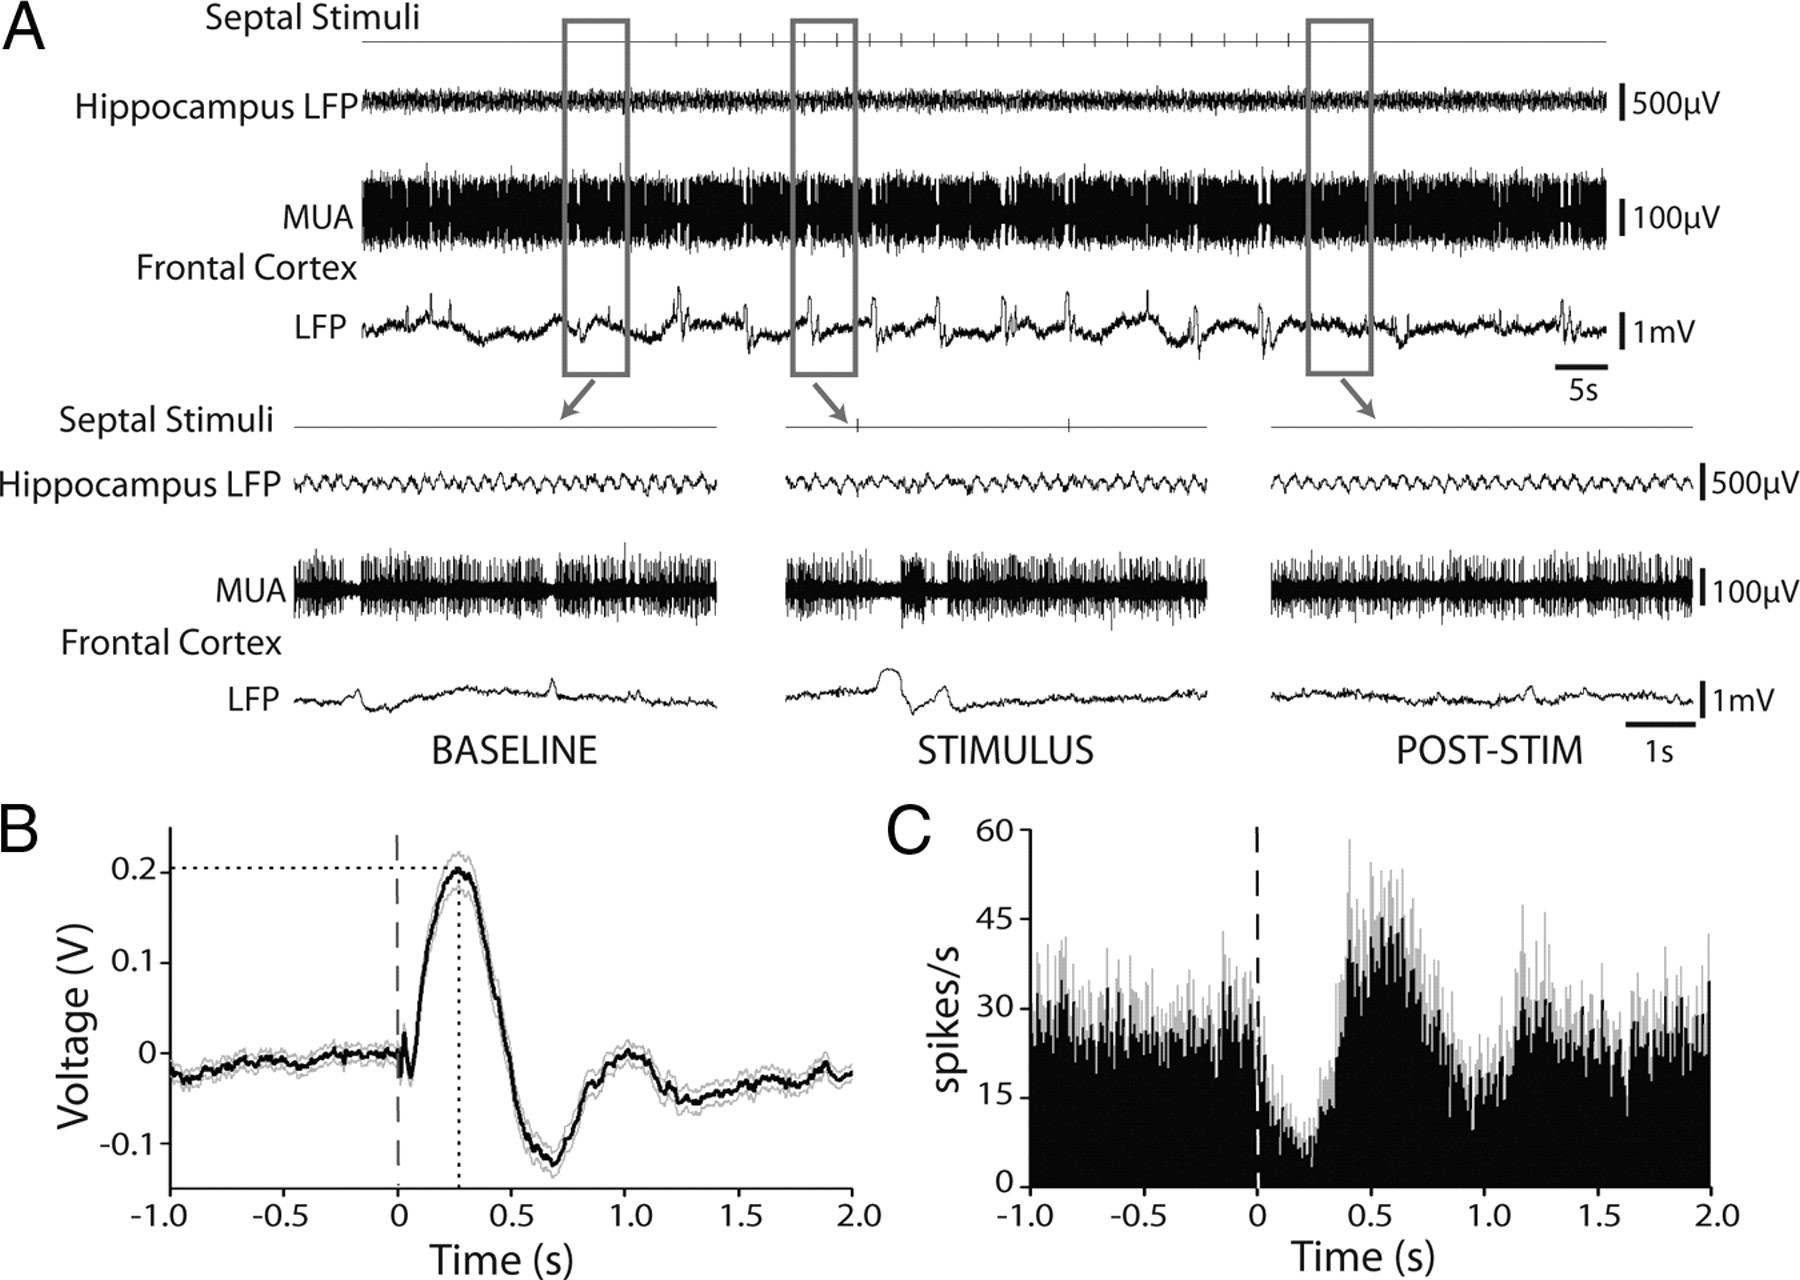
An individual pulse to the septal area often produces a corresponding slow oscillation and concomitant Down state of neuronal firing in the frontal cortex. A, Example recordings during 0.33 Hz stimulation of the septum. Baseline recordings show hippocampal theta activity and relatively stable neuronal firing in the frontal cortex with occasional slow waves. During the stimulus, several 1–2 Hz large-amplitude slow oscillations are observed in the frontal cortex. Specifically, one or two slow waves are elicited immediately after many, but not all, individual septal stimuli. Hippocampal recordings during the stimulus reveal that no seizure is present. After the stimulus, activity in the frontal cortex resembles baseline levels. LFP recordings are filtered 0.1–100 Hz, and MUA recordings are filtered 400 Hz to 10 kHz. B, Mean (±SEM) waveform produced by septal stimuli. On average, each septal pulse produces a large positive voltage deflection on frontal cortical LFP, peaking 268 ± 30 ms after the pulse, with a half-peak latency of 120 ± 16 ms. The upward slope of the voltage deflection begins at ∼60–70 ms. C, Change in neuronal firing produced by septal stimuli. A Down state of neuronal quiescence is elicited after most septal pulses, resulting in an average decrease in neuronal firing after the stimulus. After the Down state, a synchronized Up state across neurons sampled results in a mean increase in neuronal firing. Mean data (±SEM) are calculated from frontal cortical responses to n = 20 septal stimuli per animal in eight animals (160 stimuli total). Data were first pooled by averaging within each animal, and then statistics were calculated by taking the mean across all animals (n = 8). Very similar results were obtained if data were analyzed across stimuli without first pooling within animals (data not shown). All stimuli were delivered in 60 s trains at 0.33 Hz. The dashed lines represent time of synchronized biphasic (1 ms each phase) septal stimuli, and the dotted line indicates peak waveform latency.
Septal stimulation results in neocortical slow activity and behavioral arrest in awake-behaving rats
One limitation of the preceding results is that the experiments were performed in anesthetized rats. To expand the relevancy of our studies to our central hypothesis (that ictal neocortical slow activity in humans causes loss of consciousness during partial limbic seizures), it is important to replicate our results using awake-behaving animals in which behavior can be observed. We tested both the effects of regional stimulation of one structure at a time to mimic local seizure activity (but without producing seizures) and the effects of limbic seizures (next section). We began by testing whether 60 s trains of regional stimulation at 10 Hz (the most common seizure spike frequency) delivered to the septal area, dorsal hippocampus, or mediodorsal thalamus would produce neocortical slow activity. We noted that these stimulus trains often produced limbic seizures in awake rats, so we developed a protocol in which we (1) titrated a 60 s, 10 Hz stimulus train up to a current that would produce a limbic seizure; (2) administered a low dose of the antiepileptic diazepam to block the seizure activity; and (3) repeated the 60 s, 10 Hz train at a stimulus current 0–33% greater than the predrug seizure threshold current. In addition to preventing seizure activity that might propagate to distal structures, this protocol allowed us to use stimulus currents that were physiologically comparable across animals and regions relative to seizure threshold.
We observed that 60 s stimulation trains at 10 Hz in awake-behaving animals produced large-amplitude 1–3 Hz slow oscillations in the frontal cortex when the stimulus was applied to the septal area (Fig. 5A), but not when the stimulus was applied to the dorsal hippocampus (Fig. 5B) or the mediodorsal thalamus (Fig. 5C). On average, septal stimulation produced a 1580 ± 288% (mean ± SEM) elevation in delta frequency power compared with prestimulus baseline (p = 0.02; n = 21), whereas stimulation of the hippocampus and mediodorsal thalamus resulted in a 20 ± 12% (p > 0.3; n = 12) and 1.9 ± 21% (p > 0.3; n = 8) increases in delta frequency power, respectively (two-tailed paired t tests).

In awake-behaving rats, stimulation of the septal area produces neocortical slow activity and behavioral arrest. A, Example LFP recordings during septal stimulation in an awake-behaving rat. During the stimulus train, 1–3 Hz large-amplitude slow activity is observed in the frontal cortex. After the stimulus, cortical LFP activity resembles baseline recordings. B, C, Example LFP recordings during hippocampal (B) and mediodorsal thalamic (C) stimulation in awake-behaving rats. No obvious changes in frontal cortical LFP recordings are observed during or after the stimuli. LFP recordings are filtered 1–100 Hz. D, During septal stimulation, but not during hippocampal stimulation, exploratory behavior is dramatically diminished, as rated by two blinded observers. Mean data (+SEM) are shown for seven septal- and seven hippocampal-stimulated animals (1 stimulation per animal). All stimulations are 60 s at 10 Hz performed after antiepileptic administration. **p ≤ 0.01, two-tailed t test comparing states with Bonferroni correction for multiple comparisons.
We noted that septal stimulations resulted in dramatically diminished behaviors during the stimulation, but no noticeable behavioral changes occurred during hippocampal or thalamic stimulations (unblinded observations). To allow for objective behavioral analysis, we created 14 videos of animals during seven septal stimulations and seven hippocampal stimulations, and two blinded observers rated each animal's exploratory behavior during the baseline, stimulus, and poststimulus periods on a scale of 0 (fewest behaviors) to 3 (most behaviors). The average behavioral ratings of the blinded observers indicated that although septal stimulation resulted in behavioral arrest, hippocampal stimulation did not cause altered behavior (Fig. 5D). Examples of the videos viewed by the blinded raters representing both the septal stimulation and hippocampal stimulation paradigms are provided in the supplemental video (available at www.jneurosci.org as supplemental material). These data reveal that septal stimulation in awake-behaving rats produces large-amplitude slow waves in the frontal cortex and behavioral arrest, resembling ictal neocortical slow activity and associated deficits in arousal seen in partial limbic seizures.
Cutting the fornix prevents ictal neocortical slow activity
The above fMRI, CBF, and electrophysiological studies demonstrate that limbic seizures are associated with increased activity in subcortical structures including the septum and that local septal stimulation is sufficient to reproduce neocortical slow activity. We next asked: Is spread of seizure activity to subcortical structures necessary for the generation of neocortical slow activity and behavioral arrest? To address this problem, we transected the fornix to disrupt the major pathway of communication between the hippocampus and subcortical structures including the septum.
In awake-behaving rats with a fornix lesion, partial limbic seizures induced by brief hippocampal stimulation involved little spike activity in the septum, contrasted with intense septal involvement in normal animals (Fig. 6A,B). In addition, the fornix transection prevented ictal neocortical slow waves in the frontal cortex (Fig. 6, compare A, B). Group data power spectra confirmed that increased delta power in the frontal cortex during limbic seizures was prevented by the transection (Fig. 7A,B, bottom row) and that 9–12 Hz fast poly-spike activity was significantly lower in the septum during seizures in lesioned versus nonlesioned rats (Fig. 7A,B, middle row). In addition, it was noted that behavioral arrest and/or chewing facial automatisms were present during partial limbic seizures in all animals without a fornix cut (n = 7 of 7; Racine classes 0–1) (Racine, 1972); however, behavioral changes were rarely observed (n = 3 of 17; 18%) during seizures in rats with the fornix lesion (unblinded observations). Notably, convulsive activity (Racine classes 2–5) was not observed during partial limbic seizures in either condition.

Fornix lesion prevents ictal neocortical slow activity. A, Example LFP recordings during a hippocampal seizure in an awake-behaving, nonlesioned animal. Hippocampal stimulation (2 s, 60 Hz) produces a partial limbic seizure characterized by fast poly-spike activity in both the hippocampus and the septum, contrasted by 1–3 Hz large-amplitude slow oscillations in the frontal cortex. Cortical slow activity persists briefly postictally. B, Example recordings during a hippocampal seizure in an awake-behaving rat with a fornix lesion. Hippocampal stimulation results in a partial limbic seizure characterized by poly-spike activity in the hippocampus, but without obvious propagation of seizure spiking to the septum. No large-amplitude slow activity is seen in the frontal cortex. C, Example recordings during a hippocampal seizure plus synchronized septal stimulation in a fornix-lesioned rat. Hippocampal stimulation produces a partial limbic seizure characterized by fast poly-spike activity in the hippocampus. Each hippocampal spike exceeding a voltage threshold of ∼600 μV above baseline (in this example) triggers a single biphasic (1 ms each phase) pulse applied to the septum (middle trace). During the seizure with synchronized septal stimulation, 1–3 Hz large-amplitude slow waves are observed in the frontal cortex. LFP recordings are filtered 1–100 Hz. All animals were treated with low-dose diazepam to prevent secondary generalization. stim, Stimulation.

Fornix transection prevents ictal elevations in cortical slow and septal fast activity during partial hippocampal seizures. A, During partial seizures in awake-behaving animals without a lesion, hippocampal and septal LFP power increases across the spectrum (baseline not shown), peaking in the alpha range at 9–12 Hz. Ictal neocortical slow activity in the frontal cortex leads to large increases in delta power, without higher-frequency peaks. B, Partial seizures in animals with a fornix lesion result in hippocampal LFP power elevations across the spectrum, resembling hippocampal power during seizures in nonlesioned animals (A). Septal LFP activity in animals with a fornix lesion (middle row) is much less dramatic than in animals without a lesion (A). Frontal cortical LFP power in lesioned animals (bottom row) does not change significantly from baseline, reflecting the absence of ictal neocortical slow activity after transection. C, During partial seizures in animals with fornix cuts, the addition of synchronized septal stimulation (STIM) results in partial recovery of cortical delta power elevations ictally (bottom row, compare C with A), reflecting increased neocortical slow oscillations. EEG power spectra are generated from 1–20 Hz LFP data during the first 30 s of seizure activity normalized to the peak amplitude of a 30 s baseline (peak power at baseline was 1; baseline not shown). Mean results (+SEM) are shown for n = 7 (A), n = 17 (B), and n = 7 (C) animals (1 seizure per animal per condition). All animals were treated with low-dose diazepam to prevent secondary generalization. *p ≤ 0.05; **p ≤ 0.01, two-tailed t test comparing change in frontal cortical delta power versus baseline; ‡p ≤ 0.05, two-tailed t test comparing ictal septal 9–12 Hz power with and without a lesion.
Synchronized septal stimulation allows partial recovery of neocortical slow activity after fornix transection
The next question we addressed was whether fornix transections prevent ictal neocortical slow activity specifically by diminishing recruitment of the septum during seizures, or via other effects not related to septal recruitment. We sought to artificially reproduce septal recruitment during hippocampal seizures in fornix-lesioned animals, allowing spike activity to “propagate” from the hippocampal formation to the septum despite severed anatomical connections. A computer script was used to detect each individual spike complex in the hippocampal LFP signal during a seizure and instantaneously (∼1 ms delay) trigger a single square biphasic pulse (1 ms each phase) to the septal area after every hippocampal spike. The addition of these septal stimuli, synchronized to the spike activity in the seizing hippocampus, resulted in a partial recovery of large-amplitude slow oscillatory activity in the frontal cortex during seizures (Fig. 6, compare A, C). Power spectra of group data confirmed that synchronized septal stimulation during limbic seizures led to partial recovery of frontal slow activity, with a significant increase in delta power (Fig. 7C, bottom row), not seen during seizures without septal stimulation (Fig. 7B, bottom row). Furthermore, whereas lesioned animals were spared the behavioral effects of hippocampal seizures when septal stimulation was not applied (preceding section), septal stimulation during seizures resulted in “behavioral arrest” (as defined above) that resembled behavior seen in nonlesioned animals. These results also imply that involvement of subcortical networks including the septum in partial limbic seizures may represent an important casual factor in the production of ictal neocortical slow activity and its associated behavioral effects.
Similar effects were observed with regional stimulation (without seizures) in animals with fornix lesions, where slowing was abolished except with synchronized activity in the hippocampus and septal area. Septal stimulation (10 Hz) of awake animals without a lesion elicited large-amplitude slow activity in the frontal cortex, resulting in significant delta LFP power increases in group data (Fig. 8A, left); however, the same stimulation in animals with a fornix lesion did not result in cortical slow oscillations or delta power elevations (Fig. 8B, left). We observed that synchronous 10 Hz stimulation of both the septal area and hippocampus in the absence of a seizure resulted in a partial recovery of the neocortical slow oscillations and elevated delta power (Fig. 8, compare left panels in A, C). Interestingly, asynchronous stimulation (50 ms offset) of both the septal area and dorsal hippocampus simultaneously at 10 Hz for 60 s did not produce cortical slow oscillations and elevated delta power (Fig. 8C, right), contrasted with synchronous stimulation (Fig. 8C, left). Behavior effects in all cases were found to be closely related to the absence or presence of neocortical slow activity. Thus, in animals with no lesion (Fig. 8A), behavior was altered in septal but not hippocampal stimulation; a fornix lesion (Fig. 8B) abolished behavioral arrest during stimulation; and synchronous but not asynchronous septal plus hippocampal stimulation (Fig. 8C) restored behavioral impairment (unblinded observations). The fact that synchronized septal and hippocampal stimulation is necessary to elicit neocortical slow oscillations and behavioral arrest suggests that convergence of signals on additional downstream subcortical structures may be crucial for the generation of impaired cortical function.

In fornix-transected animals, synchronized septal and hippocampal stimulations are needed to produce cortical delta power elevations. A, In nonlesioned rats, septal stimulation results in delta LFP power elevations in the frontal cortex, peaking at 1–3 Hz (left). Hippocampal stimulation, however, does not produce similar changes (right). B, In animals with a fornix lesion, neither septal (left) nor dorsal hippocampal (right) stimulation elicits ictal neocortical slow activity or elevated delta LFP in the frontal cortex. C, Synchronized 10 Hz stimulation of both the septum and hippocampus in lesioned animals results in elevated frontal cortical delta power, reflecting neocortical slow activity (left). However, asynchronous 10 Hz stimulation of both regions, with each hippocampal pulse offset 50 ms from every septal pulse, does not cause increased cortical delta power. EEG power spectra are generated from 1–20 Hz LFP data during the stimulus train, normalized to the peak amplitude of a 60 s baseline (peak power at baseline was 1; baseline not shown). All stimulations are performed after antiepileptic administration (diazepam), and each consists of a 60 s train of 10 Hz pulses applied at a current found to produce seizures before antiepileptic administration. Mean results (+SEM) are shown for n = 21 (A, left), n = 12 (A, right), n = 15 (B, left), n = 9 (B, right), n = 7 (C, left), and n = 13 (C, right) rats (1 animal per stimulation per condition). *p ≤ 0.05, two-tailed t test comparing change in delta power versus baseline. HC, Hippocampus; STIM, stimulation.
Discussion
We found that limbic seizures activate subcortical structures, cause neocortical deactivation, and impair consciousness. Fornix lesions prevent seizures from reaching subcortical structures such as the septum and prevent cortical slow waves and behavioral changes during seizures. These findings may provide important mechanistic insights into human TLE, a common neurological disorder often associated with significant neocortical dysfunction (Devinsky, 2004; Helmstaedter and Kockelmann, 2006; Laurent and Arzimanoglou, 2006). We have proposed a “network inhibition hypothesis,” through which focal seizures cause widespread cortical deactivation in nonseizing areas by inhibiting the SAS (Norden and Blumenfeld, 2002; Blumenfeld and Taylor, 2003). In support of this, previous human studies showed slow activity on EEG and decreased CBF in frontoparietal association cortex during temporal lobe seizures with impaired consciousness (Blumenfeld et al., 2004a,b), as well as subcortical involvement (Arthuis et al., 2009). We recently developed an animal model replicating human neocortical slow activity and behavioral arrest during limbic seizures (Englot et al., 2008), demonstrating that ictal neocortical slow activity resembles depressed cortical states such as sleep, coma, or deep anesthesia (Steriade et al., 1993; Cowan and Wilson, 1994; Ebersole and Pedley, 2003; Haider et al., 2006). However, the possible role of subcortical networks in generating this abnormal activity has not been investigated.
In the present study, we used fMRI with group analysis to identify the septal area and medial thalamus as subcortical structures activated during hippocampal seizures. Direct physiological recordings from these subcortical regions and hippocampus demonstrated 9–12 Hz excitatory seizure activity along with elevated CBF and neuronal activity. Orbital frontal cortex meanwhile demonstrated 1–3 Hz slow waves accompanied by decreases in fMRI, MUA, and CBF measurements. We then stimulated the dorsal hippocampal, septal area, or mediodorsal thalamus using a stimulation pattern modeled after the typical frequency and duration of spike activity seen in these regions during seizures. Although hippocampal or thalamic stimulation in the absence of a seizure did not produce appreciable effects on cortical activity or behavior, stimulation of the septal area elicited behavioral arrest and slow waves in the frontal cortex resembling changes during ictal neocortical slow activity. Our interpretation, that involvement of subcortical structures such as the septum during hippocampal seizures may contribute to the production of ictal neocortical slow activity, is supported by the observation that fornix transection diminished not only septal spike activity but also cortical slow waves and behavioral arrest ictally. Furthermore, synchronized stimulation of the septal area during hippocampal seizures allowed a partial “recovery” of the electrographic and behavioral consequences of ictal neocortical slow activity, implying a specific correlation between these effects and subcortical involvement during seizures.
These findings suggest a model in which high-frequency activity during limbic seizures converges on subcortical activating systems through polysynaptic inhibitory pathways, causing cortical deactivation. Presumably, septal activation, during seizure propagation or direct electrical stimulation, contributes to either direct inhibition of the neocortex or diminished cortical excitation. Does the septum reduce cortical activity through direct inhibitory projections to the cortex? Probably not, as we observed a long half-peak latency from single septal stimuli to cortical Down states consistent with a polysynaptic mechanism, as a monosynaptic effect would likely be detected within the first 20 ms (Lee and Hablitz, 1991; Racine et al., 1995). One possibility is that involvement of the medial septal nuclei could influence the hippocampus, which may lead to neocortical deactivation through polysynaptic mechanisms. Alternatively, the predominantly GABA-containing inhibitory neurons in the lateral septum could play an important role. No direct projections from lateral septum to orbital frontal cortex have previously been found, to our knowledge (Risold and Swanson, 1997; Colom et al., 2006). However, previous animal studies have suggested that the septum does project to other regions involved in normal cortical activation, such as the hypothalamus and basal forebrain (Mesulam and Mufson, 1984; Varoqueaux and Poulain, 1999). Thus, septal activation during electrical stimulation or seizure activity may inhibit the SAS, leading secondarily to diminished cortical excitation.
Based on our results, we present a speculative model in which inhibitory influences converge on SAS. We propose that at least two converging polysynaptic inhibitory influences are needed to suppress the SAS and produce neocortical slowing (Fig. 9). These pathways could include the following: inhibitory septal projections that are not damaged by a fornix lesion (pathway A), inhibitory septal projections that are obliterated during fornix transection (pathway B), and inhibitory influence of the hippocampus onto SAS, either directly or through intermediary structures (pathway C). Limbic seizure activity would normally activate all three pathways (A+B+C), causing inhibition of the SAS and neocortical slowing. Septal stimulation (A+B) also results in sufficient SAS inhibition to produce neocortical slow activity. Fornix transection (Fig. 9, dashed X) blocks the phenomenon during either hippocampal seizures (C) or septal stimulation (A) alone. However, synchronous A+C activation does elicit the phenomenon.

Model depicting possible converging subcortical inhibitory pathways contributing to ictal neocortical slow activity. Although drawn as single lines, pathways A–C are all assumed to be polysynaptic. During seizures in the hippocampus, seizure activity propagates to the septum through fibers in the fornix. This may lead to increased inhibition of SAS structures via inhibitory septal projections either separate from the fornix (A) or in proximity to the fornix (B), and possibly also through other connections originating from the hippocampus (C). Inhibition of SAS results in diminished neocortical activation and a depressed cortical state associated with ictal neocortical slow activity and behavioral arrest. When a seizure is not occurring, stimulation of the septum but not the hippocampus also results in neocortical depression and behavioral arrest, suggesting pathways A+B alone but not C alone are sufficient to produce this effect. After transection of the fornix (dashed X), neither seizures nor stimulations in the hippocampus cause cortical inhibition, further suggesting pathway C alone is not sufficient to product the effect. In lesioned animals, isolated septal stimulation (activating A alone) also does not cause cortical depression, but synchronous septal and hippocampal stimulation (activating A+C simultaneously) does result in cortical slow waves and behavioral arrest. Therefore, synchronous A+B or A+C activation causes neocortical slow activity, but stimulating pathways A or C alone does not produce the effect.
The identities of the proposed pathways and SAS structures contributing to neocortical deactivation will require additional fMRI and physiological studies of more ventral structures such as the basal nucleus, hypothalamus, entorhinal cortex, and brainstem. We recently reviewed SAS structures and pathways that may contribute to ictal neocortical slow activity in detail (Englot and Blumenfeld 2009), so we will discuss these only briefly here. The basal nucleus receives inhibitory septal projections and excites the neocortex via acetylcholinergic fibers, and lesions there produce increased neocortical slow waves similar to those we observed (Buzsaki et al., 1988; Bringmann, 1996; Duque et al., 2000). The hypothalamus, amygdala, and entorhinal cortex also modulate cortical excitation and have been shown to be involved in limbic seizures (Cirino and Renaud, 1985; Dringenberg and Vanderwolf, 1996; Chrobak et al., 2000; Saper et al., 2001; McIntyre and Gilby, 2008). Finally, there are numerous structures crucial for neocortical activation in the upper brainstem (Steriade, 1996), an area shown to be activated during neuroimaging studies of TLE in humans (Blumenfeld et al., 2004a; Tae et al., 2005; Hogan et al., 2006) and connected to lateral septal nuclei via the stria medullaris (Ross and Grossman, 1977). Finally, although the thalamus did not reproduce neocortical slow activity when stimulated in a similar manner to the septum, it likely contributes directly or indirectly to altered SAS function in limbic seizures given its known role in arousal.
Another interesting observation in this study is that brief pulses to the septal area typically resulted in a Down state of neuronal firing in the cortex, accompanied by a large voltage deflection on LFPs (Fig. 4). Previous investigations have shown that applying an electrical shock to white matter tracts can produce a brief (<50 ms) epoch of cortical excitation that is followed by a Down state in vivo (Timofeev et al., 1996) and in cortical slices (Shu et al., 2003). Another study found that single whisker deflections can terminate Up states in the rat barrel cortex (Hasenstaub et al., 2007), although similar effects were not elicited in the cat primary visual cortex during brief random stimulation of visual receptive fields (Haider et al., 2007). Our present methods of using a 1 ms septal pulse to evoke a Down state of cortical firing in vivo may thus represent another useful model for understanding normal neocortical circuit activity.
There are several limitations to our present mechanistic study. As discussed above, the possible role of other cortical and subcortical structures should be investigated. Also, the septum is a heterogeneous region, and our septal stimulation paradigm likely influenced various structures, such as the lateral and medial septal nuclei, the nucleus of the diagonal band, and the fornix. It will be important in future studies to further elucidate the possible role of these specific subregions in ictal neocortical deactivation. In addition, whereas we used physiologically comparable stimuli for regional stimulation of the thalamus, septum, and hippocampus in awake-behaving animals, it will be important in future studies to examine the effects of a range of stimulus intensities in each region. Next, although we are encouraged by the consistency between our blinded and unblinded behavioral observations, it will be important to use more detailed behavioral tasks in future studies. Whereas our previous work showed similar neocortical slow activity and behavioral arrest in rats during spontaneous seizures (Englot et al., 2008), the present study was done entirely with evoked seizures and stimulation. Although significantly more time consuming and technically challenging, a spontaneous seizure model should ultimately be used to confirm the present results. Finally, medications were needed to prevent seizure generalization in rats; however, this actually closely mimics the situation in human TLE, where patients taking anticonvulsants typically have partial seizures with impaired consciousness and rarely secondarily generalize (Perruca, 2004).
In summary, we found additional evidence that ictal neocortical slow activity represents a state of suppressed cortical activity starkly contrasted with excitatory hippocampal seizure activity during partial limbic seizures. Subcortical structures such as the septal area are intensely involved during limbic seizures and may play an important role in the production of ictal neocortical slow activity, since fornix transection prevents both electrographic and behavioral correlates of the phenomenon. An expanded knowledge of these problems may facilitate our capacity to understand, and eventually prevent, the adverse cognitive effects seen during seizures in patients with TLE.
Footnotes
-
This work was supported by National Institutes of Health Grants R01 NS049307 (H.B.), F30 NS59074 (D.J.E.), and P30 NS052519 (F.H.) and by the Betsy and Jonathan Blattmachr family. We thank N. Danielson for imaging analysis, S. Clifford for help with Spike2 scripts, and B. Haider for useful discussions about data.
- Correspondence should be addressed to Dr. Hal Blumenfeld, Department of Neurology, Yale University School of Medicine, 333 Cedar Street, New Haven, CT 06520. hal.blumenfeld{at}yale.edu


