

Abstract
The long-lasting actions of the inhibitory neurotransmitter GABA result from the activation of metabotropic GABAB receptors. Enhanced GABAB-mediated IPSCs are critical for the generation of generalized thalamocortical seizures. Here, we demonstrate that GABAB-mediated IPSCs recorded in the thalamus are primarily defined by GABA diffusion and activation of distal extrasynaptic receptors potentially up to tens of micrometers from synapses. We also show that this diffusion is differentially regulated by two astrocytic GABA transporters, GAT1 and GAT3, which are localized near and far from synapses, respectively. A biologically constrained model of GABA diffusion and uptake shows how the two GATs differentially modulate amplitude and duration of GABAB IPSCs. Specifically, the perisynaptic expression of GAT1 enables it to regulate GABA levels near synapses and selectively modulate peak IPSC amplitude, which is primarily dependent on perisynaptic receptor occupancy. GAT3 expression, however, is broader and includes distal extrasynaptic regions. As such, GAT3 acts as a gatekeeper to prevent diffusion of GABA away from synapses toward extrasynaptic regions that contain a potentially enormous pool of GABAB receptors. Targeting this gatekeeper function may provide new pharmacotherapeutic opportunities to prevent the excessive GABAB receptor activation that appears necessary for thalamic seizure generation.
Introduction
Neurotransmitter diffusion out of synapses—called “spillover”—has been implicated in several physiological processes ranging from synaptic plasticity (Schmitz et al., 2000) to synaptic coordination/amplification (Christie and Westbrook, 2006). Spillover is also hypothesized to be required for the activation of sufficient numbers of receptors to generate robust postsynaptic currents (Dutar and Nicoll, 1988; Isaacson et al., 1993; Kim et al., 1997; Scanziani, 2000). Such appears to be the case with the activation of postsynaptic currents mediated by GABAB receptors.
GABAB receptors are G-protein-coupled receptors (GPCRs) that mediate the metabotropic actions of GABA (Bettler et al., 2004; Couve et al., 2004). Evidence indicates that activation of GABAB receptors requires GABA spillover. First, GABAB receptors are primarily localized extrasynaptically (Fritschy et al., 1999; Kulik et al., 2002). Second, GABAB-mediated IPSCs often require strong stimuli that presumably promote GABA spillover (Dutar and Nicoll, 1988; Isaacson et al., 1993; Huguenard and Prince, 1994; Kim et al., 1997; Scanziani, 2000). Third, blocking GABA transporters (GATs) facilitates hippocampal GABAB-mediated IPSCs (Thompson and Gähwiler, 1992; Isaacson et al., 1993; Scanziani, 2000). Despite the importance of spillover, little is known exactly how GABA diffusion in the extrasynaptic space shapes GABAB IPSCs. Indeed, most studies of neurotransmitter diffusion have focused on ionotropic receptor activation very near synaptic release sites during the brief period relevant for their activation (Overstreet et al., 2000; Balakrishnan et al., 2009; Scimemi et al., 2009). Few studies have developed models of high-affinity metabotropic receptor-mediated responses that are sensitive to the low levels of neurotransmitter that likely persist in distal regions after diffusion-related dilution and/or uptake.
GABA spillover and GABAB receptor activation is particularly important in the thalamus. Blocking GABA transport increases thalamic seizure activity in rodents (Coenen et al., 1995) and humans (Vinton et al., 2005). Also, in vitro (Kim et al., 1997; Bal et al., 2000; Blumenfeld and McCormick, 2000) and in vivo (Liu et al., 1992; Smith and Fisher, 1996; Vergnes et al., 1997) studies show that enhanced GABAB receptor function is critical for thalamic seizure generation. Collectively, these studies suggest that increasing GABAB receptor activity by promoting GABA spillover exacerbates seizures.
Here, we aim to understand how GABA spillover determines receptor activation. Several anatomical studies have described the subcellular localization/densities of thalamic GABAB receptors and GATs (De Biasi et al., 1998; Fritschy et al., 1999; Chiu et al., 2002; Kulik et al., 2002; Vitellaro-Zuccarello et al., 2003). GABA transport in the thalamus is performed by GAT1 and GAT3, two GAT subtypes that appear to be exclusively expressed by astrocytes in this brain region (De Biasi et al., 1998; Vitellaro-Zuccarello et al., 2003). By integrating our electrophysiological and anatomical results into a computational model of GABA diffusion in the thalamus, we propose that differential subcellular localization of GAT1 and GAT3 provides a mechanism that shapes GABA transients to enable selective kinetic and/or amplitude modulation of GABAB IPSCs. Moreover, this study provides a framework for understanding how the focal release of highly concentrated packets of neurotransmitter ultimately activate distal high-affinity receptors.
Materials and Methods
Slice preparation/recording procedures.
Experiments were performed in accordance with Stanford University Institutional Animal Care and Use Committee protocols. Sprague Dawley rats [postnatal day 11 (P11) to P15] were anesthetized with pentobarbital sodium (55 mg/kg), and brains were extracted and placed in chilled (4°C) oxygenated slicing solution containing the following (in mm): 234 sucrose, 26 NaHCO3, 11 glucose, 10 MgSO4, 2.5 KCl, 1.25 NaH2PO4, and 0.5 CaCl2. Four hundred-micrometer-thick horizontal slices containing thalamus were collected using a vibratome (Leica Microsystems) and then placed in a holding chamber containing physiological saline for 1 h at 34°C, followed by incubation at room temperature. During recording, slices were continuously perfused with physiological saline containing the following (in mm): 126 NaCl, 26 NaHCO3, 10 glucose, 2.5 KCl, 2 CaCl2, 1.25 NaH2PO4, and 1 MgSO4. Intracellular recordings were performed in a submerged chamber in which slices situated on nylon netting were continuously perfused with warm (34°C) oxygenated physiological saline (3 ml/min). Intracellular, voltage-clamp recordings (Vhold, −50 mV) were made in the whole-cell patch-clamp configuration using pulled borosilicate pipettes (Sutter Instrument) filled with a potassium gluconate-based solution containing the following (in mm): 100 K-gluconate, 13 KCl, 10 EGTA, 10 HEPES, 9 MgCl2, 2 Na2-ATP and 0.5 Na-GTP, 0.07 CaCl2, pH 7.4. Electrical stimuli were delivered with a bipolar stimulating electrode. Slices were visualized with an Axioskop microscope (Zeiss). Recordings were obtained with a Multiclamp 700A amplifier (Molecular Devices) and digitized/acquired onto computer with a Digidata 1322A acquisition system (Molecular Devices). Data were analyzed with Clampfit (Molecular Devices), Origin 6.1 (OriginLab), and Excel (Microsoft). Statistical analyses were performed with SigmaStat 1.0 (SPSS). Data are expressed as means ± SE. The figures and movies were made with CorelDRAW (Corel) and Matlab (The MathWorks).
Pharmacology.
GABAB-mediated IPSCs were isolated by adding the GABAA receptor antagonist bicuculline methiodide (10 μm; Sigma-Aldrich), the NMDA receptor antagonist APV (50 μm; Tocris), and the AMPA/kainate receptor antagonist DNQX (20 μm; Tocris) to the bath perfusate. To minimize the effects of gradual GABA depletion during experimentation, the metabolic substrate of GABA, glutamine (300 μm; Sigma-Aldrich), was added to the bathing medium (Tani et al., 2007; Bryant et al., 2009). GAT antagonists were applied via a local perfusion system (ValveLink 8; AutoMate Scientific), which consists of a small (200–300 μm) glass tube supplied by a reservoir of drug-containing solution. The end of the local perfusion tube was positioned at the surface of the ventrobasal thalamic nucleus (VB), and flow was directed away from the reticular thalamic nucleus (RT) (and in the same direction of the bath flow). The GAT1 blocker NO-711 [(1,2,5,6-tetrahydro-1-[2-[[(diphenylmethylene)amino]oxy]ethyl]-3-pyridinecarboxylic acid hydrochloride] and GAT3 blocker SNAP-5114 [1-[2-[tris(4-methoxyphenyl)methoxy]ethyl]-(S)-3-piperidinecarboxylic acid] were both purchased from Tocris. The local perfusate was heated (34°C) and oxygenated with custom-made devices.
IPSC analysis.
IPSCs were evoked once every 10 s, and the amplitude and kinetics were measured throughout the experiment. Control, manipulation, and wash values for each measurement represent the mean value derived from the last 10 responses in each condition. To determine IPSC decay, responses were fit with two exponential time constants, similar to the study by Otis et al. (1993). Decay fits began 20–40 ms after the peak of the IPSC. A subset of IPSCs were analyzed by simultaneously fitting the rising and decaying components of the response. Although this approach yielded slightly different decay values, the relative changes induced by manipulations were comparable with those measured by only fitting the decay.
Immunocytochemistry.
GAT1 and GAT3 primary antibodies were obtained from Millipore Bioscience Research Reagents. Gephyrin and vesicular GABA transporter (VGAT) primary antibodies were obtained from Synaptic Systems. Secondary antibodies were obtained from Invitrogen. Thirty-five- to forty-micrometer-thick thalamic sections containing VB and RT were obtained with a microtome (Microm; HM 400). Free-floating sections were preincubated with 50% alcohol, and then in PBS containing 10% normal goat serum, followed by incubation with primary antibodies. Slices were then rinsed in PBS and incubated with fluorescently labeled secondary antibodies. Sections were mounted on slides using Vectashield Mounting Media, and immunofluorescence was assessed with a laser confocal microscope (Zeiss LSM 510).
Ten micrometer Z-stack images were obtained, and the three-dimensional centroid coordinates of each immunopositive particle were determined with Volocity (Improvision). Particles were defined as three or more consecutive immunopositive voxels (size, 90 × 90 × 500 nm). Distances between particle centroids were then calculated and used to generate a radial analysis describing the GAT1/3 particle density surrounding each synaptic marker. Density profiles were fit with a biexponential decay constant plus baseline, which was not confined to zero, from which a weighted space constant [λw = Σi(amplitudei*λi)/Σi(amplitudei)] was derived. The baseline for the fits was a free parameter. When fit in this manner, the largest difference in GAT1 versus GAT3 density distribution was in the space constant (i.e., 3-fold longer for GAT3), and, to a lesser extent, steady-state levels (i.e., 1.6-fold larger baseline values for GAT3). The λw values used in our model were the average of individual values derived from both gephyrin- and VGAT-stained tissue. Supplemental Figure S2 (available at www.jneurosci.org as supplemental material) further describes these methods.
Simulations.
Modeling GABA diffusion/GABAB receptor binding was performed with MCell (Stiles and Bartol, 2001). The model was constructed according to anatomical observations of Cucchiaro et al. (1991). Reticular (RT) neuron bouton diameter ranges between 0.85 and 1.6 μm, and the synaptic contact length made with thalamocortical (TC) neurons ranges between 470 and 635 nm. Therefore, we constructed a model that consisted of a cluster of five 800-nm-wide RT boutons that were directly apposed by five ∼500-nm-wide TC neuron postsynaptic sites. A 32 nm synaptic cleft separated the RT and TC neuron compartments, and model synapses were ∼900 nm apart. The aforementioned lengths and distances were used so that the three-dimensional model had appropriate tortuosity and volume fraction values (Tao et al., 2005). Matlab scripts were written to generate the MDL (Model Description Language) files required for MCell model construction. MCell simulated the diffusion of GABA throughout the model. GABA that diffused beyond the confines of the model was destroyed (i.e., “absorbed” by model boundaries). The model was large enough, as simulations performed with reflective model boundaries yielded results similar to those with absorptive boundaries (supplemental Movie S3, clip A, available at www.jneurosci.org as supplemental material). We also confirmed that GABA diffusion and receptor binding was symmetrical in X–Z directions (supplemental Movie S3, clip B, available at www.jneurosci.org as supplemental material). As the GABAA receptors were blocked throughout our physiological experiments, GABAA receptors were not included in the model synapse. The affinity of GABAB receptors for GABA was set at the experimentally derived value of 1 μm (Sodickson and Bean, 1996). To this end, the kon rate was 5 × 10⁶ m−1s−1 and the koff was 5 s−1. The affinity of GAT1 and GAT3 for GABA are similar (Clark and Amara, 1994; Borden, 1996) and were defined according to previous modeling efforts (Overstreet et al., 2002): kon = 5 × 10⁶ m−1s−1; transportation, 20 s−1. Also similar to the study by Overstreet et al. (2002), we implemented a GABA unbinding property (koff = 20 s−1). These kinetic schemes are outlined in supplemental Figure 3G (available at www.jneurosci.org as supplemental material). Simulations were run with 2–4 μs time steps on a supercomputer (“Salk”) generously maintained by the Pittsburgh Supercomputing Center. Results were analyzed with Matlab.
Results
GAT1 and GAT3 differentially modulate GABAB IPSCs
GABAB-mediated IPSCs were recorded in voltage-clamped TC neurons of the VB in brain slices. IPSCs were triggered by electrical stimulation which elicits bursts of action potentials in presynaptic GABAergic neurons of the RT nucleus (Fig. 1A). GABAB-mediated IPSCs were isolated by bathing slices in ionotropic glutamate receptor (50 μm APV/20 μm DNQX) and GABAA receptor (10 μm bicuculline) blockers. Responses were evoked once/10 s while applying control (∼5 min) and GAT antagonist solutions (∼15 min) selectively to VB via a local perfusion system, thereby limiting the effects of GAT blockade to RT–TC synapses while leaving presynaptic excitability of RT neurons unaffected. Four micromolar NO-711 (IC50, ∼250 nm) (Sitte, 2002) was used to block GAT1 transport, whereas 100 μm SNAP-5114 (IC50, 5 μm) (Borden et al., 1994) was used to block GAT3 transport. These concentrations theoretically block ∼95% of their respective GATs.

GABAB-mediated IPSCs during GABA transporter blockade. A, Schematic of thalamic slice preparation in which whole-cell recordings of TC neurons in the VB were obtained while directly stimulating neurons of the RT. GAT antagonists were applied via local perfusion in VB. B, IPSCs during complete GAT blockade. GABAB IPSCs were evoked once/10 s during control (∼5 min), GAT1 blockade (∼15 min), combined GAT1 and GAT3 blockade (∼20 min), followed by a washout period. NO-711 was used by block GAT1, whereas SNAP-5114 was used to block GAT3. B1, IPSCs during GAT1 (NO-711), and then GAT1 plus GAT3 blockade (NO-711 plus SNAP-5114). B2, Time series plot showing evolution of IPSC decay during GAT1, and then combined GAT1/3 blockade. B3, Quantification of decay (τdw) during combined blockade compared with GAT1 block alone, which had no effect on decay. Raw (left) and normalized (right) data are shown. The combined blockers increased decay by 981%. C, IPSCs during either GAT1 or GAT3 blockade. C1, Example GABAB IPSCs during either NO-711 (left) or SNAP-5114 (right) application. The insets shows IPSCs normalized to peak amplitude. C2, Time series measuring IPSC amplitude during either GAT1 or GAT3 blockade. SNAP-5114 (○; n = 13) had a greater effect on the IPSC amplitude than NO-711 (•; n = 13). D, Quantification of IPSC amplitude (D1) and decay (τdw) (D2) during GAT1 versus GAT3 blockade. Plots show raw (left) and relative (i.e., normalized-to-control; right) changes. The normalized amplitude and decay changes were larger during SNAP-5114 versus NO-711 (p < 0.0005, t test). The two points of each continuous line in raw plots constitute the control (left point) and GAT blocker (right point) for an individual VB cell recording. The three bars in normalized plots correspond to data from control (white), GAT blockade (black), and wash (gray) conditions. Example IPSCs are the average of 10 responses during the final ∼1.5 min of each condition. Error bars indicate SEM. See Tables 1⇓–3 for raw data values.
To assess the dependence of GABAB IPSCs on GAT-mediated transport, we first examined the actions of combined GAT1 and GAT3 blockade (Fig. 1B). Combined NO-711 and SNAP-5114 application increased GABAB IPSC duration ∼10-fold. Similar to currents observed by Otis et al. (1993), we found that under control conditions IPSC decay was best fit with a double exponential that consisted of a fast, large-amplitude component (∼100 ms, τfast) and a slower, smaller component (τslow >0.5 s), from which a weighted decay time constant (τdw) was calculated (see Materials and Methods). The τdw and half-width of GABAB-mediated IPSCs increased by 981 ± 222 and 1047 ± 272%, respectively, during NO-711/SNAP-5114 application (Fig. 1B, Table 3), compared with NO-711 application alone, which did not affect these measures. These results indicate that (1) the relatively brief (∼300 ms) duration that characterizes GABAB IPSCs (Isaacson et al., 1993; Otis et al., 1993; Scanziani, 2000) is dependent on active GABA uptake, and (2) the pool of GABAB receptors that can be activated by synaptic GABA release is much larger and widespread than the number of receptors activated when uptake is intact. Despite having robust actions on IPSC duration, blocking both GATs had highly variable effects on IPSC amplitude, sometimes increasing and sometimes decreasing it. Overall, however, there was no significant net change (Table 3) (see Discussion).
Once the requirement of GAT-mediated transport for shaping GABAB IPSCs was established, we next determined whether GAT1 and GAT3 differentially modulate the IPSC. Application of either GAT antagonist alone increased the amplitude of evoked GABAB-mediated IPSCs, whereas only GAT3 blockade altered IPSC kinetics (Fig. 1C,D, Tables 1, 2). NO-711 increased peak IPSC amplitude in 13 of 13 cells, leading to a mean increase of 50 ± 2% (p < 0.0001) (Fig. 1D). SNAP-5114 also increased IPSC amplitude in all recorded cells but had a greater effect, increasing the amplitude by 118 ± 14% (p < 0.0001; n = 13) (Fig. 1D). GAT3 blockade also increased τdw in 11 of 13 cells (mean increase, 41 ± 8%; p < 0.0005) (Fig. 1D). In contrast, GAT1 blockade increased τdw in seven of the recorded cells and decreased τdw in the remaining six, leading to no detectable effect on the population (p = 0.17) (Fig. 1D). We also measured the effects of GAT1 and GAT3 blockade on IPSC half-width, a kinetic measure that does not rely on fitting traces with specific models. These analyses yielded results consistent with the aforementioned τdw measures. Specifically, GAT1 blockade had mixed actions on IPSC half-width, increasing this parameter in seven cells and decreasing it in the remaining six, leading to a small-yet-statistically insignificant increase of 7 ± 2% (p = 0.06; n = 13) (Table 1). GAT3 blockade, in contrast, increased IPSC half-width in all recorded cells (mean increase, 60 ± 7%; p < 0.0005; n = 13) (Table 2).
Quantification of experimental results: GAT1 antagonist (NO-711; 4 μm)
Quantification of experimental results: GAT3 antagonist (SNAP-5114; 100 μm)
Quantification of experimental results: combined GAT1 plus GAT3 antagonists
It is noteworthy that IPSC decay rate was mostly independent of amplitude [i.e., there was only a weak correlation between amplitude and decay (r = 0.13, linear regression)]. This suggests that the amount of GABA released does not directly modulate the response duration, assuming that synapse morphology and receptor/transporter distribution is relatively stable across the multiple recordings that comprise this data set. Moreover, initial (i.e., control) IPSC amplitude did not correlate well with the relative duration change observed during either GAT1 or GAT3 blockade (r = 0.07, linear regression). Thus, the differential effect of GAT1/GAT3 blockade cannot be readily explained by differences in the amount of GABA released.
As both GAT1 and GAT3 appear to be exclusively localized to astrocytes in the thalamus (De Biasi et al., 1998; Vitellaro-Zuccarello et al., 2003), we tested for an astrocytic role in GABA uptake by obtaining whole-cell voltage-clamp recordings from VB astrocytes under similar physiological conditions used to evoke GABAB IPSCs in TC cells. Astrocytes were characterized by low input resistance, fast membrane time constant, hyperpolarized resting membrane potential and lack of electrical excitability. Synaptic stimuli that produced outward GABAB IPSCs in TC cells produced concurrent inward currents in astrocytes. Both NO-711 and SNAP-5114 reduced the amplitude of the evoked current in astrocytes (n = 5 each GAT blocker) (data not shown). The opposite effect on astrocytic versus neuronal responses supports the conclusion that astrocytic inward currents are mediated at least in part by GATs. Although these experiments do not rule out a contribution of neuronal GABA uptake, they emphasize the role of astrocytic GATs in thalamic GABA metabolism. Consistent with this is the finding that astrocytic GABA metabolism is critically involved in maintaining epileptiform thalamic network oscillations (Bryant et al., 2009).
To understand the mechanisms underlying the differential effects of GAT1/GAT3 blockade, we later develop a theoretical model of GABA diffusion and transport near synapses. To do so, it was critical to first establish that the effects we report above resulted from complete blockade of GAT1 or GAT3, respectively. Therefore, we next examined the effects of the GAT blockers at 2 and 10 times their theoretically saturating concentrations. If 4 μm NO-711 and 100 μm SNAP-5114 represent full blockade, then increasing their respective concentrations should not yield different results. Indeed, 8 and 40 μm NO-711 increased IPSC amplitude by 40 ± 5 and 47 ± 6%, respectively, but did not alter IPSC decay (supplemental Fig. S1A, available at www.jneurosci.org as supplemental material). Two hundred micromolar SNAP-5114 increased amplitude by 122 ± 14% and increased τdw by 40 ± 18%, effects comparable with values obtained with 100 μm SNAP-5114 (supplemental Fig. S1B, available at www.jneurosci.org as supplemental material). Assessing the effects of 1 mm SNAP-5114 was complicated because the IC50 of SNAP-5114 for blocking GAT1 is 388 μm (Borden, 1996). Indeed, we found that the effects 1 mm SNAP-5114 were consistent with combined GAT1 and GAT3 blockade (supplemental Fig. S1B, available at www.jneurosci.org as supplemental material; compare Fig. 1B1).
Previous work has demonstrated that local perfusion effectively changes the extracellular (i.e., synaptic) environment of neurons recorded in brain slices (Kumar et al., 2002). Consistent with this finding is the observation that bath-applied 4 μm NO-711 and 100 μm SNAP-5114 yielded results similar to those generated with local application of the blockers (p > 0.05) (supplemental Fig. S1C, available at www.jneurosci.org as supplemental material).
Although NO-711 consistently increased IPSC amplitude, under no conditions did it affect IPSC duration. Small sample sizes likely did not contribute to the latter result because no duration effect was observed when data from all NO-711 trials (4, 8, 40 μm, bath) were pooled (n = 32) (supplemental Fig. S1D, available at www.jneurosci.org as supplemental material; see figure for pooling analyses). In contrast, pooled SNAP-5114 data (100, 200 μm, bath; n = 23) continued to show that GAT3 blockade increased IPSC amplitude and decay (supplemental Fig. S1D, available at www.jneurosci.org as supplemental material). Overall, these results demonstrate that GAT1 primarily modulates IPSC amplitude, whereas GAT3 affects both IPSC amplitude and duration.
GABA transporter subtypes are differentially localized
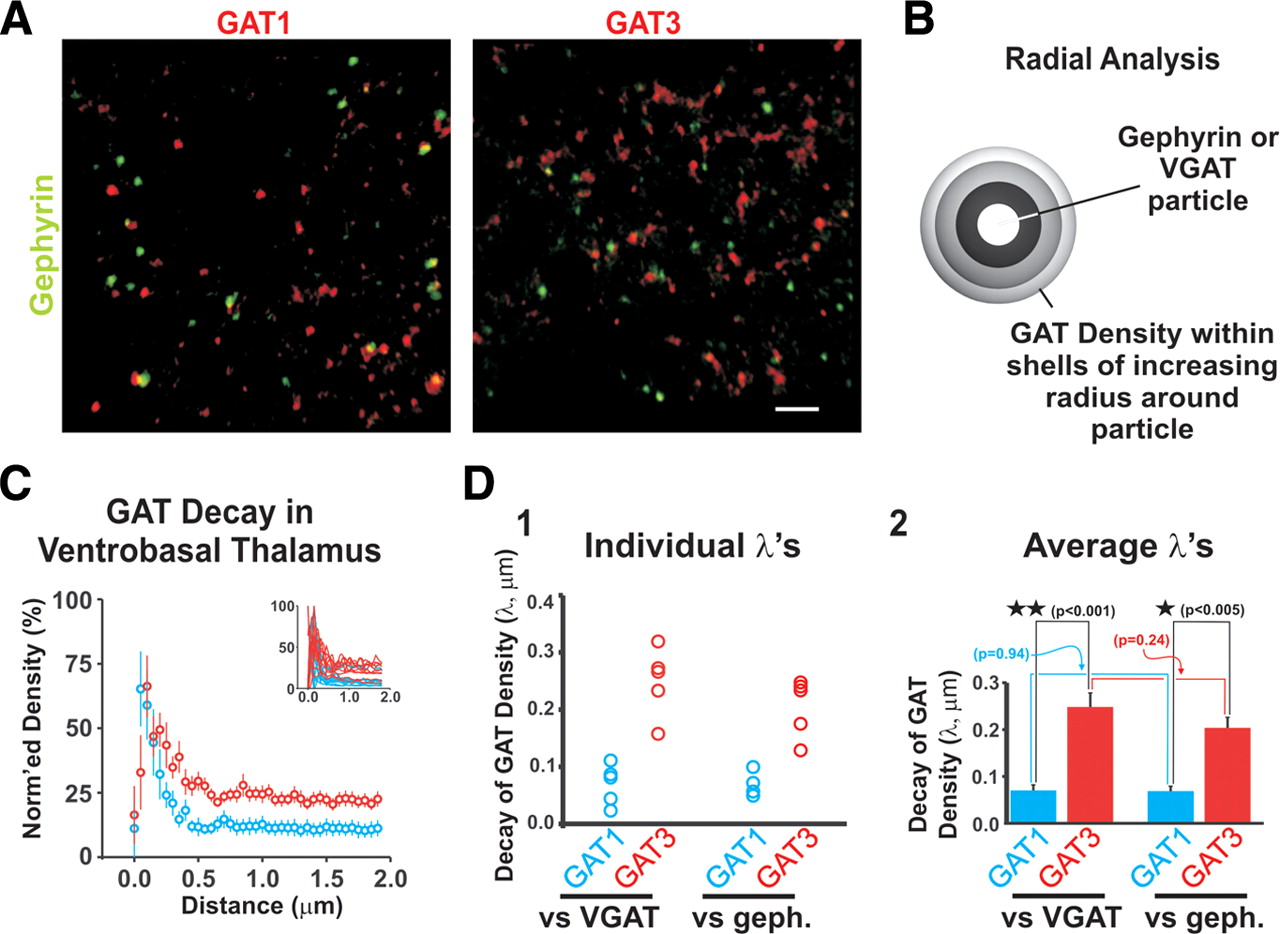
GAT expression in the thalamus is restricted to astrocytes, and GAT3 expression is higher than that of GAT1 (De Biasi et al., 1998; Vitellaro-Zuccarello et al., 2003). Furthermore, GAT1 expression is primarily found in distal astrocytic processes, whereas GAT3 is localized both distally as well as in somatic and proximal processes (De Biasi et al., 1998). As astrocytic endfeet (i.e., distal ends of astrocytic branches) envelope synapses (Bushong et al., 2002; Cubelos et al., 2005), this latter observation suggests that GAT1 accumulates in regions close to synapses, whereas GAT3 is found in both perisynaptic and extrasynaptic areas. To further assess differential GAT localization, we used immunohistochemical techniques to stain thalamic brain slices for putative GABAergic synapses and then costained for either GAT1 or GAT3. Synaptic sites were stained with antibodies against either the postsynaptic GABAA receptor scaffolding protein gephyrin or the presynaptic GABA vesicular transporter VGAT (Fig. 2; supplemental Fig. S2, available at www.jneurosci.org as supplemental material). Radial analyses were performed in which the particle density of GAT1 or GAT3 was measured in concentric shells of increasing radius (increments, 100 nm) around each synaptic marker (identified by clusters of adjacent, stained voxels). It is noteworthy that this analysis reports localization at a resolution greater than expected from the diffraction limit of light-level optics. This is justified based on two factors: (1) the radial analysis used distinct fluorophores for synaptic versus GAT localization and therefore does not rely on distinguishing two objects with the same spectral properties, which would be limited by the resolving power of the microscope, and (2) the location of individual particles is obtained from the centroid of many adjacent voxels, and therefore the resolution of this composite measure can be greater than that of the resolving power of individual objects. This is somewhat analogous to the approach of determining the position of “mountain peaks” via superresolution imaging (Moerner, 2006). This centroid approach has been used to describe the density of AMPA receptors with respect to synaptic sites (Brill and Huguenard, 2008). Similarly, we plotted GAT particle density versus distance from GABAergic synaptic marker. Density curves were then fit with weighted biexponential decay functions from which a weighted length constant (λw) describing how rapidly GAT1/3 expression decayed from synaptic sites was calculated (see Materials and Methods). GAT1 expression decayed more rapidly with distance from putative synapses than GAT3 expression (GAT1 λw: 0.065 ± 0.02 μm, n = 5; GAT3 λw: 0.24 ± 0.03 μm, n = 5; p < 0.001, t test) (Fig. 2D). A similar observation was found in VGAT-stained slices (GAT1 λw: 0.066 ± 0.01 μm, n = 4; GAT3 λw: 0.20 ± 0.02 μm, n = 5; p < 0.005, t test) (Fig. 2D). As an alternative to particle density analysis, we also analyzed our immunohistochemical data according to mean intensity associated with each radial shell. When analyzed in this manner, the length constants were comparable with those assessed according to particle density (supplemental Fig. S2D, available at www.jneurosci.org as supplemental material). Thus, our results indicate that GAT1 expression is primarily localized near GABAergic synapses, whereas GAT3 is localized both near and far from synapses, a finding consistent with the differential GAT1 and GAT3 staining patterns observed at the ultrastructural level (De Biasi et al., 1998).

Distinct anatomical localization of GAT1 and GAT3 in the VB nucleus of thalamus. A, Thalamic slices were stained for gephryin (or VGAT), a scaffolding protein associated with GABAergic synapses, and then costained for either GAT1 (left) or GAT3 (right). Slices were analyzed for GAT proximity to GABAergic synapses. Confocal images of stained sections are shown. Scale bar, 3 μm. B, Schematic describing radial analysis. GAT staining density was measured within concentric shells surrounding each synaptic marker to determine the number of GAT-immunopositive particles per shell volume. C, Plotted is the average GAT1 (blue) and GAT3 (red) density profile derived from radial analyses of both gephyrin- and VGAT-stained slices in the VB nucleus. Data from both gephyrin and VGAT-stained slices were combined because length constants were not different (see D). Curves were normalized to peak value. D, Weighted length constants (λw) were calculated to describe GAT1/3 density decay as a function of distance from putative synapses. Shown are λw values for GAT1 and GAT3 density in individual VGAT- and gephyrin-stained slices (D1), and corresponding average λw values (D2). λw was shorter for GAT1 density than for GAT3 density. See supplemental Figure S2 (available at www.jneurosci.org as supplemental material) for more detailed description of data analysis. Error bars indicate SEM.
We also applied the aforementioned methods to GAT expression in layer V of the cortex. In contrast to the thalamus, we did not observe significant differences in decay between the two GATs (supplemental Fig. S2E, available at www.jneurosci.org as supplemental material), a result that we attribute to factors such as higher GAT1 versus GAT3 expression in the cortex (Vitellaro-Zuccarello et al., 2003) and expression of both GATs by cortical GABAergic neurons (Minelli et al., 2003; Vitellaro-Zuccarello et al., 2003).
Modeling GABA diffusion at thalamic synapses
Our anatomical data led to the hypothesis that differential GAT localization contributes to the different physiological actions we observed during GAT1 versus GAT3 blockade. As GAT3 is likely more abundant than GAT1 in extrasynaptic regions, we hypothesized that GAT3 blockade is more likely to promote GABA spillover into such regions, resulting in recruitment of additional receptors and the observed IPSC decay prolongation. We turned to computational approaches to garner support for these hypotheses. We used MCell, a modeling platform that tracks the diffusion of molecules in three-dimensional microphysiological environments using Monte Carlo algorithms (Stiles and Bartol, 2001).
Modeling transmitter spillover into the extracellular space is complicated by the fact that the cellular architecture of brain tissue hinders diffusion (Hrabetová and Nicholson, 2004; Syková and Nicholson, 2008). The extent of such hindrance is quantified by tissue tortuosity and volume fraction, the fraction of extracellular space that comprises total tissue volume (Syková and Nicholson, 2008). Work by Tao et al. (2005) has shown that realistic molecular diffusion can be achieved with MCell-based models when the extracellular space is represented by many individual blocks containing cavities. With the appropriate block/cavity size and spacing, the tortuosity and volume fraction of a three-dimensional computational model can approximate experimentally derived values for real brain tissue (i.e., volume fraction, ≈0.2; tortuosity, ≈1.6) (Tao et al., 2005). We adopted this approach to construct a model RT–TC connection with a volume fraction of 0.205 and a tortuosity of 1.608 (for construction details, see supplemental Fig. S3, available at www.jneurosci.org as supplemental material).
Once the general cellular architecture of the model was selected, we next defined a number of model parameters specific for RT–TC connections, many of which could be derived from previous studies. RT neurons form cluster-like synapses on TC neurons in the lateral geniculate nucleus (Cucchiaro et al., 1991) and VB (Cox et al., 1996). We constructed a model that consisted of a cluster of five RT neuron presynaptic boutons that were separated by a 32 nm synaptic cleft from five TC neuron postsynaptic sites (supplemental Fig. S3, available at www.jneurosci.org as supplemental material), the dimensions of which approximated those described by Cucchiaro et al. (1991). Approximately 3000 molecules were “released” at each synapse to achieve the 1 mm peak transmitter concentrations hypothesized to occur within synapses (Clements et al., 1992; Diamond and Jahr, 1997). Next, we populated the cellular compartments with GABAB receptors. Using serial electron microscopy, Kulik et al. (2002) quantified the density of GABAB receptors in VB TC neurons and showed that receptor expression is highest (∼95 particles/μm2) around the perimeter of RT–TC synapses and gradually declines in extrasynaptic regions. We incorporated this density profile into our model by compartmentalizing the postsynaptic TC neuron membrane into 100 nm bins and defining GABAB receptor density according to their anatomical results. GABAB receptor affinity for GABA was 1 μm (Sodickson and Bean, 1996).
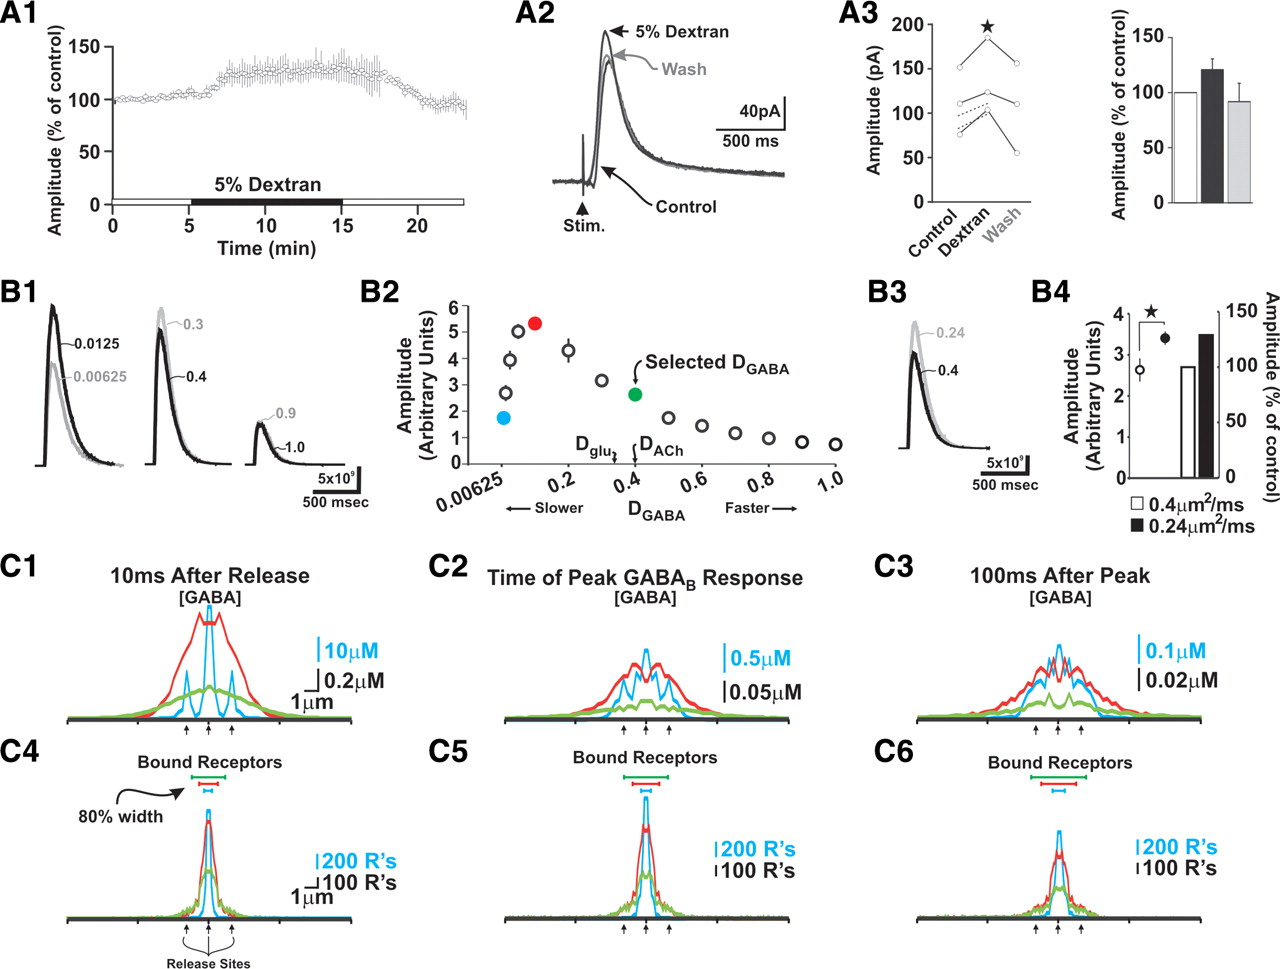
Although many features of our model could be derived from previous studies, two important parameters could not: (1) the diffusivity of GABA and (2) absolute GAT1 and GAT3 densities. We first address the former. Models of molecular diffusion are dependent on coefficients of diffusion (D) that describe diffusivity of a given molecule through a substance. Experimental results indicate that Dacetylcholine is ∼0.4 μm2/ms (Land et al., 1980) and Dglutamate is ∼0.3 μm2/ms (Min et al., 1998; Nielsen et al., 2004). Although DGABA is unknown, previous modeling efforts examining GABA diffusion have used DGABA values that range from 0.03 μm2/ms (Overstreet et al., 2000) to 0.8 μm2/ms (Destexhe and Sejnowski, 1995). We did not attempt to precisely determine DGABA, but we used the following approach to estimate this parameter. Strategies used to determine Dglutamate have relied on manipulating the diffusivity of glutamate at synapses by altering the viscosity of the bathing medium with the addition of 5% dextran (Min et al., 1998; Nielsen et al., 2004). This manipulation decreases Dglutamate by ∼40% and enhances transmission by prolonging the glutamate transient near release sites. To determine whether reducing DGABA would have similar effects on GABAB IPSCs, we performed experiments in which artificial CSF (ACSF) containing 5% dextran was applied via local perfusion to the VB nucleus. We modified our local perfusion system to ensure that the flow rate of ACSF with dextran was equivalent to that without. Maintenance of stable recordings was challenging during these experiments, particularly during reintroduction of the control solution for the washout. Nonetheless, dextran increased the amplitude of the evoked IPSC by 21 ± 4% in five of five cells, and the effects were successfully reversed during wash out in three (Fig. 3A). Although we attribute this effect primarily to changes in DGABA, we cannot be certain that dextran also altered tissue tortuosity and volume fraction, possibilities we did not test.

Slowing GABA diffusion increases GABAB IPSC amplitude. A1, Control IPSCs were evoked in TC neurons every 10 s for ∼5 min, followed by application of ACSF containing 5% dextran (∼10 min). Plotted here are responses for three cells that were maintained through the washout period. A2, Example GABAB IPSCs from one experiment. A3, Quantification of data corresponding to complete recordings (full lines) and recordings that became unstable during the washout period (dotted lines) (*p < 0.05, paired t test) (left). Dextran increased IPSC amplitude by 21 ± 9% (right). B, A three-dimensional model was built to understand how GABA, GAT, and GABAB receptor binding dynamics contribute to experimental GABAB-mediated IPSCs (for model details, see Fig. 4 and supplemental Fig. S3, available at www.jneurosci.org as supplemental material). Here, the coefficient of diffusion for GABA (DGABA) was varied in our model and the peak amplitude of simulated responses was measured. B1, Responses from a pair of simulations run with slow (left), moderate (middle), and fast (right) DGABA values (in square micrometers per millisecond). B2, Plotted are peak amplitudes for simulated GABAB responses over a range of DGABA values. When DGABA was >0.1 μm2/ms, slowing diffusion enhanced responses, whereas the opposite is true for values <0.1 μm2/ms. Each data point corresponds to the mean and SD of four simulations. Values for Dglutamate and Dacetycholine are shown for reference. B3, Example traces of control (DGABA, 0.4 μm2/ms) and 40% slower (DGABA, 0.24 μm2/ms) responses. B4, Slowing DGABA by 40% from an initial value of 0.4 μm2/ms increased simulated responses by 29 ± 4%. The plot is subdivided to show raw values (left) and relative values compared with control (right). **p < 0.01 (unpaired t test). Error bars indicate SEM. C, Spatiotemporal dynamics of GABA concentration ([GABA]) and GABAB receptor binding during simulations with different DGABA values. [GABA] (C1–C3) and bound receptors (C4–C6) were radially binned according to distance from release sites at different time points (C1, C4, 10 ms after release; C2, C5, time of peak simulated GABAB response; C3, C6, 100 ms after peak). Supplemental Movie S1 (available at www.jneurosci.org as supplemental material) shows continuous record. The line colors correspond to the colored data points in B2. The arrows point to sites of GABA release (i.e., synapses). Bound receptors appearing within synapses are an artifact of binning and reflect perisynaptic receptor binding—synapses were not populated with GABAB receptors. The blue scale corresponds to the blue line (i.e., slowest DGABA), whereas the black scale corresponds to both green and red lines. For detailed analysis methods, see supplemental Figure S4 (available at www.jneurosci.org as supplemental material).
Next, we systematically varied DGABA in our model and assessed resulting theoretical GABAB responses by measuring the number of bound GABAB receptors versus time (for details, see below and Fig. 4). Using models with equivalent GAT1 and GAT3 peak densities of 300/μm2 (see below), these simulations showed that within a fairly broad range (0.1–1.0 μm2/ms) any slowing of DGABA increased the amplitude of theoretical currents (Fig. 3B). However, when DGABA was <0.1 μm2/ms, reductions in this parameter suppressed responses (Fig. 3B2). As our experimental results showed that dextran increased the amplitude of GABAB IPSCs, and because GABA and glutamate have similar physicochemical properties, we decided to use a baseline DGABA value of 0.4 μm2/ms. Reducing DGABA by 40%, as is likely to occur in dextran, increased the amplitude of theoretical GABAB currents by 29 ± 4% (Fig. 3B4), a value similar to our experimental results.

Modeling GABA diffusion, uptake, and GABAB receptor binding at the RT–TC synapse. A1, Simplified three-dimensional model (left) based on anatomical characterization of inhibitory thalamic synapses between RT and TC neurons. A central cross-sectional view is also shown (right). One millimolar GABA was released directly underneath each release site (top, black) and diffused into/away from the synapse with a coefficient of diffusion of 0.4 μm2/ms. Cellular membrane (white) enveloped release sites and contained GAT1 (blue), GAT3 (red), and GABAB receptors (green). The synaptic region did not contain receptors. A2, Left, The model was populated with GABAB receptors at densities described by Kulik et al. (2002). Right, GAT density profiles. GAT density was highest (i.e., peak) in the region adjacent to synapses and then decayed according to the λw calculated in Figure 2. Shown is the GAT1/3 density profile when both peak GAT1 and GAT3 are 300 molecules/μm2. See supplemental Figure S3 (available at www.jneurosci.org as supplemental material) for details regarding the methods used to populate the model with receptors/transporters. B, GABAB receptor binding during simulated control (black), GAT1 blockade (blue), and GAT3 blockade (red) conditions. B1, The number of GABAB receptors bound versus time for models containing different GAT1:GAT3 peak values (columns) and in various GIRK channel cooperativity schemes (rows). R1, R2, and R3 refer to no, 2, and 3 cooperativity schemes. B2, GAT1 peak density was maintained at 300 molecules/μm2. From an initial control value of 0 molecules/μm2, peak GAT3 density was gradually increased to 900 molecules/μm2 in +100 molecules/μm2 increments. Plotted are relative changes (i.e., percentage of control) in peak amplitude (left) and decay (right) observed during simulated GAT1 (blue) and GAT3 (red) blockade in various cooperativity schemes. Each data point represents the mean (±SD) values derived from four simulations. For comparison, the relative changes observed during experimental GAT1 and GAT3 blockade (Fig. 1) are also shown in each plot (horizontal lines). A peak GAT1/GAT3 density of 300:300 with a R3 cooperativity scheme (arrows) best described our experimental results [i.e., simulated amplitude/decay points intersect with experimental data (lines)].
To understand why modulating DGABA affected the amplitude of simulated GABAB responses, we examined in more detail the spatiotemporal properties of GABA diffusion and receptor binding during simulated DGABA manipulations (Fig. 3C). This analysis revealed that slowing DGABA from initial values >0.1 μm2/ms prolonged the GABA transient near release sites, effectively retaining GABA in regions containing high levels of GABAB receptors [Fig. 3C1–C3, compare red (slow) and green (fast) lines]. Correspondingly, elevated [GABA] in this region promoted greater receptor binding (Fig. 3C4–C6, red vs green), thereby increasing the amplitude of the overall GABAB response. This enhancement, however, did not occur when DGABA was very slow (i.e., <0.1 μm2/ms). Very slow DGABA values led to retention of GABA within the synaptic cleft (Fig. 3C1–C3, blue line). As postsynaptic GABAB receptors are only expressed extrasynaptically, the retention of GABA in the cleft results in less GABAB receptor binding. As GABA spillover from the synapse is slow in these simulations, receptor binding is confined to only those regions adjacent to the synapse (Fig. 3C4–C6, blue), thereby reducing the total region that contributes to GABAB responses. This is exemplified by measuring the width of the region containing 80% of all bound receptors (i.e., “80% width”). For example, relative to faster DGABA values, the 80% width corresponding to simulations run with the slowest DGABA value was restricted to just the central region of the model (i.e., within 0.3–0.5 μm of the model center) (Fig. 3C4–C6, blue horizontal line). Moreover, slower spillover is also likely to promote GABA uptake because GAT1 and GAT3 can keep pace with GABA diffusing away from the synapse. Collectively, these effects result in smaller responses.
We now address how GAT-mediated GABA uptake was incorporated into the model. Implementing the appropriate GAT1/3 densities was more challenging because absolute density estimates in the thalamus have primarily focused on GAT1 (Chiu et al., 2002). Nonetheless, consistent with previous reports (De Biasi et al., 1998; Vitellaro-Zuccarello et al., 2003), we observed stronger GAT3 versus GAT1 staining in VB. This, however, is a relative comparison and our model required absolute GAT density values (and, most importantly, transport activity in terms of moles/second). In regions with intense GAT1 expression (e.g., hippocampus, cortex), the surface density of the transporter can range between 800 and 1300 per square micrometer (Chiu et al., 2002). Although this density corresponds to expression in neurons associated with high levels of GAT1, we used this value as a reference point for defining GAT1 densities in our thalamic model. Because GAT1 expression is relatively low in the thalamus (De Biasi et al., 1998; Vitellaro-Zuccarello et al., 2003), we incorporated a peak perisynaptic density of 300 GAT1/μm2 that decayed with distance from the closest synapse according to the λw derived from our anatomical data (supplemental Fig. S3, available at www.jneurosci.org as supplemental material).
We ran control, GAT1, and GAT3 blockade simulations for a range of GAT densities. To determine the peak GAT1/GAT3 ratio that best fit our data, we ran simulations in which the peak GAT1 density was fixed at 300 molecules/μm2, whereas GAT3 density varied from 0 molecules/μm2 to a peak density of 900 molecules/μm2 (i.e., three times peak GAT1 density) (Fig. 4B). With equal densities (300/μm2) for both GATs, the effects of simulated GAT1 versus GAT3 blockade were comparable with the observed differential effects that these blockers had on experimental GABAB-mediated IPSCs (see below). If, however, peak GAT3 density was substantially higher than peak GAT1 density, then the effects of GAT1 blockade were minimal because high levels of GAT3 were sufficient to effectively remove GABA from the extracellular space.
As the details regarding the activation of G-protein gated inwardly rectifying potassium (GIRK) channels that mediate the GABAB IPSC are unclear, we did not explicitly translate bound GABAB receptors into TC neuron current. It is noteworthy, however, that GABAB receptors appear to bind one molecule of GABA (Galvez et al., 2000; Bettler et al., 2004) and, when bound, are hypothesized to be constitutively active (Kniazeff et al., 2004). Also, cooperativity exists at the level of GIRK channel activation. Sodickson and Bean (1996) reported that GABAB currents in dissociated hippocampal neurons exhibit Hill coefficients near 2, but that cooperativity was partially concentration dependent. More recently, using various chimeric GIRK channels expressed in oocytes, Sadja et al. (2002) showed that the binding of three GIRK subunits is required to fully open each channel, suggesting a cooperativity of 3. This latter value is consistent with assessments derived using computational methods (Destexhe and Sejnowski, 1995). We incorporated different degrees of cooperativity by raising the number of bound receptors to the nth power, where n corresponds to the number of bound GIRK sites required for channel opening.
Our experimental data were best represented by a model consisting of equivalent peak GAT1 and GAT3 densities and an assumed GIRK channel cooperativity of 3. Under this scenario, GAT1 blockade increased the amplitude of theoretical GABAB responses by 42 ± 5%, whereas blocking GAT3 caused a 134 ± 7% increase (Fig. 4B2, arrows). GAT1 blockade had little effect on decay time of this theoretical current (3 ± 3% change), whereas the GAT3 blockade induced an increase of 31 ± 3% (Fig. 4B2). These effects were maintained across a relatively broad range of GAT densities as long as the peak GAT1/GAT3 ratio was maintained at the same level (data not shown). It is noteworthy that, despite equivalent peak densities, the longer GAT3 length constant results in higher total numbers of GAT3 transporters in the model and is therefore consistent with protein levels, as estimated from Western blot (De Biasi et al., 1998). Finally, although the binding/kinetic properties of GAT3 are not as well established as they are for GAT1, the available data indicate that GAT1 and GAT3 have similar binding affinities (Clark and Amara, 1994; Borden, 1996). Nonetheless, we assessed the possibility of whether amplitude and kinetic changes comparable with those observed experimentally could be obtained with models defined by different GAT1 versus GAT3 transport rates or GABA affinities rather than differential GAT1/3 localization. Despite implementing a range of different GAT1/3 transport rates and GABA affinities, we were unable to recapitulate the differential effects of GAT1 and GAT3 blockade on response decay (data not shown).
We also tested whether our model continued to yield differences between GAT1 and GAT3 blockade during repetitive, burst-like release events, reflecting the mode of firing of RT cells. To examine this possibility, simulations were run during which a train of five release events at 300 Hz were delivered to approximate the 300 Hz burst of action potentials RT neurons generate with electrical stimulation (Sohal and Huguenard, 2003). Under these conditions, the magnitude of the differential effects of GAT1 versus GAT3 blockade were maintained (Fig. 5A). Additionally, during repetitive release GAT3 blockade increased the time-to-peak of responses by 14 ± 2% (Fig. 5A), an effect also observed experimentally (Table 2).

Simulated GABAB responses during repetitive release. In all portions of this figure, black lines/points correspond to control conditions, whereas blue and red lines/points correspond to GAT1- and GAT3-block conditions, respectively. A1, Five release events were delivered at 300 Hz to mimic RT neuron activity during action potential bursts. The 300:300 peak GAT1/GAT3 densities were incorporated into the model and DGABA was set to 0.4 μm2/ms. Shown are simulated GABAB responses during control and GAT1 and GAT3 blockade. The insets show normalized responses. Scale bar, 200 ms. A2, Relative changes in amplitude, decay, and time-to-peak during GAT1 and GAT3 blockade. Although the simulated responses were larger than those generated by single release events, the relative differences in amplitude, decay, and rise time observed during GAT1 and GAT3 blockade were maintained. B, Three-dimensional map of X–Y plane projecting through model center. Shown is [GABA] on a log10 scale during control, GAT1-, and GAT3-blocked simulations at the time of the peak GABAB response. C, Spatiotemporal dynamics of [GABA] and GABAB receptor binding during control and GAT1 and GAT3 blockade conditions. Similar to plots in Figure 3C, [GABA] and bound GABAB receptors were radially binned according to distance from release sites. In a practical sense, the [GABA] plots in C are binned, and numerical representations of the planes transecting the plots are shown in B (e.g., control). [GABA] (C1–C3) and bound receptors (C4–C6) are shown for three time points: 10 ms after release (C1, C4), time of peak GABAB response (C2, C5), and 200 ms after peak GABAB response (C3, C6). Supplemental Movie S2 (available at www.jneurosci.org as supplemental material) shows continuous record. The raw values (left) and relative changes (right) are shown in each plot. Largest relative differences were observed in distal model regions. The horizontal lines above raw bound receptor lines show spatial boundary circumscribed by 80% of bound receptors (i.e., 80% width). The inset bar graphs in raw bound receptor plots show percentage of total bound receptors that are located >3 μm from synapses. D, Cumulative plots were generated to show how response properties change as model volume (i.e., spatial bins) increases. D1, Example control, GAT1-, and GAT3-blocked responses generated by only summing bound receptors within 2 μm (left) and 10 μm (right) of model center. D2, Relative response amplitude (y-axis) as a function of cumulated 0.5 μm bins [x-axis (i.e., “X” in D1)]. Relative amplitude changes observed during simulated GAT1 and GAT3 blockade depended steeply on model regions within ∼2.5 μm of the model center. D3, Relative response decay as a function of cumulated 0.5 μm bins. Simulated GAT3 blockade required incorporation of distal model regions to achieve the ∼30% prolongation in response decay. Error bars indicate SEM.
GAT3 gates GABA diffusion into extrasynaptic regions of model
After validating the model for burst release conditions, we revisited the original goal of better understanding GAT-mediated modulation of GABAB IPSCs. To this end, we mapped the spatiotemporal extent of GABA spillover and GABAB receptor activation during simulated GAT1 and GAT3 block. This analysis showed that both [GABA] and the number of bound GABAB receptors are highest in regions closest to release sites (Fig. 5C). This general feature was observed during all three simulation conditions: control, GAT1, and GAT3 blockade. However, when [GABA] and the number of bound receptors during GAT1/3 block were normalized to control levels (Fig. 5C1–C6, right columns noted as “% Above Control”) we found that the largest differences in both [GABA] and bound receptors occurred in the periphery, and that the relative change was greatest during GAT3 blockade. These features were present throughout the time course of simulations but were particularly evident during the decay phase (Fig. 5C3,C6; supplemental Movie S2, available at www.jneurosci.org as supplemental material). Correspondingly, 200 ms after the peak the contribution of extrasynaptic receptors (arbitrarily defined as receptors >3 μm from synapses) was largest during GAT3 blockade based on two metrics: (1) 80% width of bound receptors (Fig. 5C6, red horizontal line; a threefold difference: 16 vs 5 μm in control), and (2) the relative contribution of extrasynaptic receptors to the entire response (Fig. 5C6, inset bar graph, 37 vs 19% in control). Together, these results indicate that GAT3 blockade facilitates GABA diffusion into extrasynaptic regions and promotes binding of a large pool of GABAB receptors that serve to prolong the decay of GABAB responses.
Our modeling results suggested that elevated GAT3 expression in the periphery is primarily responsible for gating GABA into distal extrasynaptic regions. The following approach was used to address whether such gating is relevant for shaping the decay of simulated GABAB responses. First, we calculated control model responses that were based only on the sum of all bound receptors within 2 μm of release sites—bound receptors outside of this region were not included in the analysis (Fig. 5D1, left). We then normalized the amplitude and decay times of the GAT1- and GAT3-blocked responses generated in this region to the control responses. By restricting the quantification of bound receptors to just those receptors within 2 μm of release sites, we observed that GAT1 blockade increased the amplitude of responses by 32 ± 1%, whereas GAT3 blockade increased amplitude by 94 ± 3%. The decay times of these restricted responses, however, were not modulated by GAT1 or GAT3 blockade. Next, we generated responses that were based on the sum of all bound receptors only within 10 μm of release sites (Fig. 5D1, right). Under these conditions, GAT1 blockade increased response amplitude by 38 ± 3% and GAT3 blockade increased amplitude by 132 ± 6%. Furthermore, GAT3 blockade increased the decay rate of responses by 16 ± 2%. We performed comparable analyses for all cumulative bin sizes (i.e., 0–25 μm) (Fig. 5D2,D3). This analysis revealed a steep dependence of response amplitude on model regions near the release sites. This dependence gradually diminished after ∼2.5 μm. In contrast, we observed a much more gradual dependence of response decay on the extent of model included in analysis, in that the observed 30–40% prolongation of response decay was only achieved when receptors within a much larger area (15 μm radius from release sites) were included (Fig. 5D3). This result indicates that the large differences in peripheral [GABA] and bound receptors (Fig. 5C) are critical for the slower decay of responses observed during simulated GAT3 blockade. In other words, modulation of distal GATs strongly modulates IPSC duration. Consistent with this, the decay rates observed during GAT1 versus GAT3 blockade were equivalent during simulations in which extrasynaptic steady-state GAT1 was increased to be the same as the level of GAT3 (supplemental Fig. S5, available at www.jneurosci.org as supplemental material).
Partial GAT3 blockade prolongs IPSCs
It remained possible that the differential effects of GAT1 versus GAT3 blockade on experimental IPSCs resulted primarily from different overall GAT1/3 expression levels and not necessarily on specific differences in perisynaptic versus extrasynaptic regions. If GAT1 and GAT3 expression is uniform (i.e., expression does not vary with distance from the synapse), and if GAT3 is more abundant than GAT1, then such a difference might explain the differential effects of GAT1 versus GAT3 blockade. Such a model, however, also predicts that a low level of GAT3 blockade will not affect IPSC kinetics, in much the same manner that full GAT1 blockade did not affect kinetics. We addressed this possibility by determining the concentration of SNAP-5114 that produces response amplitude changes comparable with those achieved by full GAT1 blockade. After assessing several concentrations, we decided on a final value of 10 μm SNAP-5114, which increased IPSC amplitude in 10 of 10 cells by an average of 42 ± 6% (Fig. 6A–C). This relative change in amplitude was not different from that observed during full GAT1 blockade (p = 0.23, t test, 10 μm SNAP-5114 vs 4 μm NO-711). However, even at this lower concentration, SNAP-5114 retained its robust effect on IPSC kinetics, increasing the τdw of IPSCs in 9 of 10 cells (mean increase, all cells: 26 ± 10%, p < 0.005). IPSC half-width was also increased in 9 of 10 cells (mean increase, all cells: 15 ± 10%, p < 0.005). These results indicate that a simple difference in relative GAT1 versus GAT3 abundance cannot account for the differential effects of experimental GAT1 and GAT3 blockade.

Partial GAT3 blockade increases GABAB IPSC decay. A–C, Partial GAT3 blockade prolonged experimental GABAB IPSCs. A, Example of evoked GABAB IPSCs during control conditions and during 10 μm SNAP-5114. The inset shows normalized traces. B, Time series showing relative change in IPSC amplitude during application of 10 μm SNAP-5114 (n = 10). C, The 10 μm SNAP-5114 increased GABAB IPSC amplitude by 42 ± 6% (C1), a relative change similar to that observed during full GAT1 blockade (p = 0.23, t test) (Fig. 1). Unlike GAT1 blockade, however, 10 μm SNAP-5114 also increased IPSC decay (τdw) by 26 ± 10% (C2) (control, 175 ± 25 ms; SNAP, 211 ± 27 ms; wash, 194 ± 31 ms; p < 0.005; n = 10). D, Simulated GABAB responses are prolonged during partial (50%) GAT3 blockade. The mean amplitude of responses generated during partial GAT3 blockade (red) was 46% greater than control (n = 4; p < 0.0001, t test). This level of GAT3 blockade also prolonged responses by 17% (n = 4; p < 0.0001, paired t test). Error bars indicate SEM.
Finally, to further validate our MCell model, we determined whether partial GAT3 blockade also prolongs the decay of simulated GABAB responses. We found that blocking GAT3 in our model by 50% increased the amplitude of simulated GABAB responses by 46 ± 2% (Fig. 6D), an effect similar to that achieved by full GAT1 blockade. Moreover, GAT3 blockade increased the decay of model responses by 17 ± 2% (Fig. 6D), a value similar to experimental results but unlike the very modest (3%) increase observed during simulated complete GAT1 blockade (Fig. 5A). Collectively, these data argue that IPSC amplitude and decay can be independently modulated and that differential GAT1/3 expression can enable such modulation.
GABA concentration is highest during GAT3 blockade
Our simulation results predicted that peak [GABA] achieved during GAT3 blockade is higher than during GAT1 blockade. Low-affinity receptor antagonists are often used to ascertain relative concentrations of neurotransmitter at/near synapses (Wadiche and Jahr, 2001). The critical property enabling such antagonists to probe transmitter concentrations is the antagonist unbinding rate (i.e., off-rate) relative to the duration of the transmitter transient. If the off-rate of an antagonist is relatively fast, then the opportunity exists for available transmitter to compete for receptor binding sites as the antagonist unbinds. Manipulations that increase the magnitude of the neurotransmitter transient result in a higher degree of transmitter binding by outcompeting the low-affinity antagonist. This results in a lower degree of blockade (Clements et al., 1992).
Accordingly, we hypothesized that 3- aminopropyl(diethoxymethyl)phosphinic acid (CGP-35348), a low-affinity GABAB receptor antagonist (IC50, ∼30 μm; Ki, ∼5 μm) (Olpe et al., 1990; Lingenhoehl et al., 1999), would more effectively reduce IPSC amplitude during GAT1 blockade than during GAT3 blockade. It is important to emphasize, however, that the off-rate of CGP-35348 is not known—indeed, this property is unknown for all available GABAB receptor antagonists. Therefore, our hypothesis relies on the assumption that the off-rate of CGP-35348 is sufficiently fast to enable transmitter competition. If, however, the off-rate is too slow to allow antagonist unbinding and agonist competition within the time course of the neurotransmitter transient, then we would expect that the effect of CGP-35348 to not depend on the amplitude of the transient. To distinguish these possibilities, we tested the ability of CGP-35348 to reduce the amplitude of evoked GABAB IPSCs during intact GAT function (i.e., control condition), and during GAT1 or GAT3 blockade. At a concentration of 20 μm, CGP-35348 reduced the amplitude of control IPSCs by 47 ± 3% (Fig. 7A, Table 4), and to a similar extent during GAT1 blockade (44 ± 5%). However, during GAT3 blockade, IPSC amplitude was only reduced by 26 ± 4% (Fig. 7, Table 4) (GAT3 vs GAT1, control; p < 0.005, Bonferroni ANOVA). In contrast, the high-affinity agonist [S-(R*,R*)]-[3-[[1-(3,4-dichlorophenyl)ethyl]amino]-2-hydroxypropyl](cyclohexylmethyl)phosphinic acid (CGP-54626), with presumed slower off-rate, was equally effective at reducing IPSCs under all three conditions (20 nm, ∼40–51% reduction in each case) (Fig. 7E–H, Table 5). We interpret this result as evidence that CGP-35348 has a sufficiently fast off-rate to be useful in determination of relative GABA concentrations obtained under different GABA uptake conditions, and that GABA concentrations after synaptic release are higher during GAT3 blockade than during GAT1 blockade.

GABA concentrations are highest during GAT3 blockade. A–D, The actions of the low-affinity GABAB receptor blocker 20 μm CGP-35348 were assessed on control IPSCs (A), and IPSCs evoked during either GAT1 (•) or GAT3 blockade (○) (B). C, Examples of the actions of CGP-35348 on control GABAB IPSCs (left), and GABAB IPSCs in the presence of GAT1 (middle) and GAT3 (right) blockers. D, Raw (left) and normalized (right) amplitudes during CGP-35348 application. The relative change in amplitude induced by CGP-35348 was smallest during SNAP-5114 application. E–H, The high-affinity GABAB receptor antagonist CGP-54626 equally reduced GABAB IPSCs evoked during control and GAT1 and GAT3 blockade. E, The actions of the high-affinity GABAB receptor blocker 20 nm CGP-54626 were assessed on control IPSCs (E) (n = 6), and IPSCs evoked during either GAT1 (•; n = 7) or GAT3 blockade (○; n = 7) (F). G, Examples of the actions of CGP-54626 on control GABAB IPSCs (left), and GABAB IPSCs in the presence of GAT1 (middle) and GAT3 (right) blockers. H, Raw (left) and normalized (right) amplitudes during CGP-54626 application. The relative change in amplitude during CGP-54626 was similar during all three conditions. Error bars indicate SEM.
Quantification of experimental results: low-affinity GABAB antagonist (CGP-35348)
Quantification of experimental results: high-affinity GABAB antagonist (CGP-54626)
Discussion
Factors that define the properties of synaptic GPCR-mediated currents remain mostly unknown. Here, based on our experimental results, we developed a computational model of GABA diffusion showing that differential GAT1 versus GAT3 localization sculpts GABA spillover to enable distinct regulation of amplitude and decay of GABAB IPSCs. Moreover, as thalamic GAT expression is primarily—if not exclusively—confined to astrocytes (De Biasi et al., 1998; Vitellaro-Zuccarello et al., 2003), we show that the GABA-activated currents generated by these GPCRs are, at least in the thalamus, intimately tied to glial cells.
GABAB IPSCs are dominated by diffusion
Our model thalamic synapse enables us to begin understanding how GAT1 and GAT3 differentially regulate GABA spillover to yield GABAB-mediated IPSCs with distinct properties. Our modeling results support hypotheses proposed by Isaacson et al. (1993) and Scanziani (2000) suggesting that GAT levels, particularly in extrasynaptic regions, are critical in shaping GABAB IPSCs. Indeed, our modeling results indicate that localization confers functional properties to GAT subtypes that are important in defining the spatiotemporal properties of GABA transients. We propose that the high perisynaptic expression of GATs in the thalamus (i.e., both GAT1 and GAT3) define GABA transients near release sites and primarily contribute to GABAB IPSC amplitude. The relatively high expression of GAT3 far from release sites, in contrast, is well positioned to selectively modulate decay properties of IPSCs. On a related note, activation of presynaptic GABAB receptors is also dependent on diffusion and uptake (Isaacson et al., 1993). We did not explore this issue in our simulations, as the location of presynaptic receptors on RT terminals is not known. In any case, any effects of presynaptic receptor activation would likely lead to an underestimation of the role GAT3 plays in influencing GABAB IPSC duration (for additional discussion, see supplemental Fig. 3 legend, available at www.jneurosci.org as supplemental material).
Although our model did not incorporate the intracellular mechanisms that couple GABAB receptors to GIRK channels—events that are likely to further shape GABAB currents—our simulations suggest that the slow kinetics of GABAB IPSCs can be explained by the properties of GABA diffusion and the dynamics of receptor binding. Support for the hypothesis that GABAB IPSC kinetics are dominated by the spatiotemporal properties of GABA diffusion and not intracellular events comes from the recent finding that GABAB receptors and GIRK channels exist in close proximity (<100 Å), forming signaling complexes within lipid rafts that likely provide rapid receptor–effector signaling (Fowler et al., 2007). Moreover, GABAB IPSC kinetics are not altered when different concentrations (0 vs 200 μm) of exogenous GTP, which is required for GIRK channel activation, are added to the patch pipette (Otis et al., 1993), suggesting that GTP binding is not rate-limiting. We propose, therefore, that factors determining the extent of GABA diffusion—GABA uptake and GABA diffusivity—strongly influence the shape of GABAB IPSCs. This strong dependence on diffusion is likely the result of the high affinity GABAB receptors have for GABA [∼1 μm EC50 (Sodickson and Bean, 1996)]. Thus, although our simulations suggest that GABA concentrations in distal extrasynaptic regions are submicromolar, it is likely that these low concentrations influence IPSC kinetics. For example, theoretical estimates indicate that ∼5% of receptors are bound during a 50 nm GABA exposure (based on a 1 μm EC50), as occurs in distal extrasynaptic regions (>10 μm from release sites) during the decay phase of our simulated GABAB responses. Considering that the pool of extrasynaptic receptors appears to be vast, even a modest binding of 5% is likely to impact IPSC kinetics, as Figure 5D3 suggests.
Another factor that may further sculpt GABAB IPSC kinetics is receptor desensitization, a feature that was considered in a previous GABAB IPSC model developed by Destexhe and Sejnowski (1995). We did not include this state because several lines of evidence indicate that endogenous GABAB receptors do not undergo significant desensitization. Sodickson and Bean (1996) showed in acutely dissociated hippocampal neurons that GABAB receptor responses evoked by the GABAB receptor agonist baclofen undergo modest desensitization, but only during prolonged, high-concentration applications (>1 s, >100 μm). Interestingly, desensitization was significantly less during GABA applications (3–1000 μm). A recent study showed that GABAB receptors can form heteromers with potassium channel tetramerization domain-containing (KCTD) proteins, and that these can affect receptor desensitization in recombinant expression systems (Schwenk et al., 2010). Interestingly, the authors also show that KCTD proteins are highly expressed in the hippocampus, the brain structure in which Sodickson and Bean (1996) showed that only modest desensitization occurred. The KCTD12 subunit, which most strongly confers desensitization, does not appear to be highly expressed in the thalamus (Schwenk et al., 2010). In any case, where it has been studied, the time course of the process is very slow—even the relatively strong desensitization observed in response to a high concentration of GABA by Schwenk et al. (2010) is characterized by a seconds-long decay rate. As synaptic GABA transients decay to micromolar concentrations within milliseconds, and the entire GABAB IPSC is complete within 500 ms, we did not include receptor desensitization at our model thalamic synapse. Thus, we propose that greater GABAB receptor activation is most likely to result from larger and/or more prolonged GABA transients.
Finally, in the absence of desensitization, what mechanisms might underlie the amplitude reduction observed in some cases during combined NO-711 and SNAP-5114? We speculate that this effect involves the recruitment of presynaptic GABAB receptors resulting from the elevation of ambient, steady-state GABA concentrations that is likely to occur when all uptake is blocked. Alternatively, significant elevations in ambient GABA may also provide the conditions that unmask GABAB receptor desensitization, if such a process occurs in the thalamus.
Comparisons with GABAA receptor currents
Little consensus has emerged regarding how GATs modulate GABAA-mediated inhibition. GAT1 blockade prolongs GABAA IPSCs (Overstreet et al., 2002; Keros and Hablitz, 2005), consistent with longer GABA transients. However, reports also demonstrate that such blockade either decreases (Overstreet et al., 2000; Keros and Hablitz, 2005) or has no effect (Nusser and Mody, 2002) on IPSC amplitude. Similarly, GAT3 blockade either augments (Kinney, 2005) or has no effect on GABAA IPSCs (Keros and Hablitz, 2005). The discrepant GABAA results are a likely reflection of differing GAT1/3 expression levels and proximities to GABA release sites in different areas of the brain. Another complication in interpreting these results, as pointed out by Overstreet et al. (2000, 2002), is that synaptic GABAA receptors rapidly desensitize. Thus, elevated GABA concentrations may not necessarily equate with enhanced GABAA receptor-mediated currents.
Many neurons, including those in the thalamus, express a population of non-desensitizing, extrasynaptic GABAA receptors that are responsible for generating a tonic inhibitory current (Mody and Pearce, 2004). In the thalamus, this current plays an important role in determining tonic versus burst firing modes of TC neurons (Cope et al., 2005). Although expression of these receptors is diffuse, they have high-binding affinities for GABA, which is reflected in the observation that bath application of 1 μm GABA to thalamic slices enhances the tonic current (Cope et al., 2005). Moreover, recent work has demonstrated that GAT3 blockade strongly modulates the tonic current (Cope et al., 2009), a finding consistent with our hypothesis that GAT3 expression is critical in defining extrasynaptic GABA concentrations. Additionally, Keros and Hablitz (2005) suggested that the prolongation of GABAA IPSCs observed in the cortex during combined GAT1/GAT3 blockade involves the recruitment of extrasynaptic receptors. Our model, which indicates that low concentrations (<5 μm) of GABA can, under certain conditions, spread far beyond release sites supports their hypothesis.
GABA diffusion and seizures
Knowledge of how GATs modulate GABAB IPSCs in the thalamus is particularly important for our understanding of events that shape thalamic oscillations related to epilepsy. The network that underlies most generalized seizures has a strong thalamic component (McCormick and Contreras, 2001). At the core of the oscillatory thalamic network is the reciprocally connected population of RT and TC neurons. RT inhibition of TC neurons leads to the generation of postinhibitory rebound bursts of action potentials, and stronger RT inhibition leads to more robust TC neuron rebound activity (Kim et al., 1997). One type of epilepsy that is believed to have a significant GABAB-mediated inhibitory component is generalized absence epilepsy. The relatively low frequency of absence-related oscillations (∼3 Hz) are hypothesized to reflect the slow, metabotropic inhibition associated with GABAB receptors (Kim et al., 1997). Supporting this hypothesis is the observation that GABAB receptor agonists enhance (Liu et al., 1992), whereas antagonists suppress (Vergnes et al., 1997), seizure activity in animal models of absence epilepsy. Thus, recent reports indicating that GAT inhibitors, which are effective in some forms of epilepsy, actually exacerbate absence seizures (Vinton et al., 2005) is not surprising given our results. Augmenting GABAB-mediated inhibition at RT–TC synapses, as our results show, likely enhances TC neuron rebound activity and promotes oscillatory, epileptiform activity. By providing the first quantitative estimates of the GABA transient in the extrasynaptic space—the very region that is likely critical for establishing the conditions necessary for seizure generation in the thalamus—our model should provide insights into how GABAergic drugs can be tailored to combat some forms of epilepsy.
Footnotes
This work was supported by National Institutes of Health Grants N07280 and NS34774, a fellowship from the Epilepsy Foundation, and Pittsburgh Supercomputing Center Grant BIO080001P. We thank Isabel Parada and Fran Shen (Stanford University, Stanford, CA) for providing expert help and advice with our anatomical experiments. We also thank Dr. Charles Nicholson (New York University, New York, NY) for extensive technical advice regarding the construction of three-dimensional MCell models that incorporate appropriate tortuosity and volume fraction properties. We are indebted to Dr. Markus Dittrich (Pittsburgh Supercomputing Center, Pittsburgh, PA) for generously spending the time and energy to help us run our simulations. Finally, we also thank Dr. Stephen J. Smith (Stanford University) for helpful advice with anatomical analyses.
- Correspondence should be addressed to John R. Huguenard, Department of Neurology and Neurological Sciences, Stanford University School of Medicine, Stanford, CA 94305-5122. john.huguenard{at}stanford.edu


