

Abstract
In the mammalian inner ear, the gain control of auditory inputs is exerted by medial olivocochlear (MOC) neurons that innervate cochlear outer hair cells (OHCs). OHCs mechanically amplify the incoming sound waves by virtue of their electromotile properties while the MOC system reduces the gain of auditory inputs by inhibiting OHC function. How this process is orchestrated at the synaptic level remains unknown. In the present study, MOC firing was evoked by electrical stimulation in an isolated mouse cochlear preparation, while OHCs postsynaptic responses were monitored by whole-cell recordings. These recordings confirmed that electrically evoked IPSCs (eIPSCs) are mediated solely by α9α10 nAChRs functionally coupled to calcium-activated SK2 channels. Synaptic release occurred with low probability when MOC–OHC synapses were stimulated at 1 Hz. However, as the stimulation frequency was raised, the reliability of release increased due to presynaptic facilitation. In addition, the relatively slow decay of eIPSCs gave rise to temporal summation at stimulation frequencies >10 Hz. The combined effect of facilitation and summation resulted in a frequency-dependent increase in the average amplitude of inhibitory currents in OHCs. Thus, we have demonstrated that short-term plasticity is responsible for shaping MOC inhibition and, therefore, encodes the transfer function from efferent firing frequency to the gain of the cochlear amplifier.
Introduction
A common feature of all sensory systems is their ability to maximize the sensitivity to specific signals within a noisy background while preserving a wide dynamic range. A strategy to achieve this task is to adapt the gain of the system through feedback circuits depending on the nature and/or salience of the stimulus (Robinson and McAlpine, 2009; Singer et al., 2009). In mammals, sound waves are transmitted to the organ of Corti, the sensory epithelium of the inner ear, where two types of mechanoreceptor, inner hair cells (IHCs) and outer hair cells (OHCs), transform these vibrations into electrical signals. IHCs are the primary phonoreceptors that, upon depolarization by incoming sound, release glutamate and activate the auditory nerve fibers contacting them (Hudspeth, 1997; Fuchs et al., 2003). By virtue of their somatic electromotility, OHCs respond to variations in membrane voltage with changes in their length (Brownell et al., 1985). This causes an enhancement of sound-evoked motion within the cochlear partition that amplifies the input to the IHCs (Ashmore, 2008). The resulting sensitivity and sharp tuning of cochlear afferent fibers is reduced by efferent feedback from the CNS (Wiederhold and Kiang, 1970). OHCs are innervated by cholinergic efferent fibers whose somata are in the medial portion of the superior olivary complex, hence known as the medial olivocochlear (MOC) fibers (Liberman and Brown, 1986). These MOC fibers are the final targets of several feedback loops from both the periphery (Guinan, 1996) and from higher processing centers (Robertson, 2009). MOC neurons activated through these circuits regulate several aspects of auditory processing, including the dynamic range of hearing (Guinan, 1996), the detection of relevant auditory signals (Dolan and Nuttall, 1988; Winslow and Sachs, 1988; Kawase et al., 1993; Maison et al., 2001; Tan et al., 2008), selective attention (Oatman, 1976; Delano et al., 2007), and protection against acoustic trauma (Rajan, 2000; Taranda et al., 2009). Although the importance of the MOC system in hearing is well established, many of the cellular events involved in its function remain unknown. Electrical stimulation of the MOC fibers leads to a reduction of sound-evoked motion in the cochlea (Cooper and Guinan, 2006) and to a decrease in auditory nerve responses, indicating that MOC system reduces the gain of the cochlea through a direct inhibition of OHC function. Moreover, the strength of cochlear inhibition is proportional to the rate of MOC activity (Galambos, 1956; Wiederhold and Kiang, 1970; Gifford and Guinan, 1987). How this process is orchestrated at the synaptic level is for the most part unknown. The MOC–OHC synapse is a peculiar ionotropic inhibitory synapse. It is mediated by acetylcholine (ACh) acting on α9α10 nAChRs functionally coupled to calcium-activated potassium channels that hyperpolarize the hair cell (Oliver et al., 2000; Elgoyhen and Fuchs, 2010). However, synaptic inhibition of OHCs has not been directly quantified. This is the first report showing postsynaptic responses of OHCs upon electrical stimulation of the MOC fibers. We show that the strength of OHC inhibition changes with the frequency of MOC activation within their physiological firing range and conclude that short-term plasticity at the MOC–OHC synapse constitutes a mechanism by which OHCs encode MOC firing frequency to adjust the sensitivity of the auditory periphery.
Materials and Methods
Animal procedures and isolation of the organ of Corti.
Procedures for preparing and recording from the postnatal mouse organ of Corti were essentially identical with those previously described (Glowatzki and Fuchs, 2000; Katz et al., 2004; Zorrilla de San Martín et al., 2010). Briefly, apical turns of the organ of Corti were excised from BALB/c mice of either sex between postnatal day 11 (P11) and P13 (day of birth is P0). Mice were used at P11–P13 (around the onset of hearing in altricial rodents) because at this age OHCs are already innervated by the MOC fibers (Pujol et al., 1998; Simmons, 2002) and they can be maintained in vitro for 1–3 h in healthy conditions. At older ages, recordings become more unreliable due to cell damage soon after the cochlea is excised from the animal. Cochlear preparations were placed in the chamber for electrophysiological recordings, mounted on the stage of a Leica LFS microscope, and viewed with differential interference contrast using a 40× water-immersion objective and a camera with contrast enhancement (Hamamatsu C275410; Hamamatsu Photonics). All experimental protocols were performed in accordance with the American Veterinary Medical Association's AVMA Guidelines on Euthanasia (June 2007).
Electrophysiological recordings.
OHCs were identified by their characteristic shape and their three row arrangement in the organ of Corti. After breaking into the whole-cell configuration, cell capacitance, resting potential, and voltage-dependent currents were monitored in each cell. The cochlear preparation was continuously superfused with an extracellular saline solution of the following composition (in mm): 155 NaCl, 5.8 KCl, 1.3 CaCl2, 0.7 NaH2PO4, 5.6 d-glucose, and 10 HEPES buffer, pH 7.4. Working solutions containing the different drugs and toxins used were made up in this same saline and applied by a gravity-fed multichannel glass perfusion tube (150 μm tip diameter) positioned ∼300 μm from the recorded OHC. The recording pipette solution contained the following (in mm): 150 KCl, 3.5 MgCl2, 0.1 CaCl2, 5 EGTA, 5 HEPES buffer, 2.5 Na2ATP, pH 7.2. In some experiments, to preclude the activation of SK currents by Ca2+, EGTA in the pipette solution was replaced by 10 mm of the fast calcium chelator 1,2-bis(2-aminophenoxy)ethane-N,N,N′,N′-tetra-acetic acid (BAPTA).
Membrane currents in OHCs from the first row were recorded in the whole-cell patch-clamp mode using an Axopatch 200B amplifier (Molecular Devices), low-pass filtered at 2–10 kHz and digitized at 5–20 kHz with a Digidata 1322A board (Molecular Devices). Unless otherwise stated, recordings were made at room temperature (22–25°C). In the experiments conducted at higher temperatures (34 ± 1°C), both the recording chamber and the extracellular solutions were heated using RH-2 heater blocks and a SH-27B in-line solution heater, respectively, controlled by a TC344B temperature controller (Warner Instruments). Glass recording pipettes, 1.2 mm inner diameter, had resistances of 6–8 MΩ. Indicated holding potentials were not corrected for liquid junction potentials (−4 mV). To make the seal and then break into the whole-cell configuration, the recording pipette was always positioned at the midbasal portion of the OHC under study. In most of the experiments, OHCs were voltage clamped at a holding voltage of −40 mV or at −90 mV, when the SK component of the response was minimized by using BAPTA in the intracellular solution.
Electrical stimulation of the MOC efferent axons.
Neurotransmitter release was evoked by bipolar electrical stimulation of the medial olivocochlear efferent axons as previously described (Goutman et al., 2005; Zorrilla de San Martín et al., 2010). Briefly, the electrical stimulus was delivered via a 20- to 80-μm-diameter theta glass pipette placed at 20–60 μm modiolar to the base of the IHC that was aligned with the OHC under study. The position of the pipette was adjusted until postsynaptic currents in the OHC were consistently activated. An electrically isolated constant current source (model DS3; Digitimer) was triggered via the data acquisition computer to generate pulses up to 30 mA, 200–1000 μs duration.
Estimation of the quantum content of transmitter release.
To obtain the quantum content of transmitter release (m), protocols of 200 stimuli were applied at a frequency of 1 Hz. m was estimated using three different methods. By the “direct method,” m was calculated as the ratio between the mean amplitude of evoked IPSCs (eIPSCs) and the mean amplitude of spontaneous IPSCs (sIPSCs) (Del Castillo and Katz, 1954a). However, the frequency of spontaneous release was very low and several cells could not be included in this analysis. Under the assumption that evoked synaptic events followed a Poisson distribution, m was also calculated by the “method of failures” [m = ln(N/N0), where N is the total number of stimuli and N0 is the number of failures], or as the “coefficient of variation method” (m = 1/CV2, where CV is derived from the amplitude distribution of eIPSCs) (Del Castillo and Katz, 1954a).
Paired-pulse protocols.
Two consecutive shocks with interstimulus intervals (ISIs) ranging from 4 to 250 ms were applied 50–100 times. Event detection and amplitude measurements of eIPSCs after each shock were performed manually. The average response (S) after each shock was computed as the sum of all recorded amplitudes divided by the number of repetitions (sweeps). The mean amplitude of evoked events in each pulse (A) was obtained by averaging the amplitudes of all detected eIPSCs. The probability of release (P) was computed as the number of eIPSCs/number of repetitions. For shocks with ISIs of 4 and 10 ms, the maximal response to the first shock could not be discriminated; therefore, the values of the three parameters (S, P, and A) were obtained using a single-shock protocol before the paired-pulse stimulation. The facilitation index for S, P, and A was computed as the ratio of their values between the second and the first shock.
Train stimulation protocols.
Train stimulation protocols composed of 10 pulses at frequencies ranging from 10 to 80 Hz, were repeated 50–100 times at intervals of 2 s. For every pulse, the current amplitude (ΔI) was computed between the baseline and a point taken 10 ms later. The baseline point was set after the pulse and was adjusted manually depending on the width of the stimulation artifact. The criterion for an eIPSC was 10 pA above baseline (rms noise was 2.8 ± 0.2 pA; n = 5). The probability of release (P) to each pulse was computed as the number of eIPSCs/number of repetitions (sweeps). The average amplitude (A) was obtained by averaging the eIPSCs amplitude (ΔI values) in each pulse. The average response (S) was computed as described in the previous section. To determine the extent of facilitation or depression during a train, values for the parameters S, P, and A were normalized to their values at the first pulse. For the average train response, (I) was computed as the difference between baseline before the first pulse and the maximal current after each pulse. The mean accumulated response was obtained by normalizing (I) at the nth pulse to its value in the first pulse (In/I1).
To determine whether train stimulation protocols exerted long-term effects on synaptic responses, efferent fibers were stimulated with a series of 10 trains at intershock intervals of 1 Hz, with a 60 s rest period between each series. These series were repeated 10 times to obtain an average value for the responses corresponding to the nth train of every series. This control experiment was performed with trains of either 50 or 100 Hz. There were no significant changes in the profile of the responses as the train number increased within the series, showing that the response of each train was independent of its stimulation history. Moreover, the average amplitude of the first pulse in each train was constant, further confirming that there was no change in synaptic strength during the stimulation protocol.
Simulation of high-frequency responses.
High-frequency responses were simulated using a representative single-shock response with the baseline set to zero as a template. To simulate temporal summation, individual 1.5-s-long traces were generated. In each of these individual traces, one eIPSC with a fixed probability of occurrence of 0.25 was added. This is the probability of success observed at a stimulation frequency of 1 Hz (single-shock probability) (see Results, Quantum content of transmitter release at the MOC–OHC synapse) (see Fig. 7A, Summation). To simulate a response taking into account the effect of facilitation (see Fig. 7A, Summation and Facilitation), the same procedure was applied but in each pulse the added eIPSC had a probability of occurrence that was computed as the initial probability of release (0.25) multiplied by the change in this probability (P) extracted from Figure 5F data. The increase in current (In/I1) in the simulated traces was then calculated as described in the previous section.
Data analysis.
Spontaneous and evoked synaptic currents (both single-shock and paired-pulse) were identified by eye and analyzed using Mini Analysis 6.0.3 (Synaptosoft). Decay and rise time (τdecay and τrise) values were fitted with monoexponential functions. Train responses were analyzed using either Clampfit 10.2 (MDS Analytical Technologies) or custom-made routines built with MATLAB R2008b (MathWorks). MATLAB was also used to simulate train responses. Further analysis and graph editing was performed with Prism 5 (GraphPad Software). Unless otherwise stated, data are expressed as the mean ± SEM.
Drugs and toxins.
Stock solutions of strychnine-HCl, 3-tropanyl-indole-3-carboxylate hydrochloride (ICS-205930-HCl), apamin, iberiotoxin, and tetrodotoxin were prepared in distilled water, stored in aliquots at −20°C, and diluted in the extracellular solution just before use. All drugs were purchased from Sigma-Aldrich.
Results
Biophysical and pharmacological properties of synaptic responses in OHCs evoked by electrical stimulation of the MOC efferent fibers
Whole-cell voltage-clamp recordings were made in OHCs from P11–P13 acutely isolated apical turns of mouse organs of Corti. Bipolar electrical stimulation in the modiolar region (Fig. 1A) evoked IPSCs in OHCs voltage clamped at −40 mV (Fig. 1B). These evoked synaptic currents were completely and reversibly prevented by 1 μm tetrodotoxin (TTX), a voltage-gated sodium current blocker (Fig. 1C), thus confirming that eIPSCs were indeed produced by transmitter release evoked by action potentials in the MOC fibers. When OHCs were voltage clamped at holding potentials (Vhold) between −100 and −80 mV, IPSCs were inward, whereas at Vhold positive to −80 mV they included a fast inward and a slow outward component (Fig. 1D; F, top panel). Two components were also observed in voltage recordings. A fast depolarizing phase was followed by a slower hyperpolarization that became larger as the membrane was depolarized (Fig. 1E; F, bottom panel). The current–voltage (I–V) relationship of peak eIPSC amplitude was almost linear between −100 and −40 mV and had a reversal potential of −75 mV (Fig. 1G), a value that is close to the equilibrium potential for potassium under our recording conditions (EK = −82 mV). The biphasic nature of the IPSCs, and the reversal potential are consistent with those of ACh-evoked currents in chicken short hair cells (Fuchs and Murrow, 1992) and in mammalian IHCs (Glowatzki and Fuchs, 2000; Gómez-Casati et al., 2005) and OHCs (Housley and Ashmore, 1991; Dulon and Lenoir, 1996; Evans, 1996; Nenov et al., 1996a,b; Oliver et al., 2000).

Synaptic responses evoked by electrical stimulation of the MOC efferent fibers in mouse OHCs. A, Schematic representation of the experimental setup. OHCs from the first row were recorded with a patch pipette while electrical shocks were delivered to the MOC fibers through an extracellular bipolar theta glass pipette positioned ∼10–20 μm below the IHCs. Scale bar, 10 μm. B, Representative trace obtained in an OHC in response to two single electrical shocks (arrows). The figure shows one eIPSC and one sIPSC, respectively, and also a failure of response upon nerve stimulation. C, Preventing the generation of axonal action potentials with 1 μm TTX caused a reversible block of the postsynaptic responses evoked by four shocks at 250 Hz. D, Representative traces of single-shock-evoked IPSCs in OHCs held at membrane voltages ranging from −40 to −100 mV. E, IPSPs obtained in the same cell in the current-clamp configuration. The holding (Vh) and the membrane (Vm) voltages are indicated in D and E, respectively. Note that, at Vh negative to −80 mV, IPSCs are completely inward, while positive to −80 mV a slow outward current develops in addition to the fast inward component (D). These outward currents are mirrored by hyperpolarizing responses in the current-clamp configuration (E). In F, more detailed traces of the biphasic response are shown in the voltage-clamp configuration at a Vh of −70 mV (top panel) and in the current-clamp configuration (bottom panel) starting from a resting potential of approximately −73 mV. The arrows indicate the fast inward/depolarizing phase of the two components of the synaptic response. G, I–V curve obtained plotting peak IPSCs amplitudes versus Vh in the cell illustrated in D.
In mammalian cochlear hair cells, the fast depolarizing phase of the cholinergic response is mediated by the α9α10 nicotinic receptor (Elgoyhen et al., 2001; Sgard et al., 2002; Katz et al., 2004; Gómez-Casati et al., 2005; Goutman et al., 2005; Vetter et al., 2007). This nicotinic receptor is highly permeable to Ca2+ (Weisstaub et al., 2002; Gómez-Casati et al., 2005) and produces the opening of SK2 calcium-activated potassium channels to hyperpolarize the hair cell (Dulon and Lenoir, 1996; Nenov et al., 1996a; Glowatzki and Fuchs, 2000; Oliver et al., 2000; Marcotti et al., 2004; Gómez-Casati et al., 2005; Goutman et al., 2005). Evoked IPSCs in OHCs were completely blocked by the application of two specific α9α10 antagonists, strychnine (300 nm) and ICS-205930 (300 nm) (Rothlin et al., 1999, 2003; Elgoyhen et al., 2001) (Fig. 2A,B). In addition, the SK channel-specific antagonist, apamin (Köhler et al., 1996), nearly completely blocked the outward component of eIPSCs at −40 mV (Fig. 2C), while the inward isolated cholinergic current was still observed at −80 mV (Fig. 2D). These results confirm that the eIPSCs observed in OHCs resulted from the known above-mentioned postsynaptic mechanism. It has been suggested (Rüttiger et al., 2004) and recently proven (Wersinger et al., 2010) that another Ca2+-activated K channel, the BK channel, specifically contributes to the cholinergic response of OHCs in the midbasal, but not apical cochlear turns. In the present study, iberiotoxin, a BK channel-specific antagonist (Galvez et al., 1990), had no effect on either the amplitude or time course of IPSCs at −40 mV (Fig. 2E) in these apical turn OHCs, consistent with the specific role of BK channels only in basal OHCs.

Pharmacological characteristics of IPSCs in OHCs. IPSCs in OHCs were reversibly blocked by the α9α10 nAChR antagonists strychnine (300 nm) (A) and ICS-205930 (300 nm) (B). C, Application of the SK channel-specific antagonist, apamin (100 nm), blocked the outward component of the inhibitory response at a Vh of −40 mV. D, Responses in the presence of apamin are shown at Vh of −40, −60, and −80 mV. Note that, at −60 and −80 mV, the remaining cholinergic inward component can still be observed. E, Iberiotoxin (100 nm), a specific and irreversible BK channel antagonist, had no effect on eIPSCs at −40 mV. In all cases, responses were evoked by four shocks at 250 Hz. Traces are the average responses to 20 stimuli in each condition: control, after local application of the drug (perfusion times ranging from 10 to 150 s depending on the drug) and after washing the preparation for 200 s.
Quantum content of transmitter release at the MOC–OHC synapse
Voltage-clamp recordings were performed at −40 mV, close to the resting potential of the OHCs (−51.5 ± 10.2 mV; n = 34 OHCs). This allowed stable whole-cell recordings and a good signal-to-noise ratio (Fig. 1B) of the outward-going (SK-dependent) synaptic currents. In this condition, sIPSCs had a rise time (20–80%) of 12.6 ± 2.6 ms and a decay time (10–90%) of 51.2 ± 11.6 ms (n = 8 OHCs; Table 1). Evoked IPSCs had similar waveforms (Fig. 1B). The amplitudes of both spontaneous and evoked IPSCs ranged between 10 and 250 pA, with mean values of 46.1 ± 10.8 (sIPSCs) and 48.4 ± 23.1 pA (eIPSCs) (n = 8 OHCs; Table 1). To verify that sIPSCs were indeed spontaneous events, and not produced by spontaneous firing of the MOC efferent fibers, the amplitude distribution of sIPSCs was obtained in the absence or the presence of 1 μm TTX. No differences were found between these conditions (Fig. 3A,C), indicating that spontaneous events were due to the action potential-independent fusion of vesicles to the presynaptic plasma membrane.
The quantum content of transmitter release at the MOC–OHC synapse

Amplitude distributions of spontaneous and evoked IPSCs. Representative traces of spontaneous synaptic currents (sIPSCs) in the presence of 1 μm TTX (15 events) (A) and evoked synaptic currents (eIPSCs) elicited by single electrical shocks (15 events) (B). The amplitude histograms corresponding to the cell recorded in A and B are shown in C and D, respectively. Note that there are no differences in the amplitude distribution of sIPSCs in the presence (gray bars) or absence (striped bars) of TTX (C). E, F, eIPSCs (gray bars) and sIPSCs (striped bars) amplitude histograms are shown for two OHCs. In C–F, the black bars indicate noise floor.
Postsynaptic responses evoked with single shocks at a stimulation frequency of 1 Hz had a low success rate (Psuccess = 0.25 ± 0.06; n = 18 OHCs). Quantum content (m) of transmitter release, that is, the mean number of vesicles released by each presynaptic action potential (Del Castillo and Katz, 1954a), was obtained using three different approaches. With the direct method, m was calculated dividing the mean eIPSC amplitude upon 1 Hz stimulation by the mean sIPSC amplitude in every cell (Table 1). In addition, given the low probability of release observed at the MOC–OHC synapse, synaptic events should follow a Poisson distribution (Del Castillo and Katz, 1954a). Under this assumption, the quantum content of evoked release was obtained using the failures [m = ln(N/N0)] and the coefficient of variation methods (m = 1/CV2) (see Materials and Methods and Table 1). Estimations of m for eight OHCs yielded values that were consistent across the three methods (Table 1), ranging from 0.03 to 1.15. Notwithstanding, the possibility of occurrence of response failures during the protocol due to stimulus failures should be considered as they would lead to an underestimation of the quantum content of transmitter release. To test whether failures could be due to conduction failures, we evaluated the effect of increasing the concentration of extracellular Ca2+ on the percentage of observed failures. An increase in the concentration of divalent ions decreases axon excitability due to surface charge effects (Dodge and Rahamimoff, 1967). Therefore, if the observed failures were caused by conduction failures, their rate should increase upon raising the extracellular Ca2+ concentration. Conversely, if failures were indeed release failures, they should decrease upon raising the extracellular Ca2+ concentration. Postsynaptic responses evoked with single shocks at a stimulation frequency of 1 Hz were recorded in OHCs. Upon changing the extracellular Ca2+ concentration from 1.3 to 2 mm, the number of failures was significantly reduced by 32 ± 9% (n = 3 OHCs). This result together with the consistency in the m value obtained by the three different methods used to evaluate it, suggests that the incidence of stimulus failures is not significant.
In agreement with the low quantum content of transmitter release at this synapse, the amplitude distribution of spontaneous and evoked responses for these cells overlapped (Fig. 3E,F). If one accepts that spontaneous currents are due to the fusion of a single vesicle, these results indicate that most of the evoked events were composed of single quanta. Consistent with this view, larger events that might consist of two or three quanta were rare (Fig. 3A–E). This reinforces the idea that stimulation failures do not account for the low quantum content observed at this synapse.
However, it is worth noticing that the sIPSCs histograms were skewed (Fig. 3C,D). From the eight analyzed OHCs, five presented non-normal distributions (D'Agostino and Pearson normality test, p < 0.01) with skewness ranging from 0.6 to 1.4. The fact that sIPSCs (uniquantal) distributions resulted in seemingly multiquantal histograms (Jonas et al., 1993) precluded the analysis of evoked amplitude histograms to obtain an m value. Asymmetrical histograms for spontaneous synaptic currents have been described in several CNS synapses (Bekkers et al., 1990; Jonas et al., 1993; Bekkers, 1994) and are generally attributed to variability among different release sites (Auger and Marty, 2000). Despite the variability and asymmetry in sIPSCs distributions, we can conclude that MOC–OHC synapses have a low probability of release at 1 Hz.
Paired-pulse facilitation at the MOC–OHC synapse
Synapses with low quantum content tend to facilitate upon high-frequency stimulation (Debanne et al., 1996; Murthy et al., 1997; Zucker and Regehr, 2002) as observed for efferent synapses on turtle auditory hair cells (Art et al., 1984) and neonatal rat inner hair cells (Goutman et al., 2005). To characterize plasticity at the MOC–OHC synapse, the average response was measured for paired pulses with ISIs ranging from 4 to 250 ms (Fig. 4A–D). The facilitation index (FIS) was defined as the ratio S2/S1, where S1 and S2 are the average responses of the OHC to the first and the second pulse, respectively. FIS values >1 indicate facilitation, while FIS <1 indicate depression (Del Castillo and Katz, 1954b; Mallart and Martin, 1967; Katz and Miledi, 1968; Goutman et al., 2005). For eight OHCs, facilitation was observed at ISIs of 10 and 25 ms (FIS = 2.1 ± 1.1 at 10 ms and 1.6 ± 0.6 at 25 ms, respectively; n = 8 OHCs; p < 0.05, one-sample t test; Fig. 4E). No statistically significant plasticity was found for shorter or longer ISIs.

Postsynaptic responses in OHCs facilitate upon paired-pulse stimulation of the MOC fibers. A–D, Representative traces of average IPSCs evoked by a pair of pulses with ISIs ranging from 4 through 100 ms (50–100 repetitions). E, Facilitation indexes for the eIPSC average amplitude (S2/S1), the probability of occurrence of an event (P2/P1), and the average amplitude of successfully evoked IPSCs (A2/A1) as a function of the ISI. Facilitation indexes for each parameter were calculated as the value obtained in the second stimulus with respect to the first one. Note that the facilitation index calculated using either S or P overlap in almost all ISIs tested. *p < 0.05, one-sample t test.
In most synapses, the short-term enhancement of the postsynaptic response has been shown to be a presynaptic process that causes an increase in the number of quanta released in subsequent pulses (Zucker and Regehr, 2002). However, given that transmitter release was measured at −40 mV, where the response is dominated by the secondary activation of the SK2 channel following Ca2+ entry through the α9α10 nAChR (Gómez-Casati et al., 2005), a postsynaptic component cannot be overlooked. If the increase in the response was solely due to a postsynaptic effect, there should be an increase in the amplitude of successfully evoked IPSCs without variations in the probability of release. Conversely, if the increase in the postsynaptic response was due to an increase in the number of quanta released by each action potential, there should be a reduction in the number of failures of release upon nerve stimulation. To distinguish between these two possibilities, the facilitation index was calculated separately as the amplitude of the successfully evoked postsynaptic responses (FIA = A2/A1) and the probability of release (FIP = P2/P1). No significant effect was found on the FIA at all ISIs evaluated (n = 8 OHCs; p > 0.5, one-sample t test; Fig. 4E), whereas a significant increase was found for FIP at ISIs of 10 and 25 ms (FIP = 2.2 ± 0.9 and 1.6 ± 0.6 for ISIs of 10 and 25 ms, respectively; n = 8 OHCs; p < 0.05, one-sample t test; Fig. 4E). Facilitation indexes for the three parameters (average response, FIS, amplitude, FIA, and probability, FIP) were plotted in the same graph (Fig. 4E). These results indicate that facilitation of the averaged postsynaptic responses (Fig. 4E) can be accounted for entirely by an increase in the probability of release. Therefore, at the MOC–OHC synapse facilitation in response to high-frequency stimulation is of presynaptic origin.
Facilitation and summation contribute to OHC inhibition during repetitive stimulation of MOC efferents
MOC fibers fire regularly at frequencies ranging from 1 to 120 Hz in vivo (Robertson and Gummer, 1985; Liberman and Brown, 1986; Brown, 1989) and cochlear inhibition increases with the frequency of MOC fiber activation (Galambos, 1956; Wiederhold and Kiang, 1970; Gifford and Guinan, 1987). The postsynaptic effect of repetitive efferent activity was examined using trains of 10 shocks at frequencies ranging from 10 to 80 Hz (corresponding to ISIs of 100 to 12.5 ms). Representative responses of OHCs to these trains are illustrated in Figure 5. Synaptic events occurred sparsely at 10 Hz but increased in frequency as stimulation frequency increased. In addition, the amplitude of individual responses appeared to increase at high MOC activation frequencies (Fig. 5C–E). These two effects combined to increase the average postsynaptic currents as the frequency of stimulation increased (Fig. 5, black traces). In current-clamp recordings, a sustained and enhanced hyperpolarization of the OHCs was observed in response to high-frequency MOC stimulation (Fig. 6).

Facilitation of transmitter release contributes to the increase in the postsynaptic response during high-frequency stimulation. A–E, Representative traces of 10 individual responses to 10 shock trains (gray traces) applied at different frequencies. The black trace is the average response of 100 repetitions at each frequency. Note that, at high frequencies, responses at the end of the train become larger. F–J, Individual traces of responses to 10 shock trains showing summation of consecutive IPSCs. The probability of release (P), the eIPSCs average amplitude (A), and the average response (S) were computed for every pulse during 10 shock trains at frequencies ranging from 10 to 80 Hz. In K–M, the normalized mean values for these parameters at the different stimulation frequencies are plotted versus the pulse number (n = 3–11 OHCs). Note that, at high frequencies, there is an increase in P during the first shocks (K), while the amplitude of the eIPSCs remains stable (L).

IPSPs obtained in OHCs in response to 25 and 50 Hz stimulation trains. A, B, Representative traces of 10 individual responses, obtained in OHCs in the current-clamp configuration, to 10 shock trains (gray traces) applied at 25 (A) and 50 Hz (B). The black trace is the average response obtained upon 100 repetitions of the train.
Facilitation during repetitive stimulation was assessed by measuring the probability of release (P) and the average amplitude of the successfully evoked responses (A) (Fig. 5K,L; n = 3–11 OHCs) for each successive stimulus. The total averaged response (S) was computed as the sum of the evoked responses divided by the number of stimulation trains (Fig. 5M). Consistent with the paired-pulse experiments, an increase in the probability of release (P) was observed when trains of shocks were applied at frequencies ranging from 50 to 80 Hz (ISIs of 20 to 12.5 ms). No effect on this parameter was found for lower frequencies (10 or 25 Hz; ISIs of 100 and 40 ms, respectively). The increase in P was maximal during the first shocks (p < 0.001, one-way ANOVA for the third pulse) and this was accompanied by an increase in the average response (Fig. 5M). At the end of the train, there was no significant difference in P across stimulation frequencies (p > 0.05, one-way ANOVA for the 10th pulse) (Fig. 5K). There were no significant changes in the amplitude of evoked responses for the different frequencies throughout the train, although a trend toward decreased amplitude was apparent at the higher frequencies (Fig. 5L; p > 0.05, one-way ANOVA for the 3rd and 10th pulse).
Since IPSC duration is longer than the ISIs of high-frequency trains (Table 1, Fig. 5), summation of consecutive evoked currents probably contributes to the amplitude of the response during high-frequency stimulation (Chen et al., 2002). In fact, summation of IPSCs was observed in single-trial experiments (Fig. 5F–J). The relative contribution of summation was evaluated by simulating the postsynaptic responses at different stimulation frequencies. A representative IPSC evoked by a single shock was used for building simulated trains (Fig. 7, inset). Temporal summation was modeled considering a constant probability of release (P) of 0.25 for each pulse (Fig. 7A, light traces), while facilitation was incorporated by multiplying P by a factor that takes into account its change as calculated from the experiments illustrated in Figure 5K (Fig. 7A, dark traces). Representative traces of single-trial simulated responses for different frequencies are shown in Figure 7E–H. The accumulated response as a function of pulse number is plotted for frequencies ranging between 10 and 80 Hz for “Summation” (Fig. 7B) or “Summation and Facilitation” (Fig. 7C). The relative increase in OHC total currents for the different stimulation frequencies was calculated using the responses recorded in the OHCs illustrated in Figure 5 (Fig. 7D; n = 3–11 OHCs). Exponential fits provided maximum response increments (except for a linear fit to 10 Hz data) that grew as a function of stimulus frequency (4.2 ± 0.3, 7.5 ± 0.8, 12.4 ± 0.7, 21.6 ± 5.9 for 25, 50, 60, and 80 Hz, respectively; n = 3–11 OHCs; Fig. 7D). Summation and facilitation combined to produce a response function most closely resembling the experimental data (plateau levels: 3.1 ± 0.1, 5.2 ± 0.2, 6.7 ± 0.3, and 8.8 ± 0.5 for 25, 50, 60, and 80 Hz, respectively, for Summation, and 3.6 ± 0.2, 7.4 ± 0.3, 10.0 ± 0.4, and 15.4 ± 0.7 for 25, 50, 60, and 80 Hz, respectively, for Summation and Facilitation; Fig. 7B,C). These data show that both facilitation and summation contribute to OHC inhibition during repetitive activation of the MOC fibers.

Summation also contributes to the increment of the postsynaptic response during high-frequency stimulation. To estimate the effect of summation during high-frequency stimulation, simulated responses were constructed from a single-shock response (A, inset) considering only temporal summation (gray traces) or considering facilitation by also taking into account the change in the probability of release (black traces) for every shock (the change in P values was obtained from experiments illustrated in Fig. 5F). Plots of normalized current versus pulse number were constructed from the simulation considering only summation (B) or summation and facilitation (C). D, Plot of normalized current versus pulse number derived from the experimental data shown in Figure 5. E–H, Representative traces of the simulated single sweep responses are shown. In each panel, the simulated frequency is indicated.
As stated above, the fact that the increase in the postsynaptic response during repetitive stimulation correlates with an increase in the probability of release and not with an increase in the mean amplitude of IPSCs, strongly suggests that facilitation is due to a presynaptic mechanism. However, at the MOC–OHC synapse, IPSCs are mediated by the activation of the α9α10 nAChR and the subsequent activation of SK2 channels. These SK2 channels are activated both by Ca2+ entry through the nAChR (Oliver et al., 2000; Gómez-Casati et al., 2005) and possibly by Ca2+ released from nearby subsynaptic cisterns (Lioudyno et al., 2004). Therefore, in the following set of experiments, we minimized the activation of SK2 channels by buffering postsynaptic Ca2+ with BAPTA in the recording pipette (see Materials and Methods), to evaluate whether the strengthening of transmission observed upon high-frequency stimulation was independent from the accumulation of Ca2+ at the postsynaptic cell. To see a measurable response in the absence of the SK2 current, OHCs were held at −82 mV. Under these conditions, IPSCs mean amplitude was −43 ± 2 pA with a 20–80% rise time constant of 2.4 ± 0.4 ms and a 10–90% decay time constant of 29 ± 1 ms (60 events, 7 OHCs). To evaluate the degree of facilitation under this experimental condition, 25–100 repetitions of 10 shock stimulation trains at 50 Hz were applied (Fig. 8A). The probability of release (P), the average amplitude (A), and the average response (S) were computed for every pulse. As observed with the combined (nAChR plus SK) responses at −40 mV (Fig. 5), upon high-frequency stimulation of the MOC fibers, there was an increase in the isolated (nAChR) average postsynaptic responses at −82 mV (S) that correlated with an increase in the probability of release (P) (p < 0.05, one-sample t test for the third pulse), with no changes in their amplitude (A) (n = 7 OHCs; Fig. 8). These results show that facilitation of transmitter release at the MOC–OHC synapse can occur independently of frequency-dependent changes in SK current in the postsynaptic hair cell.

Facilitation of transmitter release is still observed in the absence of SK2 channel activation. Responses in OHCs recorded at a Vh of −82 mV with an intracellular solution containing 10 mm of the fast calcium chelator, BAPTA, to minimize the activation of SK2 channels. In A, representative traces of 10 individual responses to 10 shock trains (gray traces) applied at 50 Hz. The black trace is the average response of 50 repetitions. An average response to a single shock (1 Hz stimulation frequency) is shown in the inset. The probability of release (P), the eIPSCs average amplitude (A), and the average response (S) were computed for every pulse during the 10 shock trains. In B, the normalized mean values for these parameters are plotted versus the pulse number (n = 7 OHCs).
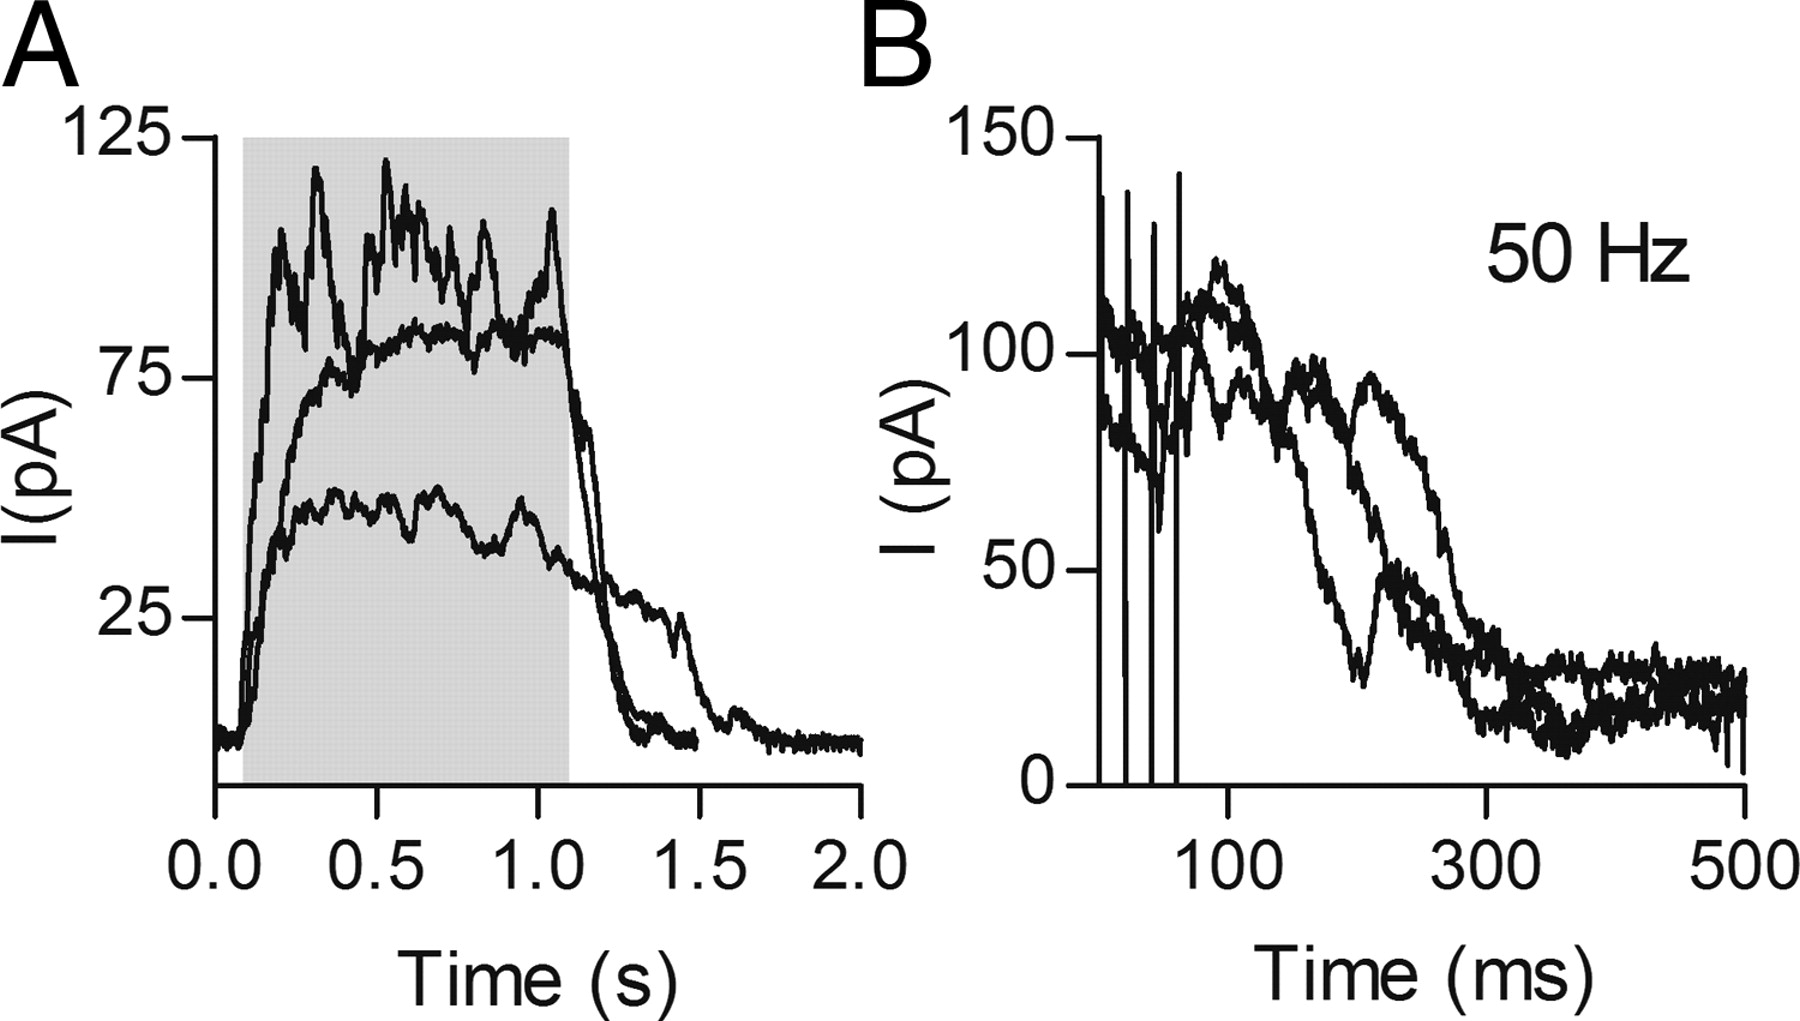
It has been reported that inhibition of auditory function by MOC activity lasts for as long as MOC fibers are stimulated and then decays within hundreds of milliseconds (Wiederhold and Kiang, 1970; Guinan, 1996). It was therefore of interest to ask whether the MOC–OHC synapse can sustain release during prolonged stimulation. To this end, MOC efferent fibers were stimulated at 50 Hz for 1 s with an intertrain interval of 30 s. The averaged current increased in all OHCs tested, reaching a plateau with a time constant of 101.9 ± 10.4 ms (n = 3). This plateau level did not decrease significantly during the stimulation period (Fig. 9A). In addition, frequent spontaneous activity appeared after the stimulation ended (Fig. 9B), extending the postsynaptic effect for 200–500 ms (Fig. 9A). These results indicate that the MOC–OHC synapse is able to sustain synaptic activity for long periods.

Sustained release at the MOC–OHC synapse during long trains of stimulation. A, Average currents obtained in three different OHCs in response to a 50 Hz train applied for 1 s (10–50 sweeps were averaged in each cell). The shaded region indicates the time interval of the stimulus. Stimulus artifacts were removed for clarity. Note that the average current remains almost constant during the stimulation period and that it does not return to baseline immediately after the end of the stimulus. The rise time constant of the current was 101.9 ± 10.4 ms (n = 3) and the decay time was variable, ranging from 200 to 500 ms. B, Individual traces of after-stimulus activity.
Effects of temperature on the properties of synaptic transmission at the MOC–OHC synapse
All the results presented in the previous sections were conducted at room temperature. Therefore, it is possible that at physiological temperatures some of the processes there described could be affected. To evaluate the effect of temperature on synaptic transmission at the MOC–OHC synapse, evoked IPSCs were measured near physiological temperature. The increase in temperature caused a twofold decrease in both the rise and decay constants of single-shock evoked IPSCs (τrise 20–80%: 5 ± 0.5 ms; τdecay 10–90%: 25 ± 5 ms; n = 4 OHCs; see Fig. 11A). There were no effects of temperature, however, in the mean amplitude of synaptic currents (56 ± 17 pA; n = 4 OHCs).
Another synaptic process that could be sensitive to temperature is facilitation (Eccles et al., 1941; Atluri and Regehr, 1996; Klyachko and Stevens, 2006). To analyze the effects of temperature on the facilitation index, 10 shock trains at frequencies of 25 and 50 Hz were applied to cochlear preparations maintained at 34°C (Fig. 10A,B). The total average response (S), the probability of release (P), and the mean response (A) were calculated for each pulse. As observed at room temperature, there was no increase in any of the parameters at a stimulation frequency of 25 Hz (Fig. 10C). However, when the frequency of stimulation was raised to 50 Hz, an increase in the probability of release (1.6 ± 0.4-fold at the third pulse with respect to the first pulse; n = 3 OHC) accompanied by an increase in the average response (1.7 ± 0.4-fold at the third pulse with respect to the first pulse; n = 3 OHC) was observed (Fig. 10D). The magnitude of this change was similar to that found at room temperature (Fig. 5). This result shows that facilitation of transmitter release at the MOC–OHC synapse is not sensitive to variations in temperature within the range tested. Moreover, we found no significant changes in the initial probability of release at 34°C (Psuccess = 0.26 ± 0.1; n = 3 OHCs) compared with that obtained at room temperature, and consequently, there were no differences in the mean quantum content (0.27 ± 0.08 and 0.33 ± 0.11 as computed by the CV and failure methods, respectively; n = 3 OHCs).

Effects of temperature on facilitation. A, B, Representative traces of 10 individual responses, obtained near physiological temperature (PT) (34 ± 1°C), to 10 shock trains (gray traces) applied at different frequencies. The black trace is the average response of 50 repetitions at each frequency. The probability of release (P), the eIPSCs average amplitude (A), and the average response (S) were computed for every pulse during 10 shock trains. In C and D, the normalized mean values for these parameters are plotted versus the pulse number for 25 (C; n = 2 OHCs) and 50 Hz (D; n = 3 OHCs) stimulation frequencies. Note that, at 50 Hz, there is an increase in P and S along the train (D), whereas at 25 Hz these values remain stable (C).
We have previously shown that summation contributes to the increase in postsynaptic responses as a function of stimulation frequency, and that this effect is related to the slow time constant of the postsynaptic responses (Fig. 5F–J). Therefore, to evaluate whether the changes in the kinetics of IPSCs found at physiological temperatures affected the degree of summation during high-frequency stimulation, we used the model described above to reconstruct responses at 25 and 50 Hz in the presence and absence of facilitation. For this, we used a representative single-shock trace and the change in probability calculated in Figure 10 (Fig. 11A). As expected, the faster kinetics of IPSCs diminished the effect of summation on the increase in the average currents during trains. The maximal response increments in the Summation simulation were lower than those found at room temperature (plateau levels: 1.40 ± 0.03 and 2.7 ± 0.1 for 25 and 50 Hz, respectively; Fig. 11C, Summation). When facilitation was included in the simulation, the maximal response increment was not affected at 25 Hz, but it increased twofold for the 50 Hz simulations (plateau levels: 1.8 ± 0.1 and 5.0 ± 0.2 for 25 and 50 Hz, respectively; Fig. 11D, Summation and Facilitation). Similar results were found when the increase in current was calculated for the experimental data (plateau levels: 2.4 ± 0.1 and 13.7 ± 9.4 for 25, n = 2 OHCs, and 50 Hz, n = 3 OHCs, respectively; Fig. 11E, Experimental Data). Together, these results show that at physiological temperatures summation, although still significant at 50 Hz (Fig. 11B), is reduced at the lower stimulation frequency as a consequence of the faster kinetics of IPSCs. Facilitation, however, presented no significant differences with that observed at room temperature at both stimulation frequencies.

Effects of temperature on summation of postsynaptic responses. A, Representative IPSCs recorded at room temperature (RT) (∼24°C) and at a near physiological temperature (PT) (34 ± 1°C). To estimate the effects of temperature on summation during high-frequency stimulation, simulated responses were constructed from a single-shock response at 34°C (A, gray trace) considering only temporal summation (B, gray traces) or considering facilitation by also taking into account the change in the probability of release (B, black traces) for every shock (the change in P values was obtained from the experiments illustrated in Fig. 10C,D). Plots of normalized current versus pulse number were constructed from the simulation considering only Summation (C) or Summation and Facilitation (D). E, Plot of normalized current versus pulse number derived from the experimental data shown in Figure 10.
Discussion
This work is the first to describe synaptic transmission at the mammalian MOC–OHC synapse evoked by electrical stimulation of the MOC efferent fibers. We show that the MOC–OHC synapse has a low resting probability of release. However, presynaptic facilitation combined with postsynaptic summation significantly increase the reliability and strength of synaptic transmission during repetitive efferent activity. This is consistent with the strengthening of the MOC effect on auditory function observed in vivo upon increasing the frequency of efferent activity (Galambos, 1956; Wiederhold and Kiang, 1970; Brown and Nuttall, 1984; Gifford and Guinan, 1987) and shows that plasticity of the MOC–OHC synapse might determine the efficacy of MOC feedback to serve as the “gain control” of the auditory periphery.
Characteristics of the MOC–OHC synapse
The biophysical and pharmacological characteristics of eIPSCs in OHCs resemble those previously described for cholinergic currents elicited by the application of ACh to isolated mammalian OHCs (Dulon and Lenoir, 1996; Evans, 1996; Nenov et al., 1996a,b) and for spontaneous synaptic currents in OHCs from acutely isolated mouse organ of Corti (Oliver et al., 2000). This further supports the notion that the inhibitory sign of the MOC–OHC cholinergic synapse is due to Ca2+ entry through α9α10 nAChRs and the subsequent gating of calcium-activated SK2 potassium channels (Nenov et al., 1996b; Oliver et al., 2000). This “two-channel” cholinergic inhibitory synapse clearly differs from the usual ionotropic inhibition of GABAergic or glycinergic synapses (Moss and Smart, 2001). The unique features of the hair cell efferent synapse make it a valuable model to study the molecules and mechanisms involved in this unusual type of cholinergic transmission.
The overlap between the sIPSCs and eIPSCs amplitude histograms suggests that, on average, only one vesicle is released upon arrival of an action potential. In mice, the OHCs from the apical region are usually innervated by only one efferent fiber (Maison et al., 2003). In addition, one efferent axon only rarely makes more than one contact with each OHC (Wilson et al., 1991; Warr and Boche, 2003). Therefore, only one bouton will be activated each time an electrical shock is applied. The fact that amplitude histograms of sIPSCs were non-Gaussian could indicate the existence of variability among release sites as in CNS synapses (Jonas et al., 1993; Bekkers, 1994; Auger and Marty, 2000). Moreover, variability in the postsynaptic response amplitude at each active site (measured as SK current) could arise from the coupling between α9α10 nAChRs and the SK2 channels (Oliver et al., 2000; Katz et al., 2004), as well as in the calcium-induced calcium release from postsynaptic cisterns proposed to contribute to SK channel activation (Yoshida et al., 1994; Lioudyno et al., 2004).
The poor efficacy of synaptic transmission at the MOC–OHC synapse is reflected by the low quantum content of transmitter release (m = 0.31 ± 0.37) when eliciting single action potentials at a frequency of 1 Hz. This value is similar to that reported for the transient rat and mouse MOC–IHC synapses (m = 1 ± 0.5) (Goutman et al., 2005; Zorrilla de San Martín et al., 2010). The fact that this high rate of failures decreases upon increasing the extracellular Ca2+ concentration indicates that the unreliability of transmitter release at the MOC–OHC synapse is mainly due to the stochastic nature of release, rather than to axonal threshold variations or conduction failures (Allen and Stevens, 1994). At the transient mouse MOC–IHC synapse, it has been shown that coupling between L-type voltage-gated calcium channels and BK channels functions as a negative-feedback loop to decrease synaptic output (Zorrilla de San Martín et al., 2010). Therefore, this mechanism could contribute to the low initial probability of release at the MOC–OHC synapse.
Although there is no detailed description of the MOC efferent bouton ultrastructure, electron micrographs of hair cell synapses from different species show that efferent endings have a large number of synaptic vesicles (Lenoir et al., 1980; Nadol, 1988; Simmons et al., 1996; Bruce et al., 2000). What proportion of these vesicles makes up release sites is still unknown, but these results suggest that vesicle availability is not a limiting factor for release (Schikorski and Stevens, 1997; Xu-Friedman and Regehr, 2004). Conversely, the fact that release can be sustained for prolonged stimulation periods is consistent with the high density of synaptic vesicles in MOC boutons. Moreover, the fact that synaptic output at the MOC–OHC synapse significantly increases when the MOC fibers are stimulated at high rates further supports the hypothesis that vesicle availability is not the limiting factor. The strengthening of transmission is accounted for by both facilitation and summation of OHCs synaptic responses. Facilitation is due to an increase in the probability of release and is therefore of presynaptic origin. The effect of summation on synaptic output is accounted for by the long decay times of the combined nAChR and SK2 IPSCs. This notion is further supported by the fact that, despite the faster kinetics of IPSCs at physiological temperatures, summation still contributes to the increment in the postsynaptic responses at high frequencies of stimulation.
Functional consequences of short-term plasticity at the MOC–OHC synapse in auditory function
Despite differences in structure among vertebrate auditory organs, the main function of the efferent system is conserved among species: namely, to inhibit hair cells and thereby regulate the dynamic range of hearing (Art and Fettiplace, 1984; Guinan, 1996). Furthermore, some characteristics of efferent physiology are also quite similar. For example, a low resting level of release and facilitation of responses during high-frequency firing was found in the turtle papilla (Art et al., 1984) and at the transient efferent synapse to mammalian IHCs (Goutman et al., 2005). The present work shows that these properties also apply to MOC synapses on OHCs, the final targets of MOC efferent fibers in adult mammals (Simmons, 2002). Conservation of these synaptic mechanisms suggests they play an important role in the control of auditory function.
Synapses with low initial probability of release and strong facilitation have been postulated to work as high-pass filters (Fortune and Rose, 2001), responding best to high-frequency activity (Lisman, 1997). In the context of the mammalian auditory system, such a mechanism could allow OHCs to ignore spontaneous or infrequent MOC activity and establish a “threshold” for cochlear suppression. Moreover, summation and facilitation at the MOC–OHC synapse provide the additional benefit of scaling inhibition according to the frequency of MOC activity, thus fine-tuning cochlear amplification. This is particularly relevant since, in vivo, MOC fibers fire regularly but with variable frequencies (Robertson and Gummer, 1985; Liberman and Brown, 1986; Brown, 1989). In addition, it has been shown that, when MOC fibers are activated by sound (the MOC reflex), their firing frequencies are indeed modulated by stimulus properties such as intensity, origin (monoaural or binaural), or type (noise, tone) (Brown et al., 1998), and that efferent firing frequency increases linearly with sound intensity (Robertson and Gummer, 1985; Liberman and Brown, 1986; Brown, 1989; Brown et al., 1998). Therefore, short-term plasticity of the MOC–OHC synapse is relevant for encoding graded levels of efferent feedback.
Several characteristics of the MOC–OHC synapse correlate with results from in vivo studies of the MOC effect on auditory function. Thus, brainstem electrical stimulation of MOC neurons relies on high-frequency trains rather than single shocks to inhibit auditory function (Galambos, 1956; Wiederhold and Kiang, 1970; Mountain, 1980; Gifford and Guinan, 1987). Similarly, responses in OHCs rely on facilitation and summation to reach maximal inhibition. Moreover, it has been reported that, when high-frequency trains are applied to MOC neurons, the maximal inhibitory effect is attained after a few hundred milliseconds and that, upon shutting off the stimulus, the response decays to resting levels with the same delay (Wiederhold and Kiang, 1970). Likewise, summed IPSCs rise to a peak within 100–200 ms and usually decay over an equivalent interval. In addition, the strength of the efferent effect increases as the frequency of efferent stimulation increases, not only in mammals (Galambos, 1956; Wiederhold and Kiang, 1970; Brown and Nuttall, 1984; Gifford and Guinan, 1987) but also in other vertebrates (Flock and Russell, 1973; Art and Fettiplace, 1984) (Fig. 12A). As for these in vivo studies, the magnitude of OHC inhibition rises linearly with the frequency of efferent activation, saturating near 100 Hz (Fig. 12B). Finally, the increase of MOC firing rate with sound intensity (Robertson and Gummer, 1985; Brown, 1989; Brown et al., 1998) would lead to a greater gain reduction and is consistent with the hypothesis that one role of the MOC system is to protect from acoustic trauma (Rajan, 2000; Taranda et al., 2009). The consistency between in vivo physiological experiments and the present data suggests that the dynamics of the MOC–OHC synapse is indeed shaping cochlear responses to efferent inhibition.

Dependence of afferent function and the inhibitory responses of OHC on the frequency of efferent stimulation. A, Relationship between the frequency of MOC activation and inhibition of afferent activity in the cat [adapted from the studies by Galambos (1956) and Gifford and Guinan (1987)] and in the turtle [adapted from the study by Art and Fettiplace (1984)]. In the left y-axis efferent effect was quantified as the ratio between the amplitude of the N1 component of the compound action potential (CAP) produced by moderate sound stimulation (10–25 dB above threshold) with or without efferent stimulation [(N1w/shock/N1ctrl) × 100] (Galambos, 1956; Gifford and Guinan, 1987). The right y-axis shows the increase in sound intensity (threshold shift in decibels) necessary to evoke an afferent discharge as a function of the efferent stimulation frequency (Art and Fettiplace, 1984). B, Increment in eIPSC amplitudes (mean ± SEM) after 10 shocks of efferent stimulation at different frequencies. Due to data variability, the values from different cells were normalized to the increment in the amplitude of the response at a stimulation frequency of 50 Hz. Note that, in both afferent activity (A) and eIPSCs of OHC (B), there is a range of frequencies where there is a linear relationship between the frequency of MOC activation and the increment in inhibition.
Footnotes
-
This work was supported by Consejo Nacional de Investigaciones Científicas y Técnicas Grant PIP2005-2007 and National Organization for Hearing Research Grant NOHR 2007 (E.K.), University of Buenos Aires Grants UBACYT X107 2008–2010 (E.K.) and UBACYT M 2008–2010 (A.B.E.), Agencia Nacional de Promoción Científica y Tecnológica (Argentina) (A.B.E., E.K.), HHMI International Scholars Program (A.B.E.), and NIH Grant R01 DC001508 (P.A.F., A.B.E.).
- Correspondence should be addressed to Eleonora Katz, Instituto de Investigaciones en Ingeniería Genética y Biología Molecular, Consejo Nacional de Investigaciones Científicas y Técnicas, Vuelta de Obligado 2490, 1428 Buenos Aires, Argentina. ekatz{at}dna.uba.ar or eleokatz{at}gmail.com


