

Abstract
Global changes of activity in neuronal networks induce homeostatic adaptations of synaptic strengths, which involve functional remodeling of both presynaptic and postsynaptic apparatuses. Despite considerable advances in understanding cellular properties of homeostatic synaptic plasticity, the underlying molecular mechanisms are not fully understood. Here, we explored the hypothesis that adaptive homeostatic adjustment of presynaptic efficacy involves molecular remodeling of the release apparatus including the presynaptic cytomatrix, which spatially and functionally coordinates neurotransmitter release. We found significant downregulation of cellular expression levels of presynaptic scaffolding proteins Bassoon, Piccolo, ELKS/CAST, Munc13, RIM, liprin-α, and synapsin upon prolonged (48 h) activity depletion in rat neuronal cultures. This was accompanied by a general reduction of Bassoon, Piccolo, ELKS/CAST, Munc13, and synapsin levels at synaptic sites. Interestingly, RIM was upregulated in a subpopulation of synapses. At the level of individual synapses, RIM quantities correlated well with synaptic activity, and a constant relationship between RIM levels and synaptic activity was preserved upon silencing. Silencing also induced synaptic enrichment of other previously identified regulators of presynaptic release probability, i.e., synaptotagmin1, SV2B, and P/Q-type calcium channels. Seeking responsible cellular mechanisms, we revealed a complex role of the ubiquitin-proteasome system in the functional presynaptic remodeling and enhanced degradation rates of Bassoon and liprin-α upon silencing. Together, our data indicate a significant molecular reorganization of the presynaptic release apparatus during homeostatic adaptation to network inactivity and identify RIM, synaptotagmin1, Cav2.1, and SV2B as molecular candidates underlying the main silencing-induced functional hallmark at presynapse, i.e., increase of neurotransmitter release probability.
Introduction
Encoding of information in the brain is based on changes in signal transmission and flow, which is mainly achieved by strengthening or weakening of synaptic connections. The Hebbian, experience-induced plasticity results in input-specific changes in synapse strength and leads to increased or decreased excitabilities of strongly or weakly firing synapses, respectively (Neves et al., 2008). Such positive feedback mechanisms suit well the requirements for setting memory traces; however, in long the term it will cause destabilization of circuits by driving synaptic strength out of physiologically meaningful ranges. Homeostatic synaptic plasticity functions to counteract this possibility by adapting the excitability of neuronal networks to levels of ongoing activity and preventing circuits from overdrive by providing a negative feedback force (Pozo and Goda, 2010). Homeostatic adaptations are achieved by modulation of both presynaptic and postsynaptic functions (O'Brien et al., 1998; Turrigiano et al., 1998; Murthy et al., 2001). At the postsynapse, this involves mainly changes in AMPA receptor abundance and composition (O'Brien et al., 1998; Thiagarajan et al., 2005; Wierenga et al., 2005); at the presynapse, changes of neurotransmitter release probability (Pr) and quantal size were described (Murthy et al., 2001; Moulder et al., 2004; De Gois et al., 2005).
Despite considerable advances in understanding cellular properties of homeostatic synaptic plasticity during the past decade, the underlying molecular mechanisms are not fully appreciated. Functional remodeling of synapses requires corresponding molecular reorganization, which in turn demands changes in protein turnover. Indeed, global and local protein synthesis, synaptic recruitment, and proteasome-dependent degradation of receptors and their scaffolds were implied in postsynaptic homeostatic remodeling (Ehlers, 2003; Ju et al., 2004; Sutton et al., 2006; Seeburg et al., 2008). While homeostatic changes in quantal size could be attributed to activity-dependent regulation of expression of vesicular glutamate transporters (De Gois et al., 2005), the molecular mechanisms underlying the homeostatic regulation of the presynaptic Pr are completely elusive.
Here, we explored the hypothesis that homeostatic adaptation to changes in global network activity involve molecular remodeling of the presynaptic release apparatus including the presynaptic cytomatrix, which spatially and functionally coordinates neurotransmitter release (Fejtova and Gundelfinger, 2006). We found significant downregulation of total expression levels of presynaptic scaffolds Bassoon, Piccolo, ELKS/CAST, Munc13, RIM, liprin-α, and synapsin upon activity silencing. This was accompanied by general depletion of Bassoon, Piccolo, ELKS/CAST, Munc13, and synapsin from synaptic sites. Interestingly, RIM was upregulated in a subpopulation of synapses and RIM levels correlated with the activity at the single-synapse level. Activity silencing also drove synaptic enrichment of further previously identified regulators of Pr, i.e., the calcium sensor synaptotagmin1, the vesicular membrane protein SV2B, and Cav2.1, the pore-forming subunit of P/Q-type calcium channels. Seeking the underlying cellular mechanisms, we investigated the role of the ubiquitin-proteasome system (UPS) in functional presynaptic remodeling upon activity silencing. Despite the fact that pharmacological inhibition of the UPS induces a complex pattern of regulation of presynaptic scaffolding proteins, it does not affect presynaptic neurotransmitter release probability in silenced networks.
Materials and Methods
Antibodies.
The following primary antibodies were used for Western blot (WB), immunocytochemistry (ICC), and antibody uptake in the concentrations indicated: rabbit antibodies against Bassoon (Bsn) (Sap7f; WB and ICC, 1:2000; tom Dieck et al., 1998), RIM1/2 (against Zn-finger domain; WB and ICC, 1:1000, Synaptic Systems), Munc13-1 (WB and ICC, 1:1000, Synaptic Systems), liprin-α3 (recognizing all liprins-α; WB, 1:1000, Synaptic Systems), ERC 1b/2 (ELKS 1b/2; WB, 1:1000, Synaptic Systems), synapsin (WB, 1:1000, Synaptic Systems), Homer1 (WB, 1:1000, ICC, 1:2000, Synaptic Systems), synaptophysin (sph) (ICC, 1:5000, Synaptic Systems), SV2B (WB and ICC, 1:1000, Synaptic Systems), syntaxin6 (WB 1:1000, Synaptic Systems), VGLUT1 (ICC 1:1000, Synaptic Systems), synaptotagmin1 (stg1) (luminal domain; ICC, 1:500, Synaptic Systems), voltage-gated Ca2+ channel (P/Q-type, α1A subunit; ICC 1:1000, Synaptic Systems); mouse antibodies against βIII-tubulin (WB, 1:5000, Sigma-Aldrich), synaptophysin (clone SVP-38; WB, 1:1000, Sigma-Aldrich), PSD-95 (clone K28/43; WB, 1:2000, ICC 1:1000, UC Davis/NIH NeuroMab Facility), mitogen-activated protein 2 (MAP2) (clone HM-2; ICC, 1:2000, Sigma-Aldrich), syntaxin1 (WB, 1:1000, Synaptic Systems), gephyrin (ICC, 1:1000, Synaptic Systems), panMunc13 (WB and ICC, 1:250, BD Transduction Laboratories), synaptotagmin1 luminal domain fluorescence labeled with Oyster 550 (antibody uptake, 1:250, Synaptic Systems); antibodies from guinea pig against Piccolo (WB, 1:1000, ICC, 1:500; Dick et al., 2001) and synaptophysin 1 (ICC, 1:2000, Synaptic Systems), and from goat against AKAP 150 (N-19: sc-6446; WB, 1:500, Santa Cruz Biotechnology).
Fluorescently labeled secondary antibodies for ICC [Alexa Fluor 488-, Cy3 (1:2000)-, and Cy5 (1:1000)-labeled and peroxidase-coupled antibodies for WB (anti-mouse, anti-rabbit, and anti-guinea pig, 1:20,000–40,000] were purchased from Jackson ImmunoResearch; fluorescently labeled secondary antibodies for quantitative immunoblotting were purchased from Invitrogen (Alexa Fluor 680, 1:20,000) and from Rockland (IRDye 800 W, 1:20,000).
Primary neuronal cultures for WB and ICC.
Primary cultures of cortical neurons were prepared essentially as described previously (Goslin et al., 1998). Cells from embryonic day 16 (E16)–E17 brains of rats of either sex were dissociated after incubation in Ca- and Mg-free Hanks' balanced salts solution with 0.25% trypsin for 20 min and plated at the desired density in DMEM including 10% fetal calf serum (FCS), antibiotics (100 U/ml penicillin, 100 μg/ml streptomycin), and 0.8 mm glutamine. Twenty-four hours after plating, the medium was exchanged for Neurobasal medium supplemented with B27 (Life Technologies), antibiotics, and 0.8 mm glutamine. All cells were kept in a humidified incubator with 5% CO2. Cells (30,000 cells/cm2) were plated in polystyrene dishes for immunoblots and on poly-l-lysine-coated glass coverslips for immunocytochemistry. For electrophysiological measurements, 10,000/cm2 cells were plated on coated glass coverslips. Pharmaceutics were used in the following concentrations (in μm): 50 d-(−)-2-amino-5-phosphonopentanoic acid (d-AP5) (Tocris Bioscience) and 10 6-cyano-7-nitroquinoxaline-2,3-dione disodium (CNQX) (Tocris Bioscience), 50 picrotoxin (PTX) (Tocris Bioscience), 2 tetrodotoxin (TTX) (Tocris Bioscience), and 10 MG132 (Calbiochem).
Quantitative immunoblotting.
Whole-cell lysates were used for all immunoblots. Cortical primary cultures were washed briefly with the buffer containing 10 mm Tris and 300 mm sucrose, pH 7.4, and then lysed in a buffer containing 10 mm Tris-HCl, pH 7.4, 150 mm NaCl, 2% SDS, 1% deoxycholate, 1% Triton X-100, supplemented with Complete Protease Inhibitor Cocktail (Roche) and PhosSTOP Phosphatase Inhibitor Cocktail (Roche). Lysates were cleared by centrifugation at 14,000 × g for 10 min. Protein concentrations were determined using the colorimetric amido black assay. Equal protein amounts (7–10 μg per line) were separated using one-dimensional SDS-PAGE and then electrotransferred to Millipore Immobilon-FL PVDF membranes. Blots were incubated with the primary antibody (diluted in PBS containing 0.1% Tween 20, 5% BSA, and 0.025% sodium azide) at 4°C overnight and subsequently either with peroxidase-coupled secondary antibodies (diluted in 1% BSA) or with fluorescently labeled secondary antibodies (diluted in PBS-Tween 20 containing 5% BSA and 0.01% SDS) for 1 h at room temperature. Immunodetection was performed with Hyperfilm ECL films (GE Healthcare Life Sciences) or using an Odyssey Infrared Scanner (LI-COR), respectively. In each experiment, three independent samples per treatment were prepared and all samples were loaded three times, resulting usually in nine values used for statistical analysis. Quantifications were performed using Odyssey software v2.1 (LI-COR). From the optical density (OD) determined for each band, the background (taken as mean of the three empty areas from the membrane) was subtracted and values were normalized using βIII-tubulin as a loading control.
Immunocytochemistry.
Neurons were fixed in 4% paraformaldehyde, 4% sucrose in PBS for 5 min at room temperature. Before immunostaining, the samples were blocked with 10% FCS, 0.1% glycine, and 0.3% Triton X-100 in PBS. Primary antibodies were applied overnight at 4°C, secondary antibodies for 1 h at room temperature. Both primary and secondary antibodies were diluted in PBS containing 3% FCS. Coverslips were mounted on slides with Mowiol (Calbiochem). For live staining with synaptotagmin1 luminal domain antibody, cells were briefly washed with freshly prepared Tyrode's buffer (containing, in mm: 119 NaCl, 2.5 KCl, 2 CaCl2, 2 MgCl2, 30 glucose, 25 HEPES, pH 7.4) and incubated with fluorescence-labeled primary antibody either for 30 min at 37°C in the above buffer to monitor spontaneous activity-induced uptake, or for 4 min at room temperature in high K+-Tyrode's buffer containing 71.5 mm NaCl and 50 mm KCl to assess evoked uptake. Thereafter, samples were fixed and stained. In each experiment, ≥2 coverslips per treatment were processed in parallel. For the cytotoxicity assay, neuronal cultures were incubated for 30 min with 6 μm propidium iodide (Fluka), which stains nuclei of dead and apoptotic cells. After extensive washing with Tyrode's buffer, samples were fixed and stained with DAPI (1 μg/ml) to visualize all cell nuclei. Propidium iodide-positive cells were counted in regions of 200 μm2 and expressed as percentage of total cells visualized with DAPI stain.
Electrophysiology.
Coverslips were mounted into the recording chamber and perfused with external solution containing (in mm): 145 NaCl, 10 glucose, 10 HEPES, 5 KCl, 2 CaCl2, 2 MgCl2. Whole-cell voltage-clamp recording was performed using an EPC10 amplifier and PatchMaster v. 2.11 (HEKA) at room temperature. Electrodes were filled with internal recording solution containing (in mm): 130 K-gluconate, 10 HEPES, 0.1 EGTA, 1 CaCl2, 2 MgCl2, 4 Na2-ATP, 0.3 Na-GTP, pH 7.2–7.3, and had a final resistance of 3–5 MΩ. Bicuculline (10 μm), TTX (1 μm), and d-AP5 (10 μm) were applied during the recording to pharmacologically isolate AMPA-mediated miniature EPSCs (mEPSCs). Measurements were performed with a holding potential of −60 mV. To monitor changes in input and access/series resistance, a hyperpolarization step of 10 mV for 50 ms was applied every 500 s. The sampling rate was 10 kHz. Analysis of mEPSCs was performed using MiniAnalysis version 6.0.7 (Synaptosoft). For statistical analysis of mEPSC amplitudes and inter-event intervals, the first 200 events recorded from each cell were selected.
Image acquisition and analysis.
Images were acquired with Zeiss Axioplan2 (Zeiss Microimaging), a SPOT RT-KE camera (Diagnostics Instruments), and MetaVue software (Molecular Devices). For each set of coverslips (treatments vs control), the same exposure time was taken. Immunoreactive puncta were always counted along the 20 μm of proximal dendrite in >10 fields on each of 2 coverslips in each experiment resulting in minimally 10 values for statistical analysis. The same fields were used for measuring the staining intensity. All images were analyzed using NIH ImageJ or OpenView software (written by N. Ziv; Tsuriel et al., 2006) with appropriate background subtraction and adjusted for presentation using Photoshop (Adobe Systems).
Statistics.
Statistical analyzes were performed with Prism 4 software (GraphPad Software) using one-way ANOVA, t test, Spearman correlation analysis, and Deming regression (as indicated for each experiment).
Results
Prolonged network silencing affects expression levels of presynaptic proteins
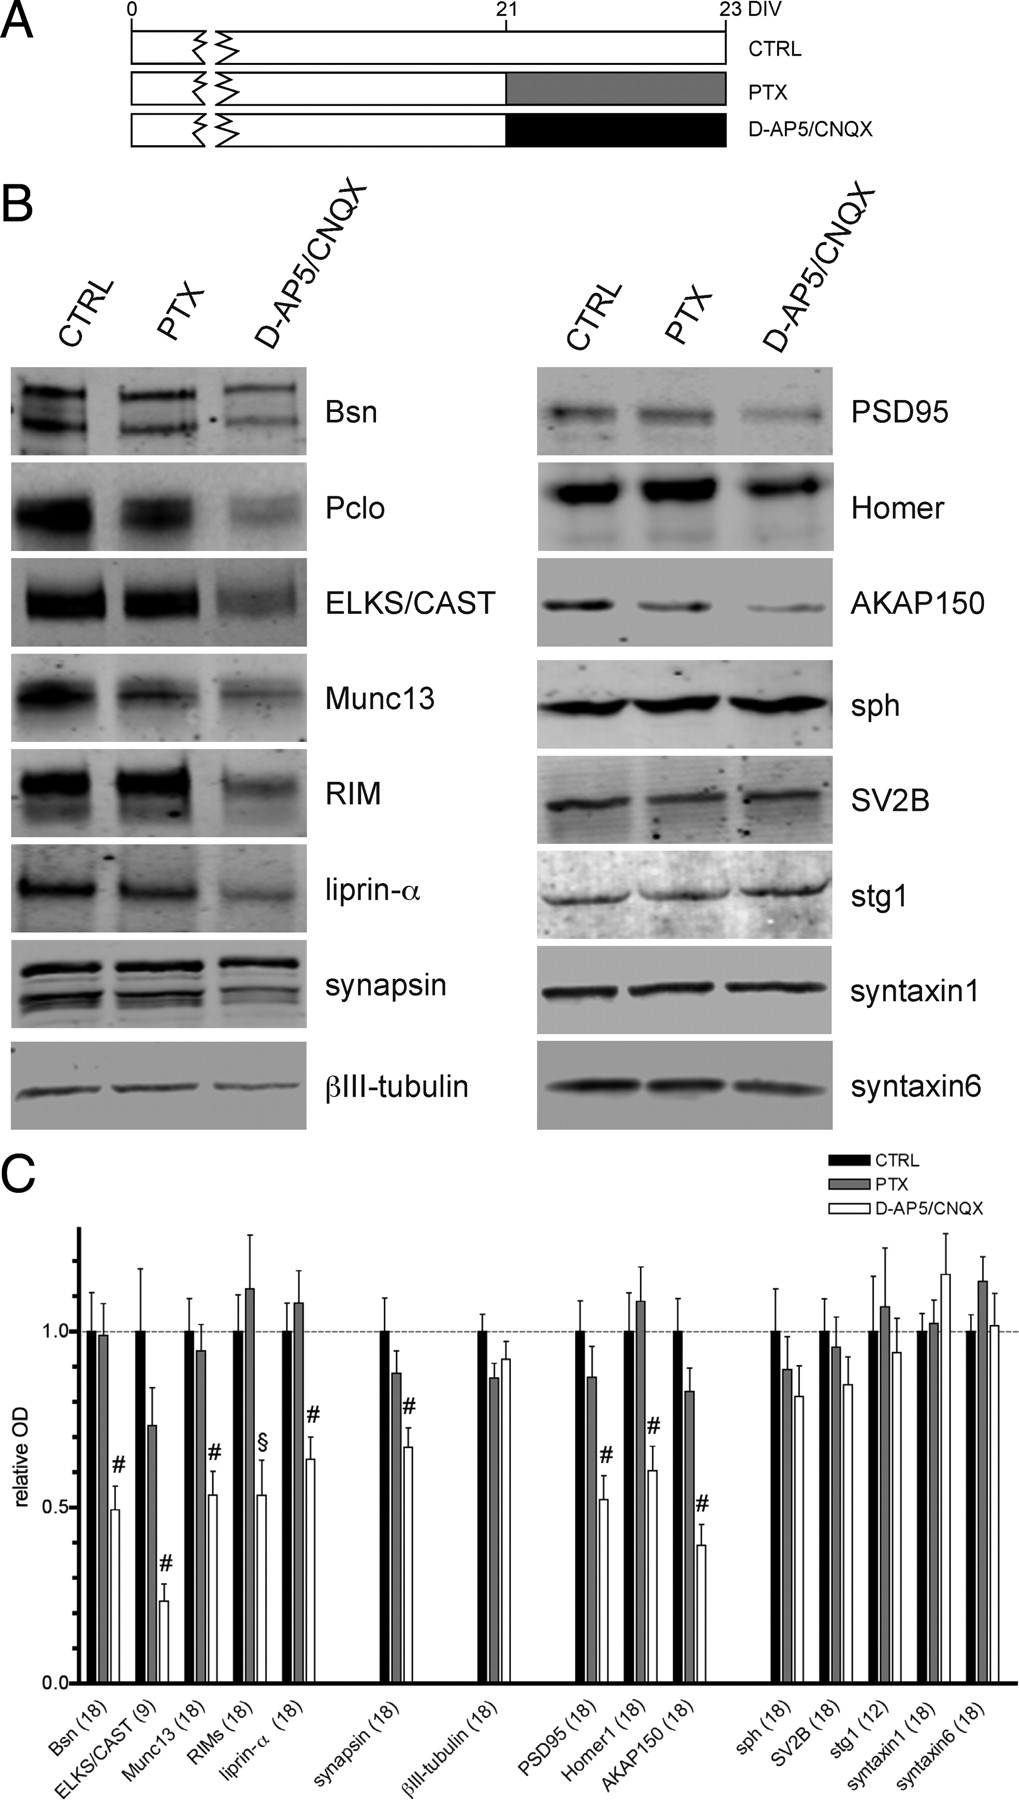
To examine whether synaptic activity alters the molecular composition of the presynaptic cytomatrix at the active zone (CAZ), we used rat cortical neuronal cultures as a convenient model system allowing various activity-related pharmacological manipulations and analysis by biochemical methods and immunochemical staining. We altered global synaptic network activity of neurons grown for 21 days in vitro (DIV) by addition of either NMDA- and AMPA-receptor antagonists d-AP5 (50 μm) and CNQX (10 μm), which leads to silencing of synaptic transmission, or GABAA receptor antagonist PTX (50 μm), which increases global network activity by disinhibition, to growth media (Fig. 1A). The treatment did not affect the cell survival in our cultures as assessed by staining for apoptotic and dead cells (control, 29 ± 8%, n = 7 fields; d-AP5/CNQX, 21 ± 5%, n = 5; and PTX, 22 ± 5% (N = 7) of propidium iodide-stained cells). To examine effects of the treatment on the expression levels of selected proteins, treated and control cells were lysed in a buffer containing 1% Triton X-100, 1% deoxycholate, and 2% SDS. Under these conditions, the vast majority of cellular proteins including CAZ and postsynaptic density (PSD) proteins are solubilized. Using quantitative immunoblot analysis, we found that total expression levels of the presynaptic cytomatrix-associated proteins Bassoon, RIMs, ELKS/CAST, Munc13-1, liprins-α, and synapsins, as well as the postsynaptic scaffolding proteins PSD-95, Homer 1, and AKAP 150 were dramatically lowered after treatment with d-AP5 and CNQX. The treatment with PTX did not induce significant changes, which is likely due to a high-activity status of untreated mature primary cultures (DIV 21–DIV 23) as we used them in our experiments (Fig. 1B,C). In contrast, total expression levels of neuronal marker protein βIII-tubulin, synaptic vesicle proteins synaptophysin, SV2B, and synaptotagmin1, and SNARE-family proteins syntaxin1 and syntaxin6 were not significantly changed by any treatment applied (Fig. 1B,C).

Quantification of cellular expression levels upon activity-modulation in networks of primary neurons. A, Timing of treatments for all experimental groups. Neurons were harvested at DIV 23; 2 d before harvesting, they were exposed to PTX or d-AP5/CNQX to modulate network activity. B, Representative Western blots for all analyzed proteins. C, Results of quantification. Numerical OD values were normalized to mean value of control. The bars represent means of values obtained in two independent experiments; number of analyzed values is indicated for each protein. Error bars indicate SEM. The statistical significance was assessed using one-way ANOVA with Bonferroni post hoc test; §p < 0.01, #p < 0.001.
The prolonged silencing of global network activity was previously shown to induce homeostatic adaptations of synaptic strength (Turrigiano et al., 1998; Burrone et al., 2002). We confirmed that silencing of neurotransmission for 48 h induced homeostatic plasticity in neuronal networks by testing for its typical functional hallmarks, i.e., increase of amplitudes and frequencies of mEPSCs, by whole-cell patch-clamp recordings (Fig. 2A,B,E,F,I–L; see below, Downregulation of presynaptic scaffolds by network activity involves the ubiquitin-proteasome system). Prolonged silencing of network activity by alternative means such as treatment with the Na+ channel blocker TTX (2 μm), which suppresses the propagation of action potentials, resulted in a similar downregulation of expression levels of tested proteins (data not shown). Accordingly, the observed downregulation of cytomatrix-associated proteins was more likely due to changes connected to homeostatic adaptation to network activity silencing, rather than to specific effects of the blockade of glutamate receptor function by d-AP5 and CNQX. Total protein levels of presynaptic scaffolds were not yet significantly changed 24 h after adding the glutamate receptor blockers, suggesting that the observed downregulation reflects a long-term adaptation to network activity withdrawal. However, the downregulation was reproducibly seen in cultures maintained for 15, 19, or 21 DIV before the 48 h pharmacological treatment (data not shown). Importantly, protein levels significantly recovered 48 h after washout of drugs, indicating that the observed decrease of expression levels is not due to an irreversible damage of cells but, rather, reflects a cellular mechanism underlying homeostatic plasticity (Fig. 3).

Effect of proteasomal inhibition on mEPSC amplitudes and frequencies in normal active and silenced cultures. A–H, Example traces (A–D) and averaged mEPSC slopes (E–H) recorded from neurons in the control situation (A, E), after activity silencing (B, F), and upon MG132 treatment of control (C, G) and silenced (D, H) cultures. I, K, Cumulative distribution of averaged mEPSC amplitudes (I) and interevent intervals (K) were plotted for all treatments. J, L, Quantification of 200 mEPSC amplitudes (J) and interevent intervals (L) for all treatments. Mean values are shown; whiskers indicate SEM. Significance was tested with one-way ANOVA with Bonferroni post hoc test; **p < 0.01, ***p < 0.001.

Silencing-induced downregulation of synaptic scaffolds is reversible. A, Timing of treatments for all experimental groups. Neurons were harvested at DIV 23. Activity blockers were added for 48 h either 2 d before harvesting or 4 d before harvesting, followed by 2 d of recovery phase in medium without blockers (washout group). B, Representative Western blots for the analyzed proteins. C, Results of quantification. The bars represent means of nine analyzed sets of values normalized to controls obtained in one of two experiments performed, both yielding comparable results. Whiskers indicate SEM. The statistical significance was assessed using one-way ANOVA with Bonferroni post hoc test; *p < 0.05, §p < 0.01, #p < 0.001.
Suppression of network activity does not influence synapse density
The substantial decrease of cellular expression of presynaptic scaffolding proteins upon activity deprivation might reflect a decrease of overall synaptic density in silenced networks. To address this issue, we stained d-AP5/CNQX-treated and control cultures with antibodies against synaptic vesicle (SV) marker proteins including synaptophysin, SV2B, and synaptotagmin1, the total expression levels of which were not changed upon treatment. We quantified the number of immunoreactive puncta along 20 μm segments of proximal dendrites delineated by anti-MAP2 antibody staining. The number of synaptophysin-, SV2B-, and synaptotagmin1-marked puncta was not changed in silenced cultures compared with controls, indicating that prolonged network silencing has no effect on the density of SV clusters (Fig. 4A,B,F; synaptophysin, 104 ± 4% of control, n = 59/54 fields in control/silenced cultures; SV2B, 100 ± 4%, N = 26/32; synaptotagmin1, 99 ± 6%, N = 21/22). In contrast, the number of puncta positive for the SV-associated protein synapsin was significantly reduced (Fig. 4C,F; 70 ± 3% of control, n = 16/20), and the number of immunoreactive puncta for the vesicular glutamate transporter 1 (vGlut1) was significantly increased (Fig. 4D,F; 118 ± 5% of control, n = 20/19). This points to a differential regulation of particular presynaptic markers.
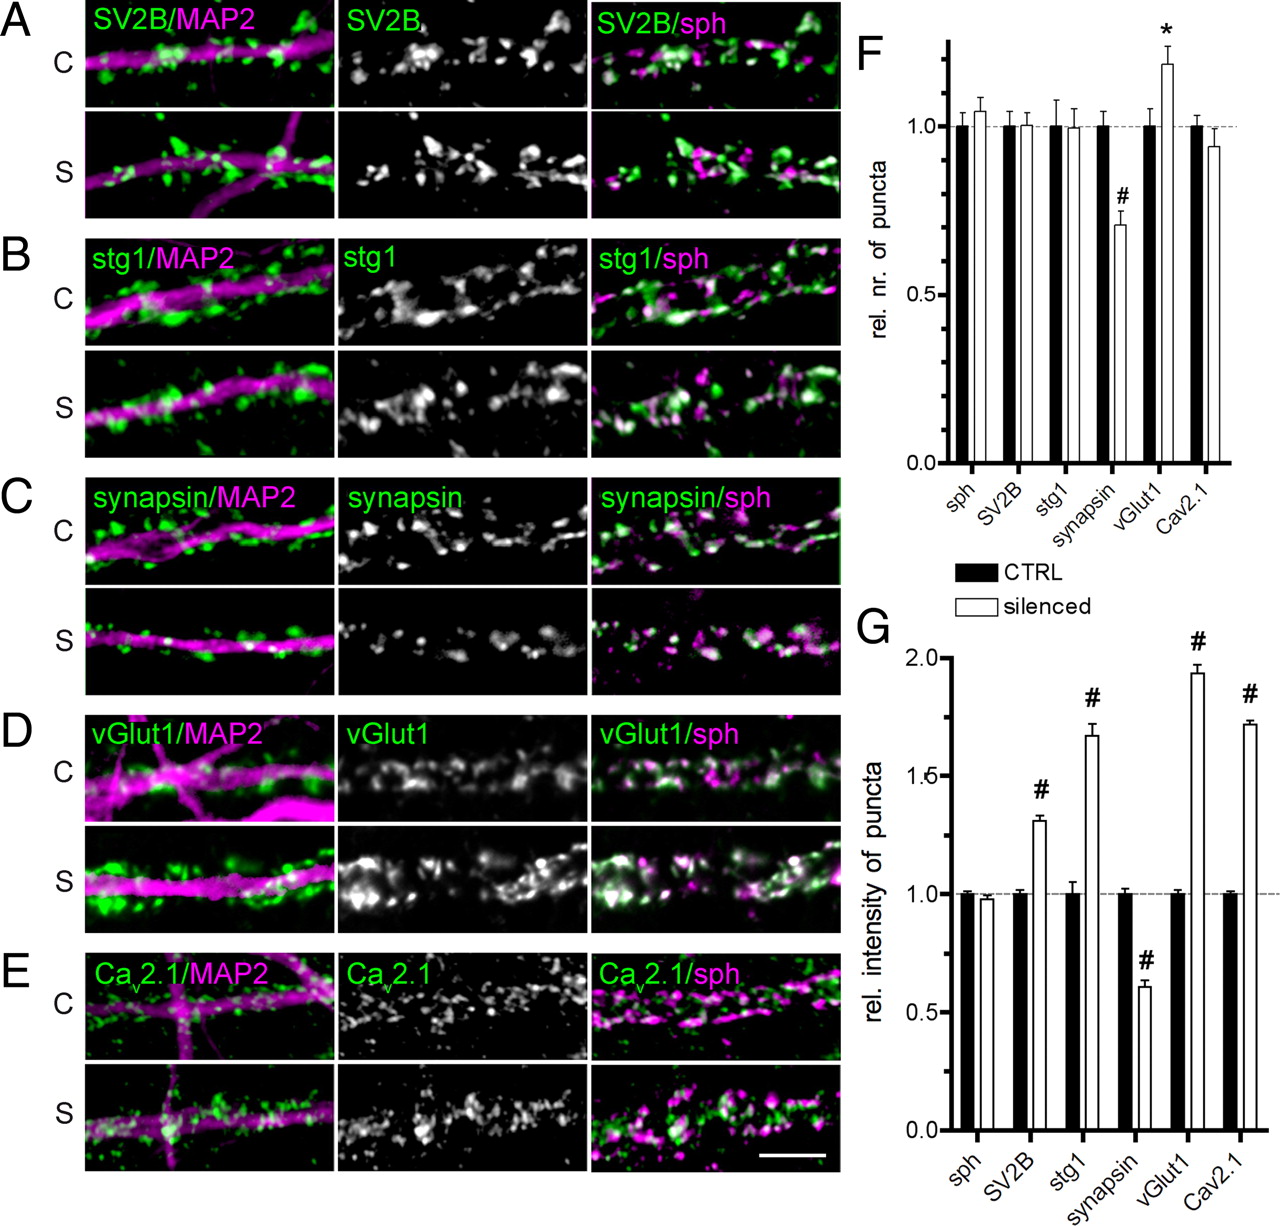
Quantification of presynaptic protein levels upon activity withdrawal. A–E, Examples of immunostainings for various presynaptic proteins in control (C) and silenced (S) cultures. The left images are overlay images with MAP2 staining (in magenta); middle images, fluorescence staining for the analyzed protein (green in overlays); and right images, overlay images with synaptophysin (in magenta). Scale bar (in E), 5 μm; applies to all panels. F, G, Quantification of numbers of puncta along a 20 μm segment of dendrites (F), and average intensity of staining (G). Values are averages from two independent experiments and are normalized to control. Bars represent the mean values; whiskers, SEM. The statistical significance was assessed using a t test; *p < 0.05; #p < 0.0001.
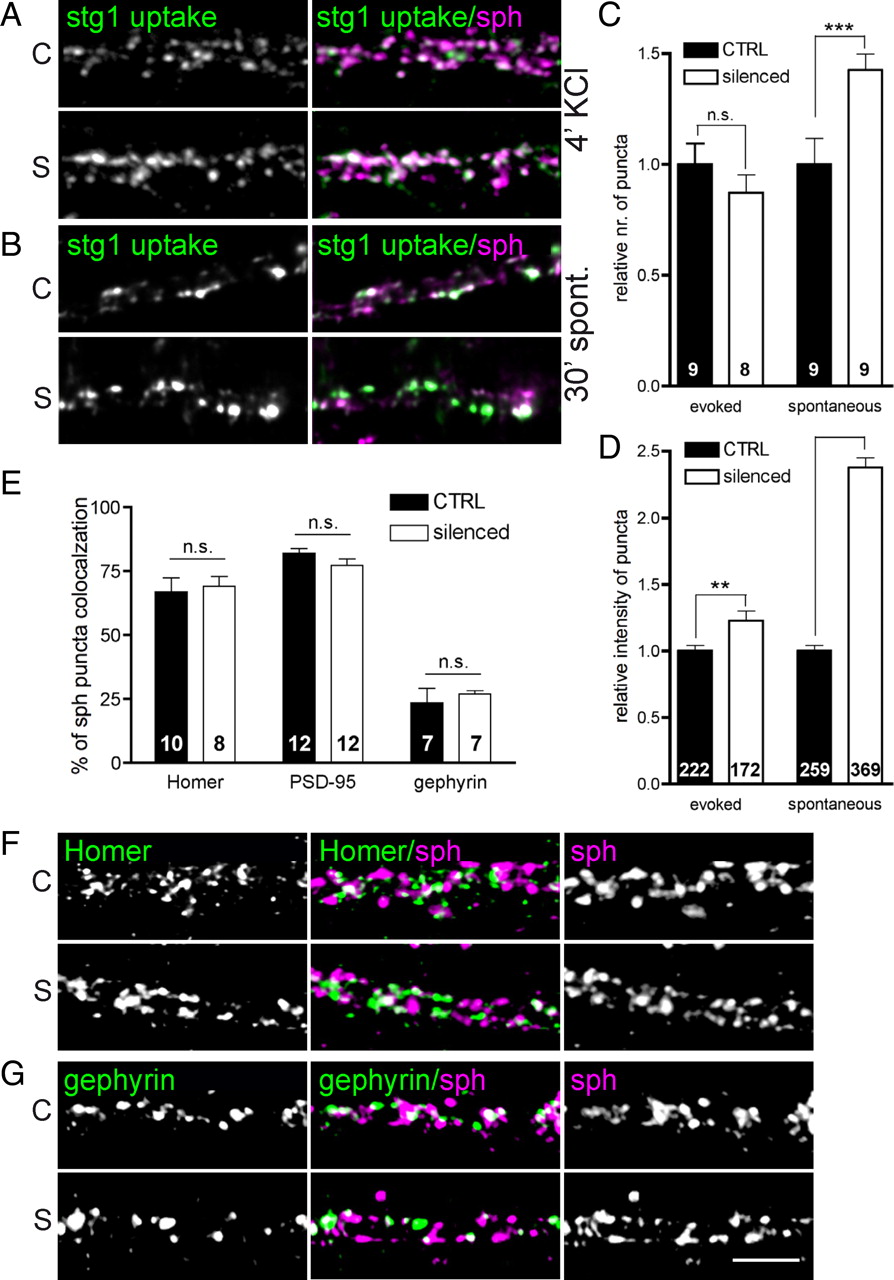
Next, we determined the number of active synapses in control and silenced cultures by a brief depolarization-induced in vivo labeling of recycling SV with fluorescence-coupled antibody directed against the luminal domain of the transmembrane SV protein synaptotagmin1. No differences in numbers of active synapses were found between the two conditions (Fig. 5A,C), confirming that activity silencing does not regulate number of presynaptic specializations in mature cortical cultures as assessed by morphological or functional markers.

Quantification of synaptotagmin1 antibody uptake and alignment of presynaptic and postsynaptic elements in control (C) and silenced (S) cultures. A–D, Evoked (A) or spontaneous activity-induced (B) uptake of synaptotagmin1 antibody was quantified. Example images are shown for synaptotagmin1 immunoreactivity in the left images and in green in overlays, with synaptophysin (magenta) on the right. Quantification of the number of synaptotagmin1-positive puncta along a 20 μm segment of dendrite (C) and the intensity of staining at individual synapses (D). E–G, Quantification of the alignment of the presynaptic SV cluster marker synaptophysin with markers of excitatory (Homer and PSD-95) and inhibitory (gephyrin) postsynapses. Example images are shown for stainings against postsynaptic marker Homer (F) and gephyrin (G) in the left images and in green in overlays, and against synaptophysin in the right images, and magenta in overlays. Scale bar, 5 μm. In plots, bars represent mean values obtained from two parallel experiments; whiskers, SEM. Number of analyzed fields/synapse is stated for each quantification. Statistical significance was assessed using a t test; **p < 0.01, ***p < 0.0001.
The existence of presynaptic release sites not aligning with postsynaptic structures was described previously (Krueger et al., 2003). To investigate whether the activity level regulates the number of such orphan synapses, we performed double staining for SV clusters using a synaptophysin antibody and markers of excitatory (Homer and PSD-95) or inhibitory (gephyrin) postsynapses (Fig. 5E–G). The quantitative analysis revealed no changes in the degree of alignment of presynaptic SV clusters with postsynaptic specializations between control and silenced neurons (Fig. 5E). This result confirmed our assumption that pharmacological manipulation of the level of network activity does not affect the synapse number in our preparation.
Network silencing induces remodeling of synaptic scaffolds
To study how the activity deprivation-induced general decline of expression levels of presynaptic cytomatrix-associated proteins affected their presence at individual synapses, we performed immunostainings with specific antibodies (Fig. 6A–G) and counted the number of immunofluorescent puncta along 20-μm-long segments of proximal dendrites. Similar to what we observed for synapsin (Fig. 4C,F), the number of puncta was significantly decreased for Bassoon (to 73 ± 3% of control, n = 39/38 fields analyzed in control/silenced condition), Piccolo (71 ± 4%, n = 38/36), Munc13-1 (75 ± 6%, n = 25/28), RIMs (67 ± 2%, n = 33/36), and ELKS/CAST (82 ± 4%, n = 10/10) in silenced cultures compared with controls (Fig. 6B–H). Due to the lack of antibody suitable for immunocytochemistry, it was not possible to assess how activity silencing affects synaptic levels of liprins-α.
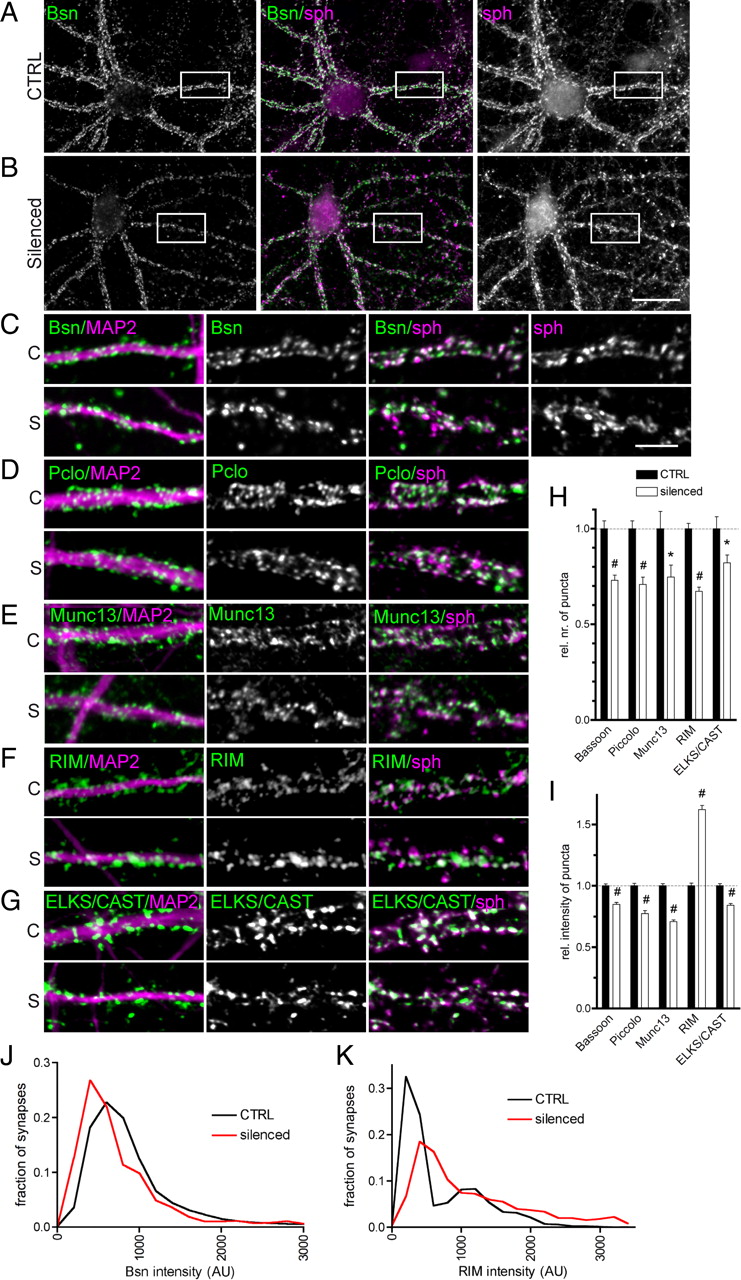
Quantification of presynaptic cytomatrix protein levels by immunocytochemical staining of control (C) and silenced (S) cultures. A, B, Example of whole-cell staining for Bassoon (left image and green in the overlay image in the middle), and synaptophysin (right image and magenta in the overlay in the middle). The white rectangle delineates the region shown in higher magnification in C. C–G, The images show overlays of staining of the protein of interest (in the middle and green in overlay images) with MAP2 (left, in magenta) and with synaptophysin (magenta in the right overlay). Scale bars: B, 20 μm; and C, 5 μm. H, I, Quantification of the number of puncta along a 20 μm segment of dendrite (H) and the intensity of staining (I). Values are averages from two independent experiments and are normalized to control. Bars represent mean values; whiskers, SEM. The statistical significance was assessed using a t test; *p < 0.05, #p < 0.0001. J, K, Distribution of immunofluorescence intensities in individual synapses is shown for Bassoon (J) and RIM (K).
Activity deprivation might affect recruitment of presynaptic components to the synapse. To test for this possibility, we performed colocalization studies for presynaptic scaffolding proteins with the SV marker protein synaptophysin (a reliable marker of synapses as shown by the alignment with the postsynaptic markers in Fig. 5E–G) under either condition. The percentage of puncta immunoreactive for the presynaptic scaffolds colocalizing with synaptophysin did not differ between silenced and control cultures (e.g., Bassoon, 92 ± 2% in control vs 88 ± 3% in silenced, n = 8/8 fields in control/silenced; RIM, 97 ± 1% vs 93 ± 3%, n = 8/8; Munc13-1, 87 ± 3% vs 89 ± 2%, n = 25/28). This indicates that the proportion of extrasynaptic versus synaptic puncta was preserved. Next, we measured the immunofluorescence intensities at individual synapses and compared intensity values for presynaptic scaffolds in both conditions. We found significantly reduced levels of synaptic Bassoon (84 ± 2% of control, n = 1787/1444 synapses in control/silenced cultures, respectively). Similarly, Piccolo (77 ± 2%, n = 1021/631), Munc13-1 (70 ± 1%, n = 527/440), ELKS/CAST (84 ± 1%, n = 587/484), and synapsin (60 ± 3%, n = 608/537) were reduced in silenced synapses, suggesting an overall depletion of these scaffolds from synaptic contacts upon activity deprivation (Fig. 6B–E,G,I; cf. Fig. 4C,G). A clearly different picture was observed for RIMs. Their synaptic immunofluorescence levels were elevated in silenced neurons (Fig. 6F,I; 161 ± 3% of control, n = 1504/1102 synapses in control/silenced), which, together with an overall depletion of RIMs from a subset of synapses, indicates a remarkable redistribution of these proteins upon prolonged network activity silencing. Surprisingly, the synaptic levels of the priming factor Munc13-1 were regulated differently from RIM, which was suggested to mediate its synaptic targeting (Betz et al., 2001). One possible explanation for this discrepancy would be a switch in expression of Munc13 isoforms upon activity silencing. To test this, we reinvestigated regulation of Munc13s using a panMunc13 antibody on immunoblots and in immunocytochemical staining. The same regulation observed with both the Munc13-1-specific antibody and the panMunc13 strongly argues against a silencing-induced switch in Munc13 isoforms (data not shown).
RIM levels correlate with presynaptic activity
Prolonged network silencing leads to an increased synaptic release probability (Pr) for neurotransmitter (Murthy et al., 2001). In accordance with this, we observed a significantly increased uptake of antibody against the luminal domain of synaptotagmin1 driven by spontaneous events upon silencing compared with control cultures (1.5-fold increase in number of puncta indicating antibody uptake and 238 ± 7% uptake intensity compared with control; Fig. 5B–D). In addition, the short depolarization-induced anti-synaptotagmin1 antibody uptake was enhanced in silenced cultures (122 ± 7% of uptake in control; Fig. 5A,D). This is consistent with the recently reported regulation of recycling vesicle pool size upon activity silencing (Kim and Ryan, 2010).
RIM proteins were implied in regulating Pr at conventional synapses (Schoch et al., 2002; Kaeser et al., 2008). Therefore, we tested the hypothesis that synapses displaying high RIM immunoreactivity might represent the highly active synapses emerging upon activity deprivation. We incubated control and silenced cultures with the anti-synaptotagmin1 antibody for 30 min to label recycling SVs, before fixation and staining for RIM and synaptic marker synaptophysin (Fig. 7A). To analyze the dependency of RIM levels on activity, we measured the intensity of RIM and synaptotagmin1 immunofluorescence in individual synapses identified by synaptophysin staining. The correlation analysis revealed a remarkably good correlation of RIM and synaptotagmin1 intensities at individual synapse levels in both normally active and silenced cultures (Spearman r: 0.67 in control and 0.82 in silenced cultures; Fig. 7G). Moreover, calculation of Deming regression for RIM and synaptotagmin1 labeling resulted in fits with slopes that did not differ significantly (Fig. 7G, red and black lines). This suggests that the relationship of RIM levels and activity at individual synapses remains preserved upon homeostatic adaptation after blockade of ionotropic glutamate receptors. In contrast, an analogous analysis showed a lower correlation of synaptic activity with Munc13-1 or Bassoon levels at individual synapses (Spearman r: 0.50 and 0.49 for Munc13-1, and 0.23 and 0.49 for Bassoon in control and silenced cultures; Fig. 7B,C,H,I). Moreover, the relation between synapse activity and Munc13-1 or Bassoon levels was not preserved during network activity silencing (Fig. 7H,I).

Correlation of activity and levels of presynaptic scaffolds at individual synapses. A–C, Example stainings used for correlation analysis of levels of RIM (A), Munc13-1 (B), and Bassoon (C) in control and silenced cultures. Spontaneous activity-driven synaptotagmin1 antibody uptake is shown in magenta in the left overlays and synaptophysin staining in the right overlay images. In green and in the middle image, stainings for the protein of interest are provided. Scale bar, 5 μm. D–F, Analysis of RIM (D), Munc13-1 (E), and Bassoon (F) intensities in active versus inactive synapses under both activity conditions, with indication of the number of synapses analyzed in each group. Bars give mean intensity values, obtained in one of two experiments performed, both yielding comparable results; whiskers show SEM. Significance was assessed by one-way ANOVA with Bonferroni post hoc test; **p < 0.01, ***p < 0.001. G–I, Correlation analysis of immunofluorescence intensities of RIM (G), Munc13-1 (H), and Bassoon (I) and spontaneous synaptotagmin1 uptake levels at individual synapses. Red triangles represent synapses in silenced cultures, and black squares, those in control cultures. The Spearman correlation coefficients and significance of correlation are provided in insets in each plot. Deming regression fits are shown as black (control) and red (silenced) lines.
Next, we compared immunoreactivities of RIM, Munc13, and Bassoon between active (showing anti-synaptotagmin1 antibody uptake) and inactive synapses under conditions of normal activity and after activity deprivation. Under both conditions, significantly higher immunoreactivity for RIM and Munc13-1 was found in active compared with inactive synapses (Fig. 7D,E). No difference in Bassoon immunoreactivity between active and inactive synapses in normally active cultures was found. However, Bassoon levels were significantly higher in active compared with inactive synapses of silenced cultures (Fig. 7F). Together, the results of our analysis revealed a strikingly good correlation of RIM levels and activity at the level of individual synapses and a constant relationship between RIM and activity in control and silenced neurons. This suggests a role for RIMs in homeostatic presynaptic strengthening upon activity deprivation.
Network silencing leads to synaptic enrichment of synaptotagmin1 and Cav2.1
In addition to the presynaptic scaffolding proteins that are able to modulate efficacy of SV release by regulating their tethering, docking, and priming at the active zone, the molecules involved in Ca2+ sensing and controlling of Ca2+ influx into cells might also be involved. Therefore, we investigated whether synaptic levels of synaptotagmin1, the main Ca2+ sensor for SV exocytosis, and the P/Q-type channel Cav2.1 are regulated at synapses after activity deprivation. Similar to synaptotagmin1 (see above, Suppression of network activity does not influence synapse density), the number of puncta immunoreactive for Cav2.1 did not differ significantly between activity-deprived and control cultures (Fig. 4E,F; 94 ± 5% of control, n = 31/38 fields analyzed in control/silenced cultures). However, we observed a significant increase of immunofluorescence intensity for both synaptotagmin1 (167 ± 5% of control, n = 637/712 synapses analyzed in control/silenced cultures) and Cav2.1 (172 ± 2%, n = 1762/1494) upon silencing (Fig. 4B,E,G). This suggests an upregulation of synaptic levels of these two proteins upon prolonged activity deprivation. We also quantified the amount of the SV membrane proteins synaptophysin and SV2B under both conditions and found that immunofluorescence intensity of the SV marker synaptophysin was not changed (104 ± 4%, n = 627/677), whereas synaptic SV2B levels increased to 131 ± 2% (n = 898/1109) of control (Fig. 4A,G) in activity-deprived cultures, suggesting that the activity status controls the molecular composition of SVs.
Downregulation of presynaptic scaffolds by network activity involves the ubiquitin-proteasome system
We demonstrated that prolonged silencing of network activity leads to a prominent depletion of presynaptic scaffolds from synaptic sites. To assess potential mechanisms regulating this down-scaling of presynaptic cytomatrix proteins, we tested whether this depletion might involve the UPS. To this end, we blocked UPS-dependent protein degradation by treatment of control and silenced cultures with 10 μm MG132. Treatment with MG132 for 24 or 48 h did not result in increase of protein levels as expected, but led to a downregulation of multiple known UPS targets (e.g., RIM, Munc13-1, and liprin-α) and other presynaptic and postsynaptic scaffolding proteins such as Bassoon, ELKS/CAST, Homer, and synapsin. The same treatment did not affect levels of synatxin1, SNAP25, or tubulin and resulted in increased levels of the reported UPS target synaptophysin (data not shown). Recently, it was described that prolonged proteasome inhibition affects protein synthesis (Ding et al., 2006). We assume that this effect accounts for the somehow unexpected result. To circumvent the late effects of UPS inhibition, we restricted the time of treatment of control and silenced cultures with MG132 to 6 h, which did not affect the viability of the cells as assessed using a cytotoxicity assay based on propidium iodide staining. Cell samples were collected after modulation of synaptic transmission and UPS activity (Fig. 8A), and total protein levels were analyzed by quantitative immunoblotting (Fig. 8B,C).

Effect of proteasome inhibition on expression of synaptic scaffolds in normal active and silenced cultures. A, Timing of treatments for all experimental groups. Neurons were harvested at DIV 23, activity blockers were added for the last 48 h, and proteasome inhibitor MG132 was added 6 h before harvesting. B, Representative immunoblots of analyzed proteins for all treatments. C, Quantification of expression levels for all treatments. The numerical OD values were normalized to mean values of control. D, MG132-induced changes in expression levels normalized to levels under the same activity condition with non-manipulated proteasome activity. In both plots the bars represent means of six to nine analyzed sets of values (numbers indicated in C) obtained in one of three experiments performed, all yielding comparable results. Whiskers indicate SEM. The statistical significance was assessed using a t test comparing MG132-treated and nontreated samples for each activity level in C and using one-way ANOVA with Bonferroni post hoc test in D. *p < 0.05, §p < 0.01, #p < 0.001.
The treatment resulted in an increase of total cellular levels for cytomatrix-associated proteins Bassoon, ELKS/CAST, Munc13-1, RIM, and synapsin in control and silenced cultures. The levels of the postsynaptic protein Homer and the SNARE protein syntaxin6 also were increased independently of the activity status of the cells. Liprin-α was not changed in the control situation, but MG132 treatment significantly interfered with the degradation of this protein in silenced neurons. No significant changes were observed for tubulin, syntaxin1, or SV2B upon MG132 treatment. Accordingly, we conclude that the UPS regulates levels of cellular proteins in a highly specific manner, and it is influenced by the activity status of neuronal networks.
Quantification of absolute changes in protein levels was not informative to judge the effect of activity depletion on UPS-dependent degradation, because the total protein levels were differentially regulated by network activity. Therefore, we normalized the MG132-induced changes in protein levels to the total amounts of the particular protein under the same activity condition without MG132 treatment. This analysis revealed that the activity deprivation influenced the degree of UPS-dependent degradation of cytomatrix proteins in a highly specific manner (Fig. 8D). Whereas the relative MG132 treatment-induced increase of ELKS/CAST, RIM, and Munc13-1 did not significantly differ between both conditions, MG132 treatment had a significant impact on the relative expression levels of Bassoon and liprin-α upon activity silencing; i.e., UPS-dependent degradation of these proteins was boosted by activity blockade. Thus, the observed silencing-induced decrease of cellular levels of Bassoon and liprin-α is likely due to increased UPS-dependent degradation of these proteins upon activity blockade. In contrast, the decreased expression levels of ELKS/CAST, Munc13-1, and RIM are obviously not achieved by their enhanced degradation but by alternative means such as regulation of transcription or translation (or alternative degradation pathways).
Considering the involvement of the UPS in regulating the expression of some scaffolding proteins upon activity silencing, we wondered whether blockade of the UPS interferes with activity silencing-induced homeostatic presynaptic functional adaptation. Therefore, we induced homeostatic plasticity by silencing of synaptic circuits for 2 d and blocked UPS by adding 10 μm MG132 6 h before electrophysiological measurements (Fig. 8A). The proteasome block had no effect on mEPSC amplitudes in active networks; however, it led to a significant elevation of amplitude sizes in silenced neurons (Fig. 2G–J). Inter-event intervals of mEPSCs were significantly decreased upon MG132 treatment in active control networks, but were not further reduced in cultures after prolonged activity silencing (Fig. 2C,D,K,L). It is generally assumed that mEPSC amplitudes are regulated by changes in properties of postsynaptic receptor apparatus, whereas changes in mEPSC frequencies are attributed to alterations of the presynaptic Pr. Our data suggest that the UPS regulates presynaptic and postsynaptic function differentially, depending on the activity status of the neuronal networks.
Discussion
Modulation of global network activity shapes the strength of synaptic transmission by altering both presynaptic and postsynaptic properties (Pozo and Goda, 2010). While such changes have been characterized at the physiological level, the molecular mechanisms underlying these homeostatic adaptations are not fully understood. Therefore, we have explored, here, how modulation of global network activity affects the molecular composition of the presynaptic neurotransmitter release apparatus. Prolonged silencing of excitatory synaptic and network activity achieved by treatment with d-AP5 and CNQX caused a profound downregulation of cellular expression levels of the presynaptic scaffold proteins Bassoon, ELKS/CAST, Munc13, RIM, liprin-α, and synapsin. In good agreement with previous reports (Ehlers, 2003), the levels of PSD proteins PSD-95, Homer, and AKAP 150 were reduced in a similar way. At the same time, SV proteins including synaptophysin, synaptotagmin1, or SV2B, the SNARE proteins syntaxin1 and syntaxin6, and the neuronal cytoskeletal protein βIII-tubulin were not significantly changed. This indicates that, primarily, scaffolding by the presynaptic cytomatrix seems to be subject to homeostatic regulation.
The changed expression levels of synaptic scaffolding proteins might reflect alterations of either the density or the protein composition of synapses, or both. Silencing-induced alterations of overall synapse numbers in cortical cultures were addressed previously. However, the outcome was inconclusive as a decrease (Minerbi et al., 2009), an increase (Wierenga et al., 2006; Han and Stevens, 2009), or no changes (O'Brien et al., 1998) in synapse density upon activity deprivation were reported. In our experimental setting, neither the absolute number of functional SV clusters labeled by depolarization-induced uptake of anti-synaptotagin1 antibody or visualized by staining with various antibodies directed against SV membrane proteins, nor the degree of alignment of presynaptic and postsynaptic elements were affected by activity silencing. One explanation for the contradiction with some published results (Wierenga et al., 2006; Han and Stevens, 2009; Minerbi et al., 2009) might be that synaptic markers were used for quantifications (vGlut1, GluR1, or PSD-95) that are strongly regulated upon activity silencing (O'Brien et al., 1998; Ehlers, 2003; De Gois et al., 2005). In our hands, while the number of functional synapses stayed the same, the number of puncta immunopositive for Bassoon, Piccolo, Munc13, RIM, ELKS/CAST, and synapsin decreased by ∼20–30%. We suggest that at synapses where no immunoreactivity was detectable after silencing, the levels of the respective proteins have dropped below the detection threshold. The fact that relative immunofluorescence intensities for Bassoon, Piccolo, Munc13, ELKS/CAST, and synapsin generally dropped at the level of individual synapses upon activity deprivation supports this view. Accordingly, we conclude that prolonged silencing does not change the number of synapses, but induces downregulation of cellular expression levels of presynaptic scaffolds, which is accompanied by their partial depletion from synaptic sites. Activity deprivation-induced regulation of RIM was surprisingly different from all other CAZ proteins analyzed. Its total cellular expression levels declined, and the number of RIM-positive puncta was reduced by approximately one third upon APV/CNQX treatment. However, the remaining puncta showed increased RIM levels, suggesting a remarkable redistribution of RIMs upon activity suppression.
Earlier studies have shown that silencing of global network activity induced an enlargement of active zones (AZs) and an increased number of docked vesicles, which was functionally reflected in an enlarged pool of readily releasable vesicles (RRPs) and an elevated Pr (Murthy et al., 2001). Here, we have shown that activity deprivation drives the depletion of scaffolds from the presynapse. Depletion of presynaptic cytomatrix proteins and a rise in AZ size might appear contradictory, when considering that presynaptic scaffolds merely act as building blocks for presynaptic specializations. We propose an alternative view better fitting our observations: proteins like Bassoon, Piccolo, ELKS/CAST, liprin-α, and synapsin, likely due to their ability to interact with numerous binding partners, might drive the formation of a compact proteinaceous cytomatrix beneath the presynaptic plasma and between SV, which in turn constrains the size of the mature presynaptic AZ and adjacent SV cluster. Consistently, loss of liprin in Caenorhabditis elegans and Drosophila, and Munc13-1/2 or Bassoon/Piccolo in mice, leads to an enlargement of AZ or PSD (Zhen and Jin, 1999; Kaufmann et al., 2002; Varoqueaux et al., 2002; Mukherjee et al., 2010).
Considering the role of RIM in modulation of Pr (Schoch et al., 2002; Kaeser et al., 2008), we hypothesized that RIM-enriched synapses represent the highly active synapses emerging upon network activity silencing. Indeed, we observed that the spontaneous synaptic activity visualized by anti-synaptotagmin1 antibody uptake correlated well with RIM levels in individual synapses in normally active and silenced cultures. Moreover, the relationship of RIM levels to spontaneous activity at individual synapses remained preserved in control and silenced neurons, suggesting interdependence of RIM levels and intrinsic presynaptic activity. These data strongly support a role for RIM in regulating presynaptic strength during homeostatic adaptation to activity silencing. Accordingly, Jiang et al. (2010) demonstrated the downregulation of RIM levels in persistently presynaptically silent synapses emerging upon prolonged tonic depolarization and that overexpression of RIM1 completely prevented induction of presynaptic silencing.
The molecular mechanism of how RIM regulates Pr is not fully understood. However, several molecular interactions of RIM are of special interest in this context. RIM was implicated in synaptic targeting of Munc13, the main priming factor (Betz et al., 2001). Surprisingly, synaptic Munc13 is reduced upon silencing, suggesting that RIM does not increase Pr solely by recruiting more synaptic Munc13. It was recently suggested that RIM activates vesicle priming by interfering with autoinhibitory homodimerization of Munc13 (Deng et al., 2011). This might be a plausible mechanism to explain our observation. RIM also binds synaptotagmin1, a main regulator of Pr (Fernández-Chacón et al., 2001). We found significantly increased levels of synaptic synaptotagmin1 without changing total expression levels upon activity silencing, arguing for inactivity-induced translocation of synaptotagmin1 from a nonsynaptic pool to synapses. Furthermore, RIM directly binds to auxiliary and pore-forming subunits of voltage-gated calcium channels (Coppola et al., 2001; Kiyonaka et al., 2007; Kaeser et al., 2011) and with RIM-binding protein, another interactor of calcium channels (Wang et al., 2000; Hibino et al., 2002). Through these multiple interactions, RIM is supposed to regulate inactivation properties of calcium channels and their anchoring relative to release sites, both parameters importantly influencing presynaptic strength. We observed an increase of Cav2.1 immunoreactivity in a range similar to that for RIM (172% vs 161% of control levels) upon activity silencing. This may point to a RIM-dependent synaptic enrichment of Cav2.1. Prolonged silencing also induced increase of synaptic SV2B, without changing its total expression levels. SV2s were suggested to enhance initial presynaptic Pr, by increasing the RRP after rest (Custer et al., 2006). Together the increase of RIM, Cav2.1, synaptotagmin1, and SV2B at synaptic sites points to potential molecular mechanisms increasing in presynaptic strength upon prolonged silencing of global network activity.
The observed drop of cellular levels of presynaptic scaffold proteins upon activity deprivation could be due to regulation of their synthesis rates at the transcriptional or the translational level or of their degradation, most likely via the UPS. Previous reports indicate that (1) the UPS is involved in regulating postsynaptic scaffold levels in homeostatic plasticity (Ehlers, 2003), and (2) presynaptic scaffolds such as RIM (Yao et al., 2007), Munc13 (Speese et al., 2003), and liprin-α (van Roessel et al., 2004) are targets of UPS-dependent degradation. Therefore, we tested the involvement of the UPS in the downregulation of presynaptic scaffolds upon activity silencing. In addition to RIM, Munc13, and liprin-α, we identified Bassoon, ELKS/CAST, synapsin, and syntaxin6 as new UPS targets. Intriguingly, the UPS-dependent degradation of Bassoon and liprin-α was enhanced upon activity silencing, whereas the degree of degradation of RIM and Munc13 was unchanged. This suggests that alternative cellular mechanisms such as transcription and/or translation are involved in the activity status-dependent homeostatic regulation of cellular levels of these proteins. Interestingly, in this context, Han and Stevens (2009) reported that transcription blockade interferes with the silencing-induced increases in mEPSC frequency and RRP. In line with the observation that the UPS seems not to be involved in the silencing-induced regulation of RIM, which might drive increase of Pr upon activity deprivation, we did not observe any further increase in mEPSC frequencies upon proteasome inhibition of silenced cultures. MG132 induced, however, a significant increase in mEPSC frequencies in control cultures. This fits well to a recent report by Rinetti and Schweizer (2010), who observed a severalfold increase in frequencies of miniature and spontaneous EPSCs and IPSCs without any changes in amplitudes within minutes after MG132 application. Also, in our experiments, proteasome blockade did not influence the mEPSC amplitudes in spontaneously active control neurons, but led to significant elevation of amplitudes in chronically silenced cultures. This is consistent with a UPS-dependent regulation of the postsynaptic protein machinery by global activity.
Taking the electrophysiological data together, the UPS seems to differentially contribute to the functional remodeling of the presynaptic and postsynaptic compartments upon prolonged activity deprivation. Moreover, our biochemical data show that UPS-dependent degradation is controlled by the activity status and contributes to remodeling of synaptic protein complexes in a highly substrate-specific manner. The target specificity of UPS-dependent degradation is ascribed to the high selectivity of ubiquitin-ligating enzyme complexes for their targets (Hegde, 2010). Therefore, we suggest that the regulated ubiquitin conjugation to presynaptic scaffolds might control their differential activity status-dependent degradation by UPS observed in our experiments.
Footnotes
This work was supported by Deutsche Forschungsgemeinschaft (Grants SFB779/B9 and GRK 1167 to E.D.G., and Grant HE 3604/2-1 to M.H.) and the European Community (HEALTH-2007-22918, REPLACES) and the European Regional Development Fund and the Land Saxony-Anhalt (EFRE/LSA 2007–2013) to E.D.G. We thank Heidi Wickborn, Sabine Opitz, and Janina Juhle for their excellent technical assistance, Renato Frischknecht and Stefano Romorini for valuable discussions, and Yulia Klyueva and Arthur Bikbaev for sharing unpublished data.
The authors declare that there is no conflict of interest regarding the submitted manuscript.
- Correspondence should be addressed to Anna Fejtova, Department of Neurochemistry and Molecular Biology, Leibniz Institute for Neurobiology, D-39118 Magdeburg, Germany. afejtova{at}ifn-magdeburg.de


