

Abstract
Spontaneous activity in the developing brain contributes to its maturation, but how this activity is coordinated between distinct cortical regions and whether it might reflect developing sensory circuits is not well understood. Here, we address this question by imaging the spread and synchronization of cortical activity using voltage-sensitive dyes (VSDs) in the developing rat in vivo. In postnatal day 4–6 rats (n = 10), we collected spontaneous changes in VSD signal that reflect underlying membrane potential changes over a large craniotomy (50 mm2) that encompassed both the sensory and motor cortices of both hemispheres. Bursts of depolarization that occurred approximately once every 12 s were preceded by spontaneous twitches of the hindlimbs and/or tail. The close association with peripheral movements suggests that these bursts may represent a slow component of spindle bursts, a prominent form of activity in the developing somatosensory cortex. Twitch-associated cortical activity was synchronized between subregions of somatosensory cortex, which reflected the synchronized twitching of the limbs and tail. This activity also spread asymmetrically, toward the midline of the brain. We found that the spatial and temporal structure of such spontaneous cortical bursts closely matched that of sensory-evoked activity elicited via direct stimulation of the periphery. These data suggest that spontaneous cortical activity provides a recurring template of functional cortical circuits within the developing cortex and could contribute to the maturation of integrative connections between sensory and motor cortices.
Introduction
Early neural activity, combined with genetically determined molecular factors, shapes the connections of the developing mammalian nervous system (Katz and Shatz, 1996; Tessier-Lavigne and Goodman, 1996; Ben-Ari and Spitzer, 2010; Hanganu-Opatz, 2010). Distinct patterns of neural activity are found in different neural systems (Yvert et al., 2004; Crépel et al., 2007; Tritsch et al., 2007; Watt et al., 2009), and, in some cases, the function of these patterns has been determined (Torborg and Feller, 2005; Huberman, 2007; Wu et al., 2010). Distinct patterns of neural activity are present within the developing mammalian cortex as well (Garaschuk et al., 2000; Adelsberger et al., 2005; Dupont et al., 2006; Yang et al., 2009; Colonnese and Khazipov, 2010; Seelke and Blumberg, 2010; Minlebaev et al., 2011). Understanding these patterns is crucial because they may provide a template for future task-related activity by controlling axon growth and synaptogenesis (Allene and Cossart, 2010). The best studied pattern in vivo, the spindle burst, is a 300–600 ms event comprising a fast 5–20 Hz burst often associated with a slower ∼3 Hz oscillation (Khazipov et al., 2004). It generally follows a peripheral sensory event, such as a retinal wave or a spontaneous muscle twitch, suggesting a role in the development of functional sensory cortices (Hanganu et al., 2006; Khazipov and Luhmann, 2006; Minlebaev et al., 2007).
Whether such activity could contribute to the maturation of long-range connections present in the adult brain (Wallace et al., 2004; Ferezou et al., 2007; Frostig et al., 2008; Desai et al., 2011) is not known. The majority of research has examined its properties within a single sensory domain, either somatosensory (Milh, 2007; Marcano-Reik and Blumberg, 2008; Yang et al., 2009; Colonnese and Khazipov, 2010; Minlebaev et al., 2011) or visual (Hanganu et al., 2006; Colonnese and Khazipov, 2010), and it is generally described as local and immobile (Yang et al., 2009). Nevertheless, dynamic spindle bursts have been reported (Khazipov et al., 2004, their supplemental figures), and they are synchronized between hemispheres (Yang et al., 2009). In this study, we directly study the dynamic properties of cortical activity in early life using voltage-sensitive dye (VSD) imaging to provides high spatiotemporal resolution signals of cortical activity (Grinvald and Hildesheim, 2004; Chemla and Chavane, 2010) from large regions of the cortex of 4- to 6-d-old rats in vivo. Although high-frequency patterns were not well represented in the VSD signal, we found prominent bursts of lower-frequency activity in sensory cortices. Arising after spontaneous twitches in the tail and limbs, these bursts may represent the slow depolarizations that accompany some spindle bursts (Marcano-Reik and Blumberg, 2008). Sensory regions were synchronized by these twitch-induced bursts, and we found that they were dynamic, spreading toward the midline of the brain. This asymmetric spread may be involved in the maturation of connections with medial motor regions. Furthermore, this spread of activity within the sensory regions and into midline areas closely mirrored the activity produced by directly stimulating the periphery, suggesting that these spontaneous bursts provide a recurring template of functional sensory circuits to the cortex.
Materials and Methods
Animals and surgical preparation.
The University of British Columbia Animal Care Committee approved all procedures involved in this study. Working with male Wistar rat pups (P4–P6), we induced anesthesia using 1–1.5% isoflurane in oxygen and maintained body temperature at 37°C using a heating pad. After locally anesthetizing the scalp with lidocaine, we made a single 7 × 7 mm craniotomy over both hemispheres. The location of this craniotomy varied but always included hindlimb and tail primary somatosensory cortex (S1). We then attached a custom-made head plate to the skull using dental cement. This head plate included internal channels for circulating hot water that kept temperatures near the surface of the cortex near 37°C.
Cortical EEG recording.
To monitor EEG activity throughout the experiment, Teflon-coated chlorided silver wires (0.125 mm) was placed on the edge of the craniotomy window. A reference electrode was placed on the nasal bone. The cortical signal was amplified and filtered (0–1000 Hz) using a differential alternating current amplifier (DAM 50 model; World Precision Instruments).
VSD imaging.
We next removed the dura from the exposed brain surface and applied the dye RH1692 (Optical Imaging) (Shoham et al., 1999) dissolved in HEPES-buffered saline. After 90–120 min of incubation, we removed the dye, washed the cortex with HEPES-buffered saline, applied 1.5% agarose, and then sealed the viewing area with a glass coverslip. Before moving the animal to our imaging setup, we decreased the isoflurane to 0.25%. We maintained anesthesia between 0.25 and 0.5% throughout imaging, adjusting the level as needed to minimize whole-body movements. Using the attached head plate, we fixed the skull under a macroscope (front-to-front video lens) coupled to a 1M60 Pantera camera (Dalsa) and excited the VSD dye using red-light-emitting diodes (Luxeon K2, 627 nm) and fluorescence filters as described previously (Mohajerani et al., 2010). VSD emission fluorescence was filtered using a 673–703 nm bandpass (Semrock) filter. A second identical camera was fixed behind the animal to capture images of limb and tail movements, illuminated by infrared LEDs. We collected 12-bit images at 6.67 ms time resolution (150 Hz) using an EPIX E1DB frame grabber with XCAP 3.1 imaging software (EPIX). When collecting evoked cortical activity, we stimulated the limbs and tail with a 10 ms deflection of ∼200 μm, exerting ∼0.8 N of force delivered by a custom-built piezoelectric device (Q220-A4-203YB; Piezo Systems) attached to 0.7-mm-diameter pencil lead (Pentel of America). We collected images of VSD signal changes for 200 ms before and 520 ms after stimulation. When collecting spontaneous cortical activity associated with limb or tail twitches, we collected synchronized images from both cameras for 33.3 s at a time. To reduce potential VSD signal distortion caused by the presence of large cortical blood vessels, we focused into the cortex to a depth of ∼1 mm.
VSD signal analysis.
When calculating the VSD response evoked by stimulation of the limbs and tail, we averaged images collected from 10–20 trials. To correct for time-dependent changes in VSD signals that accompany all imaging, we also collected a number of nonstimulation trials that were used for normalization of stimulated data. (Harrison et al., 2009). To calculate the VSD signals during spontaneous brain activity, we first filtered the signals with a zero-phase Chebyshev bandpass (0.1–10 Hz) using custom scripts written in MATLAB (MathWorks). This removed slow time-dependent decreases in light fluorescence. To isolate the dynamic component of the fluorescence signal corresponding to membrane potential changes, we calculated the average fluorescence over all frames, F0, and subtracted this from the overall fluorescence signal F: (F − F0)/F0 × 100. To reduce spatial noise, we filtered images using a Gaussian kernel with a 1-pixel SD in NIH ImageJ (National Institutes of Health). For images of cortical VSD signal presented in figures, we removed noise by performing principal component analysis using custom MATLAB scripts and discarding components other than the first 40 main components.
To determine the position of bursts on the cortex, we visually detected the onset and offset of bursts. Within this visually detected range, the exact timing of burst onset was determined using custom-written MATLAB scripts that thresholded each image at its 60th percentile. While the area above this threshold was >0.2 mm2, we classified it as a burst. To calculate the instantaneous spatial correlation between cortical activity and somatosensory circuits, we first created a template of sensory activity by taking the mean image of cortical activity over the 40 ms after cortical activation via stimulating the limbs or tail. We then removed the nonsignal mask region for this image and each image of spontaneous activity. Last, we calculated the correlation between the template and each individual frame of activity.
Video analysis.
To determine the timing of movements of the limbs and tails, we detected changes in the light level from 325 × 325 μm regions over the hindlimbs and tail. Using custom-written MATLAB scripts, we filtered this signal between 1 and 20 Hz, took the absolute value, and then detected instances in which this signal crossed a threshold of four times the SD of the background activity. This process was partially automated but relied on supervision, including reference to the original videos to exclude large whole-body movements and to determine the exact timing of small movements.
Statistical analyses.
Results are presented as means ± SE, unless otherwise specified. We used t tests and ANOVA tests to test for differences between and among means, as described. We transformed correlation values using Fisher's z-transformation before statistical tests. All analyses are performed on data collected from 10 pups.
Results
In this study, we used VSD imaging to record membrane potential changes over large sections of the developing rat cortex in vivo. Our experimental setup, along with an image of the cortical region from which we recorded VSD signals, is shown in Figure 1A. Changes in these signals reflect changes in the membrane potential within each pixel (65 × 65 μm). All signals presented were collected under light anesthetic (0.25–0.5% isoflurane). For simplicity, we use the terminology “the VSD signal” throughout Results, Discussion, and figure legends to refer to “the percentage change from baseline of the VSD signal.”

VSD imaging provides high-resolution images of large region of the developing rat cortex. In this and all subsequent figures, 10 animals were used for group data analysis unless otherwise indicated. A, Diagram showing experimental setup. Panels to the right show simultaneously collected video of cortex and body. B, Montages of VSD images after cutaneous stimulation of limbs and tail. White dot is bregma. A, Anterior; L, left; P, posterior; R, right. C, EEGs recorded simultaneously with left hindlimb stimulation shown in B. VSD signal from HLS1,R is also shown. D, Map showing region of cortex activated by stimulating tail (green), right hind (red), and left hind (blue) relative to bregma (black circle). Open circles show geometric mean of activated cortex. Position of EEG electrode used for signals in C is shown. E, VSD signals evoked by stimulation of right hindlimb (right) and tail (left). In this and subsequent figures, light shaded region denotes SE.
Spatial and temporal differences cortical responses after limb and tail stimulation
To determine the precise location of sensory regions corresponding to the limbs and tail in the developing cortex, we stimulated the hindlimbs and tail and recorded the subsequent cortical activity. This also allowed us to examine the spatial and temporal properties of cortical sensory processing at young ages. In adult rodents, imaging tools have shown subthreshold activity to spread over large regions of the cortex after such stimulation (Wallace et al., 2004; Ferezou et al., 2007; Frostig et al., 2008; Desai et al., 2011; Mohajerani et al., 2011), but the extent to which this exists during development is not known. Images showing patterns of activity after limb and tail stimulation are shown in Figure 1B, and an example of the association between the VSD signal and EEG signal is shown in Figure 1C. We found pronounced differences between the cortical activity that followed limb stimulation and tail stimulation. The most prominent difference was that responses to limb stimulation were dominated by responses in the contralateral cortex, whereas responses to tail stimulation were bilateral, as is visible in Figure 1, B and E. This is consistent with recent studies showing that limb (Marcano-Reik and Blumberg, 2008) and whisker (Quairiaux, 2011) responses are primarily unilateral in early development. Throughout this study, we refer to the area of cortex activated by stimulating the left and right hindlimbs HLS1,R and HLS1,L respectively. Similarly, we refer to the regions activated by stimulating the tail as TLS1,R and TLS1,L. These cortical regions are shown in Figure 1D. We used the center of these regions (calculated in each animal) to collect a temporal signal of S1 cortical activation after stimulation, as show in Figure 1E. After limb stimulation, we found a robust contralateral, but weak ipsilateral, activation; the mean ratio of the peak VSD signal in the contralateral cortex to the peak VSD in the ipsilateral cortex was 3.6 ± 0.31, and a paired two-tailed t test of the peak signal intensity confirmed this difference (p = 1.8 × 10⁻⁹). In contrast, stimulation of the tail yielded approximately equal responses in both hemispheres; the ratio of peak VSD signal on the left hemisphere to that on the right was 0.92 ± 0.12, and a two-tailed paired t test of the responses from the two hemispheres did not meet the threshold for significance (p = 0.42).
In addition to differences in the spatial properties of cortical activation, temporal properties differed between tail and limb stimulation as well. The mean time for the VSD signal to increase beyond 4 SDs above background activity after stimulation of the right hindlimb was 88 ± 1.1 and 92 ± 0.61 ms after left hindlimb stimulation (data not shown). After tail stimulation, the VSD signal increased more slowly, taking 123 ± 2 ms to increase beyond 4 SDs above background on the right hemisphere and 121 ± 1.2 ms on the left. A two-way ANOVA test performed on these values showed a significant difference between the time to activate between limbs and tail (p = 5.0 × 10⁻⁹) but no effect of hemisphere (p = 0.87).
To more precisely examine the spread of activity on the cortex after stimulation, we collected VSD signals from a 2 mm square around the earliest point of activation and examined the dynamics of activity within this restricted area (Fig. 2A). Before being analyzed, images after right hindlimb stimulation were flipped on a medial–lateral axis so that medial and lateral directions became consistent between the two hemispheres. A prominent feature of the pattern of activity was an asymmetrical spread of VSD signal increases over time after stimulation. This can be noted in the line graphs in Figure 2A, which show a cross-section of mean activity spread on a medial–lateral axis (black line) and anterior–posterior axis (gray line). To quantify this difference, we calculated the mean of the activity at eight locations relative to the point of maximal activation, at three different times after stimulation (Figure 2A, locations are shown in rightmost image of the top panel, as colored squares, all 0.975 mm from the point of maximal activation). As shown in Figure 2B, 100 ms after stimulation of the limbs, there was no significant difference among the VSD signal at the eight points (one-way ANOVA, p =0.22). By 180 ms after stimulation, a pronounced effect of location on the size of the VSD signal was apparent (one-way ANOVA, p = 1.9 × 10⁻⁶). The largest difference along a single axis was along the lateral–medial axis, with mean VSD signal at the lateral point equal to 0.05 ± 0.01% ΔF/F compared with 0.13 ± 0.01% ΔF/F at the medial point. This difference was found to be significant using Tukey's HSD test. The difference among the VSD signals at the examined points persisted 300 ms after stimulation (one-way ANOVA, p = 1.6 × 10⁻⁵), with the difference between the lateral point (0.05 ± 0.01% ΔF/F) and the medial point (0.17 ± 0.01% ΔF/F) again found to be significant. We performed an identical analysis of VSD signals after tail stimulation, except using slightly later time points to account for the slower activation of the tail cortex after stimulation (see above). These results are shown in Figure 2C. The effect of cortical location on the VSD signals did not meet the threshold for significance for any of the time points examined (one-way ANOVA, 133 ms after simulation, p = 0.12; 213 ms after simulation, p = 0.37; 333 ms after stimulation, p = 0.078).

Activity spreads asymmetrically after hindlimb stimulation. A, Mean images after right and left hindlimb stimulation. Images after left hindlimb stimulation has been flipped on medial–lateral axis. Top, Mean images showing VSD signal. Bottom, Intensity along a medial–lateral (black) and anterior–posterior (gray) axis through the point of initial activation (as shown by the solid line, first box, top). B, Left, VSD signal intensity at eight spatial points 0.975 mm from the point of initial activation, at three time points, after stimulation. Spatial points are shown and labeled in the rightmost image of the top of A. L-M, Lateral–medial axis; P-A, posterior–anterior axis; PM-AL, posterior–medial to anterior–lateral axis; AM-ML, anterior–medial to posterior–lateral axis. C, As described for B, except after tail stimulation. In this and subsequent figures, *p < 0.05.
Spontaneous limb and tail twitches stimulate dynamic bursts of cortical activity in the absence of external stimulation
Given its high temporal and spatial resolution, VSD imaging holds promise for gaining insight into the structure of spontaneous activity in the developing cortex. The value of these high-resolution images can be seen in Figure 3A. Here, VSD signals from individual subregions of the somatosensory cortex, identified via sensory-evoked responses as described in Figure 1, are shown, allowing a detailed examination of the interactions between movements in the periphery and the patterns of activity on the cortex. The top panel shows VSD signals recorded from three regions of S1, whereas signals of limb movements extracted from video are shown in the middle panel. To quantify the extent to which activation of developing sensorimotor circuits contributed to the overall cortical activity, we calculated the instantaneous spatial correlation between ongoing cortical activity and a template of sensorimotor activation, created from the mean VSD activity pattern evoked by stimulating the limbs and tail. This process is described in more detail in Materials and Methods. The instantaneous spatial correlation is shown in the bottom panel of Figure 3A. Figure 3B shows montages of images of brain activity at 100 ms intervals from regions highlighted in gray in Figure 3A. Note that bursts in a particular region are accompanied by an increase in the correlation with that sensory template.

Bursts of VSD signal in sensory cortex lead to correlation with the overall cortical pattern evoked by stimulating the limbs/tail. A, VSD signal (top), limb movement (middle), and concurrent correlation of instantaneous cortical activation pattern with pattern evoked by limb/tail stimulation (bottom). B, Montages showing cortical activity every 100 ms in shaded gray regions highlighted in A.
Although there was a clear relationship between limb twitches and cortical bursts, it was not a one-to-one relationship. Figure 4A shows a sequence of VSD signals, limb twitches, and ongoing sensory template correlation in which there is mix of cortical bursts that follow twitches in the associated limb and bursts that do not follow twitches. To quantify the contribution of twitches to bursts of cortical activity, we examined the relationship between spontaneous twitches and bursts of VSD signal in corresponding subregions of S1 more closely. For a particular burst of VSD signal in a subregion of S1, we examined whether it was preceded by a twitch in its corresponding limb (e.g., was a burst in HLS1,R preceded by a twitch in the left hindlimb) and, similarly, whether a twitch was followed by a burst in the corresponding subregion of S1. Figure 4B combines results across animals and across subregions of S1 by showing the probability of a twitch being followed by a burst in the corresponding region of S1 (left panel) or a burst being preceded by a corresponding twitch (right panel) as a function of time.

Cortical bursts and twitches have a variable relationship. A, VSD signal (top), limb movement (middle), and concurrent correlation of instantaneous cortical activation pattern with pattern evoked by limb/tail stimulation (bottom). Note that bursts may or may not be preceded by a twitch in the corresponding limb. B, Left, Probability density function of a limb twitch being followed by a burst in the corresponding subregion of S1, across time points relative to the twitch. Right, Probability density function of a burst of VSD signal in S1 being preceded by a twitch in the corresponding limb, across time points relative to the burst. C, Probability of a peak of VSD signal in a subregion of S1 being preceded by a corresponding limb twitch (y-axis), across correlation with appropriate sensory template at the time of the VSD peak (x-axis). Because of the small numbers of correlation values above 0.6 and below 0, we binned these values together.
As the example VSD signals in Figures 3 and 4 show, bursts of cortical activity can be isolated in a single cortical region, driving a high correlation with a single sensory template, or can occur in multiple regions, resulting in moderate correlations with multiple templates. To explore whether high correlation bursts were more likely to arise from twitches in the associated limb, we binned bursts by their correlation with the appropriate sensory template. For example, the image of brain activity at the time of a burst of VSD signal in HLS1,R was correlated with the template of sensory activation generated by stimulating the left hindlimb. This burst was binned with others of similar correlation values, and the presence or absence of a twitch in the left hindlimb preceding the burst was used in the calculation of the probability that bursts of this correlation bin were preceded by a twitch, as shown in Figure 4C. A one-way ANOVA revealed a strong effect of correlation with sensory template on the likelihood of being preceded by a twitch (p = 1.2 × 10⁻⁸). The likelihood ranged from 28 ± 6% for bursts that had a correlation coefficient with their corresponding sensory template in the range of 0 to 0.1, to 79 ± 5% for those that had a correlation coefficient with their corresponding sensory template above 0.6.
Synchronized spontaneous limb twitches contribute to correlated activity
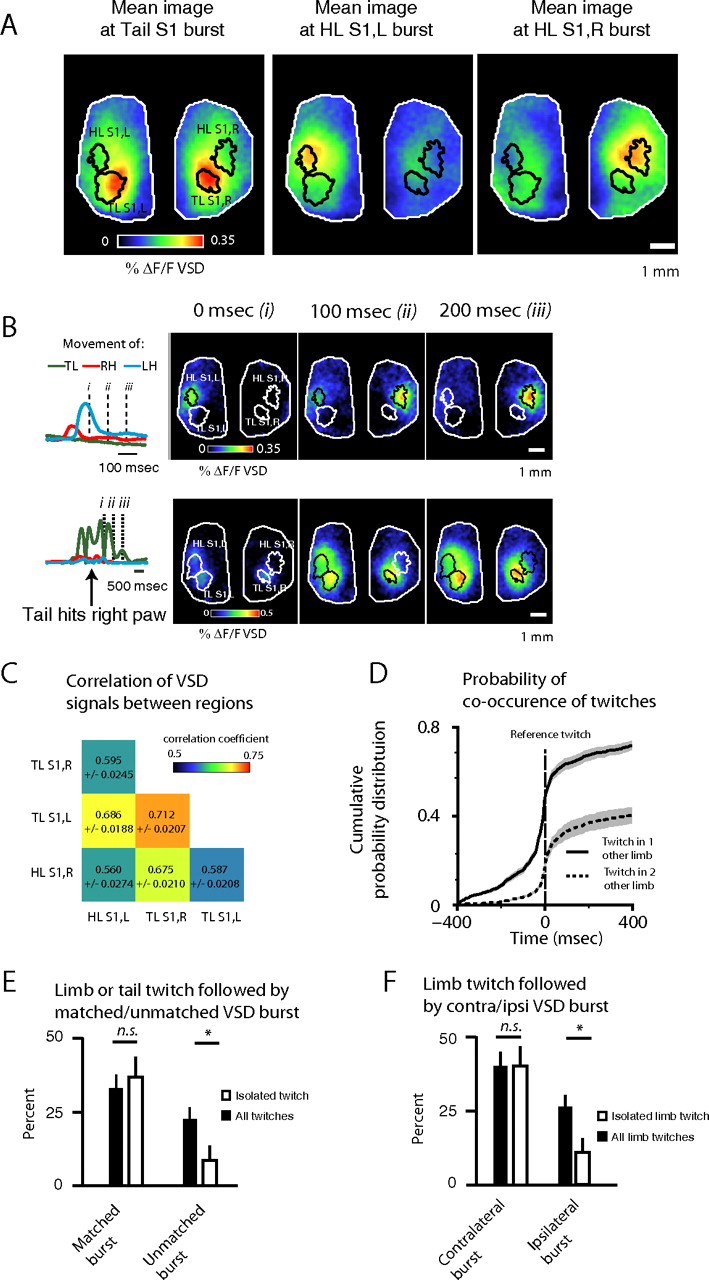
Spindle bursts can synchronize activity between hemispheres, potentially assisting the development of homotopic connections in the cortex (Marcano-Reik and Blumberg, 2008; Yang et al., 2009). We took advantage of the large imaging area of our preparation to examine such interactions between hemispheres, as well as within hemispheres, for the slow activations reported by VSD. Figure 5A shows mean images of VSD signal from one rat pup at the time of all bursts in a given region of S1. An obvious feature is the presence of activity in both hemispheres, even when the mean image is calculated based on bursts in the hindlimb region, which is unilateral when evoked via stimulation (Fig. 1B,E). To quantify this feature across all animals, we calculated the correlation between the VSD signals from subregions of S1 as shown in Figure 5C. A one-way ANOVA revealed significant differences among these correlations (p = 0.002), with the highest correlation being between tail S1,L and tail S1,R. This is not surprising given that these two regions respond bilaterally to sensory input to the tail. As a control, we calculated the correlation between the VSD signal in the tail S1,L and the tail S1,R offset by 3 s. The mean of this correlation across pups was −0.13, and a paired t test comparing it with the correlations between the non-lagged signals showed a highly significant result (p = 3.6 × 10⁻⁸), making it unlikely that any rhythmic movement artifacts (heartbeat, respiration) contributed to the described correlations.

Changes in VSD signal are correlated across sensory regions. A, Images from one animal show the mean image of cortical activation for peaks of VSD signal in TLS1, HLS1,L, and HLS1,R. respectively. B, Interactions between limbs contribute to correlated VSD signals in sensory cortices. Montages show cortical activity after limb twitch, shown at right of montages. Dotted lines show time of images within montage. Top, Right and left hindlimb twitch in sequence. Bottom, Tail twitches and strikes left hindlimb. C, Matrix showing correlation of VSD signals between subregions of S1. D, Probability density function of one or two additional twitches across time points relative to a given twitch. E, Likelihood of a twitch being followed by a matched or unmatched burst, for all twitches (left) versus isolated twitches (right). F, Likelihood of a limb twitch being followed by a contralateral or ipsilateral bursts, for all bursts (left) versus isolated bursts (right).
Interactions between the peripheral limbs are one source of these correlations. Figure 5B shows two examples of twitches interacting to produce synchronized activity on the brain. In the top panel, the right and left hindlimbs twitch sequentially and generate sequential bursts in HLS1,L and HLS1,R. In the bottom panel, a tail twitch causes the tail to strike the right hindpaw, causing bursts bilaterally in TLS1 and HLS1,L. The potential for interactions among twitching limbs is high, because we found that 71 ± 1.9% of twitches were accompanied by a twitch in at least one additional limb or tail within 800 ms, and 40 ± 3.6% were accompanied by twitches in both additional limb/tail in the same time period. Figure 5D shows the cumulative probability distribution for these concurrent twitches over time. To quantify the contribution that synchronization of twitches made to the coincidence of cortical bursts of activity, we calculated the likelihood that a twitch would be followed by a burst in its associated region of cortex (e.g., left twitch followed by burst in HLS1,R, termed matched), as well as in a non-associated region of sensory cortex (unmatched) (Fig. 5E). We found that 34 ± 4.3% of twitches were followed by a matched burst and 24 ± 3.8% were followed by an unmatched twitch. When we restricted this calculation to twitches that were isolated from any other twitch by 500 ms, the proportion of twitches that were followed by a matched burst was 38 ± 6.7%, which was not significantly different from the non-isolated twitches (paired two-tailed t test, p = 0.41). The proportion of twitches followed by an unmatched burst, however, fell to 9.9 ± 4.9%, which was significantly lower than the same value for the non-isolated bursts (paired two-tailed t test, p = 8.2 × 10⁻⁵). To allow direct comparisons to previous studies that examined the incidence of spindle bursts after hindlimb twitches (without examining tail movements) (Marcano-Reik and Blumberg, 2008), we also examined the incidence of ipsilateral and contralateral bursts after limb twitches (Fig. 5F). After any limb twitch, the likelihood of a burst in the contralateral hindlimb sensory cortex was 40 ± 4.8 and 28 ± 4.0% in the ipsilateral cortex. After isolated limb twitches, the likelihood of a burst in the contralateral hindlimb cortex was unchanged at 40 ± 6.7% (paired two-tailed t test, p = 0.99), whereas the likelihood of a burst in the ipsilateral cortex fell to 11 ± 4.8% (paired two-tailed t test, p = 1.2 × 10⁻⁵). Thus, although signals of cortical activity are correlated among the sensory regions we examined, there is a large decrease in the incidence of bursts in unmatched regions of the cortex when examining isolated twitches. This supports the conclusion that synchronized twitching is a contributor to the correlation of VSD signals in different regions of S1.
Cortical bursts after limb twitches spread toward the midline of the brain
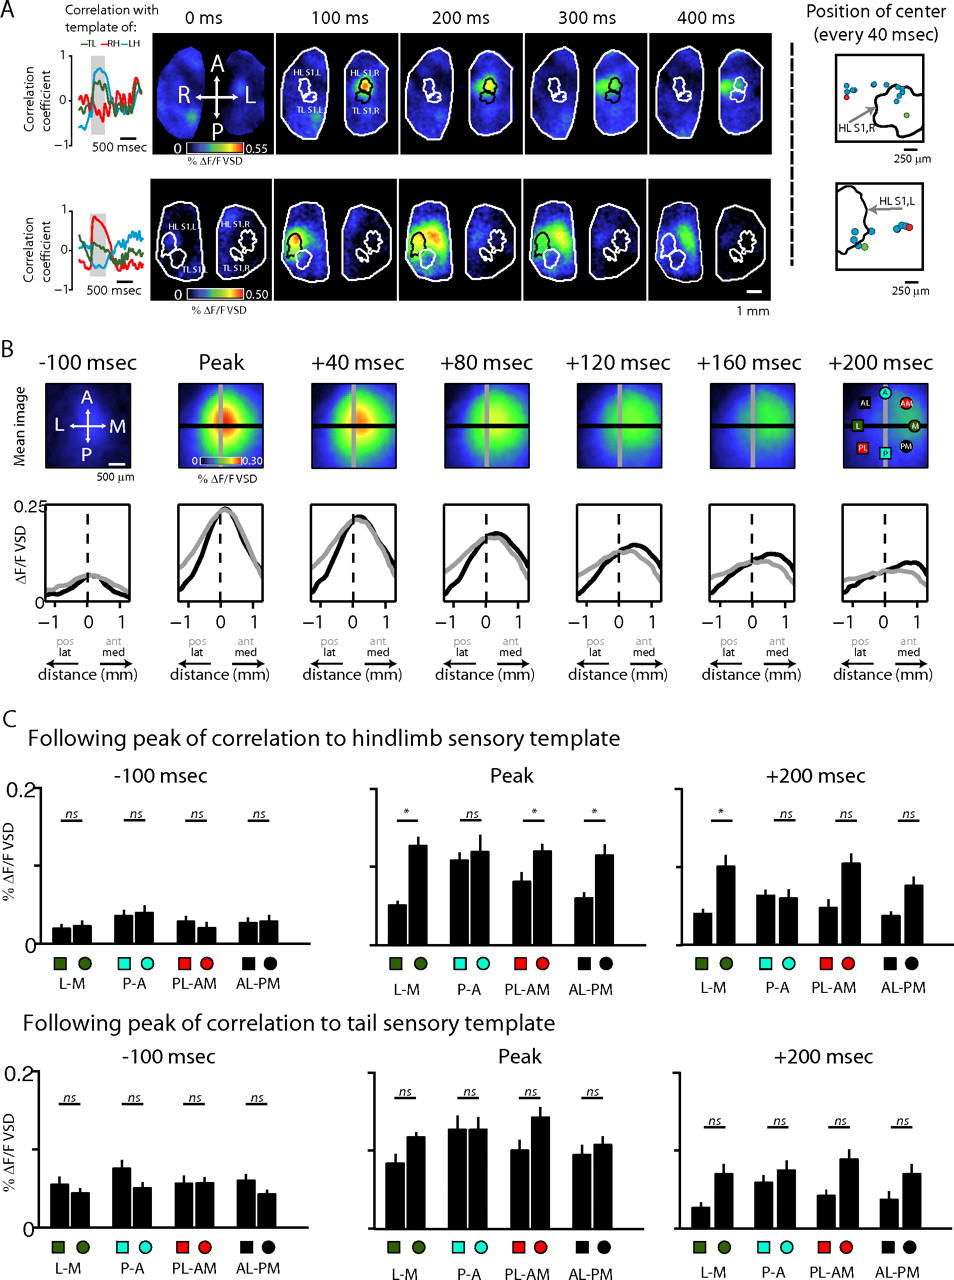
Having shown similarities between the spatial patterns of cortical activity that follow stimulation of the limbs and those that follow limb twitches, we next examined the dynamic nature of spontaneous cortical activity. For example, the bursts in Figure 3B show a medial, asymmetrical spread. Figure 6A shows two additional bursts from two pups that are dynamic, moving in both cases from S1 medially toward the midline. The correlation of ongoing activity with the three sensory templates is shown to the left of the montages in Figure 6A, with the time spanned by the montage shown with gray background. To examine the burst spread across all animals, we performed an analysis similar to that described in Figure 2, except that, rather than using bursts after stimulation of the limbs, we used all bursts during spontaneous activity for which the correlation with the corresponding sensory template exceeded 0.3. This threshold ensured that we were examining bursts in which there was a relatively strong and isolated activation in the sensory cortex. In the top panel of Figure 6A, for example, the brain image at the time of a burst in HLS1,R was highly correlated with the sensory template corresponding to such a burst, that of the left hindlimb; in the bottom panel, the brain image at the time of a burst in HLS1,L was highly correlated with its corresponding template, that of the right hindlimb. Figure 6C shows that, 100 ms before the peak of the burst, there was no significant difference among the VSD signal at the eight cortical points (one-way ANOVA, p = 0.46). At the peak of the burst, there was a significant difference among these points (one-way ANOVA, p = 1.8 × 10⁻⁷). The largest difference, as with the bursts after stimulation of the limbs, was between points on the medial–lateral axis. Mean VSD signal at the lateral point was 0.052 ± 0.0082% ΔF/F compared with 0.14 ± 0.016% ΔF/F at the medial point. Tukey's HSD test showed that VSD points on all axes except the anterior–posterior axis were significantly different. Two hundred milliseconds after the peak of the busts, there remained a strong effect of location on the VSD signal (one-way ANOVA, p = 2.5 × 10⁻⁵), and points on the medial–lateral axis remained significantly different from each other. The bottom panel of Figure 6C shows the similar analysis for bursts of the tail cortex. As with the bursts after tail stimulation (Fig. 2), the effect of cortical location on the VSD signals was not significant at any of the time points examined (one-way ANOVA, 100 ms before peak, p = 0.37; at peak, p = 0.54; 200 ms after peak, p = 0.25).

Cortical activation of sensory regions spreads medially. A, Montages show examples of cortical activity at time of HLS1,R (top) and a HLS1,L activation (bottom). At the left of the montages, ongoing correlation with sensory templates is shown. Gray region denotes times represented in montages. Panels at the right of the montages show instantaneous position of center of burst at 40 ms intervals; green dot denotes position at burst onset, and red dot denotes position at burst end. B, Top, mean images showing VSD signal before, during, and after bursts of VSD activity that were correlated with their corresponding sensory templates. Bursts were included if they had a correlation above 0.3 with their corresponding sensory template. Bottom, VSD signal along a medial–lateral (black) and an anterior–posterior (gray) axis through the center of the sensory cortex. Lines representing these axes are shown in top panels. C, Top, VSD signal intensity at eight spatial points 0.975 mm from the point of initial activation, at three time points, after stimulation. Spatial points are shown in the rightmost image, top panel, of Figure 6A. L-M, Lateral–medial axis; P-A, posterior–anterior axis; PM-AL, posterior–medial to anterior–lateral axis; AM-ML, anterior–medial to posterior–lateral axis. Bottom, as described for the top, expect for bursts correlated with tail template. A, Anterior; L, lateral; P, posterior; M, medial.
More evidence that limb movement triggered bursts of activity in S1 spread medially is shown in Figure 7. Here, we calculated the correlation between signals of limb movement and the VSD signal from different regions of the cortex, delayed relative to each other by varying amounts. Figure 7A shows an example of this calculation. In this example, a sequence of VSD images collected under light anesthesia is shown at the left. The VSD signal collected from a single pixel at the center of the overlaid black box is shown at the right, delayed 200 ms relative to the movement signal of the left hindlimb, shown directly below it. The value of the correlation between these two signals was put back into the same pixel. Repeating this process for each pixel, we generated a map showing the degree to which each part of the cortex was correlated to the movement trace. Figure 7B shows examples from one pup showing the correlation maps described in Figure 7A for the movement traces of the left hindlimb, the right hindlimb, and the tail. As a control, a correlation map for VSD signals delayed 2 s relative to the right hind movement trace is also shown in Figure 7B. Highly correlated pixels are clustered within and medial to S1, except in the control image, which shows very low correlation. Figure 7C shows these results combined across animals and across subregions of S1.We calculated the correlation of activity in each region of S1 with the movement trace of the corresponding limb (e.g., VSD signal from HLS1,R with the left hindlimb movement trace) at a spectrum of delays, to represent the extent to which cortical activity and limb movements were related. To determine how this relation varied in regions surrounding S1, we collected the same value medially, laterally, anteriorly, and posteriorly to the subregion of S1. Figure 7C shows the means of these correlations across delays of the VSD signal relative to the movement signal. As shown in the left panel of Figure 7D, the delay yielding the maximal correlation was highest at the most medial position relative to S1 (243 ± 4.9 ms compared with 200 ± 6.9 ms at the center of S1), and the delay was strongly influenced by the position medial or lateral to the center of the associated sensory cortex (one-way ANOVA, p = 1.2 × 10⁻⁴) but not by the position anterior or posterior to the sensory cortex (one-way ANOVA, p = 0.83). This was consistent with a spread of activity toward the midline. The right panel of Figure 7D shows the value of the correlation. It was highest in S1 (0.32 ± 0.019) and decreased symmetrically in surrounding directions.

Limb twitches initiate dynamic activity across the cortex. A, Example VSD signals correlated with movement signals from one hindlimb. The correlation between the delayed VSD signal at each pixel and the movement signal was calculated and used to generate a map showing the correlation of VSD signals from each region with the limb movement signal (sequence of VSD images shown at left, VSD and limb movements shown in middle, final map of all correlation values shown at right). B, Example images from one pup showing the correlation value of each pixel with limb movement signals. Note the peak of correlation in, and medial to, the associated sensory cortex; note no correlation in the control (2 s delay) image. C, Correlation values between VSD signals and limb movements at points relative to sensory cortex across time delays. Time of maximal correlation is shown by vertical line in matching color. Note close cluster of times, except for medial region of cortex (red). Control signal offset by 2 s. D, Top panels show delay giving maximal correlation across medial–lateral axis (left) and anterior–posterior axis (right). Colors match C. Bottom panels show maximal value of correlation across same axes. Med, Medial; Lat, lateral; Pos, posterior; Ant, anterior; Cont, control.
Although we focused our analysis on bursts of VSD signal in S1 and their association with peripheral spontaneous twitches, to align with previous research in these areas, we also examined the VSD signal from other regions of the cortex. A prominent difference is that bursts of VSD signal outside of S1 are not associated with twitches. Two examples of such bursts are shown in Figure 8A. In both cases, there was no associated twitches. To compare the spatial layout of bursts associated with a twitch with those that were not associated with a twitch, we calculated the relative frequency of bursts after a twitch (within 300 ms), or not associated with a twitch, and presented these results as a color-mapped image of relative frequency for each point on the cortex, as shown in Figure 8B. Right and left hemispheres were aligned independently to the center of HLS,1 and TLS,1 from one pup are shown for reference. Note that those bursts that followed a twitch are concentrated within S1, whereas those that did are located in areas surrounding S1. A notable limitation is that we did not collect twitches of the forelimbs; thus, activity in the forelimb S1 cortex (lateral and anterior to the hindlimb S1) should not be assumed to be independent of twitches of the forelimb. To quantify this difference across all animals, we calculated the correlation coefficient between the mean image of each burst not associated with a twitch and all three (right hind, left hind, and tail) sensory templates. We took the maximum of these three values as the spatial correlation of this burst with a sensory pattern. We compared this value with the correlation between the mean image of brain activity after an isolated limb or tail twitch and the corresponding sensory template as well as their non-corresponding sensory templates [e.g., the correlation between a VSD burst after a tail twitch and the tail sensory template (matched) as well as the left and right hindlimb sensory templates (unmatched)]. The means of these three sets of correlations are shown in Figure 8C. As is subjectively apparent in Figure 8B, the spatial pattern of bursts associated with a twitch is significantly closer to bursts evoked by direct stimulation than the spatial pattern of bursts that do not follow a twitch. Correlation for a burst after a twitch was 0.36 ± 0.04 with its matched sensory template and 0.034 ± 0.05 with its unmatched template. The maximum correlation between a burst that did not follow a twitch and all three sensory templates was 0.13 ± 0.04. These values differed significantly (one-way ANOVA, p = 1.3 × 10⁻⁸). Combined with the results shown in Figures 3⇑⇑–6, we conclude that, although slow cortical activity in S1 is closely associated with peripheral twitches, activity in nonsensory areas exists independent of twitches in the peripheral limbs.

Bursts in the absence of twitches may occur in non-somatosensory regions of cortex. A, Montages show two examples of bursts not associated with twitches in any limbs. B, Maps showing relative frequency of activation of cortex for bursts following within 300 ms (left), or not following (right), a twitch. We calculated the mean image of each burst and aligned all bursts across animals on the center of HLS1. Each pixel is colored to represent the relative number of bursts that overlapped it. Note the different scale bars in the two images. C, Correlation between mean VSD image after a twitch and the corresponding sensory template (Twitch, matched), compared with the same value for bursts that do not follow a twitch (No twitch). Because there is no corresponding sensory template with which to calculate the correlation value, it was calculated with all three templates, and the maximum of the three was considered the correlation with a sensory template. For comparison, correlation between brain activity after a twitch and two non-corresponding sensory templates are also shown (Twitch, unmatched).
Discussion
In this study, we recorded cortical activity using VSDs during the early postnatal period, P4–P6. We used the high-resolution recordings provided by this technique to gain greater insight into the structure of cortical activity at a time of rapid cortical maturation via synaptic formation and dendritic growth (Ben-Ari, 2001; Tau and Peterson, 2010).
Comparison with other studies of developmental cortical activity
The study of correlated neural activity in developing mammalian cortex is currently characterized by a variety of patterns, described in a range of preparations, including cortical slices (Garaschuk et al., 2000; Corlew et al., 2004; Sun and Luhmann, 2007; Allene and Cossart, 2010) and the in vivo intact brain (Khazipov et al., 2004; Adelsberger et al., 2005; Marcano-Reik and Blumberg, 2008; Golshani et al., 2009; Seelke and Blumberg, 2010; Minlebaev et al., 2011). Most relevant to our results are patterns of activity described in vivo. Most prominent of these is the spindle burst, an event lasting 200–600 ms and consisting of a burst of 10–25 Hz oscillations found in the somatosensory (Khazipov et al., 2004; Minlebaev et al., 2007) and visual (Hanganu et al., 2006) cortices. Oscillations in the gamma range of frequencies (30–40 Hz) also exist every 10–30 s (Yang et al., 2009; Seelke and Blumberg, 2010), whereas long (40 s) bursts of 20–30 Hz activity repeat every 20–30 min (Yang et al., 2009). Bursts of gamma-range activity have also been described recently in the developing barrel cortex, under control of excitatory thalamic synapses (Minlebaev et al., 2011). Finally, two recent studies report slow (>0.1 Hz) oscillations in the developing sensory cortices (Colonnese and Khazipov, 2010; Seelke and Blumberg, 2010).
The activity we describe using VSD is most closely related to spindle bursts. Like spindle bursts, this activity follows limb twitches (Fig. 3), can be evoked by direct stimulation of the limbs (Fig. 1), is primarily located in the sensorimotor cortex (Fig. 8), and occurs approximately every 10 s. Furthermore, spindle bursts can exist on top of slower depolarizations in the frequency range that we examine here (0.1–10 Hz) (Marcano-Reik and Blumberg, 2008; Minlebaev, 2009). Simultaneous recordings of VSD signals and local field potentials in the sensorimotor cortex would be necessary to confirm a relationship between the signals we observe and previously described spindle bursts.
Functional role of movement-generated cortical activity
The purpose of movement-related cortical activity is difficult to test directly, but its properties are consistent with a role in refining homotopic maps within the somatosensory cortex (for review, see Khazipov and Luhmann, 2006; Blumberg, 2010). The results presented here support and extend this hypothesis. By comparing the pattern of activity evoked across the cortex after twitches and direct stimulation of the limbs, we show that twitches robustly activate the ascending fibers arriving at the cortex. There was a much higher correlation between the activity pattern evoked by the stimulation of the twitched limb than the activity pattern evoked by other limbs (Fig. 8C), indicating that the activity is confined to the appropriate portions of the somatosensory cortex, which is consistent with previous reports (Khazipov et al., 2004). However, when we examined the entire VSD signal, as opposed to only those portions after isolated twitches, we found correlations between sensory regions across the span of our recordings (Fig. 5B). In part, this lack of specificity arises because isolated twitches are not common (Fig. 5D). Figure 5C shows examples of interacting twitches. This is in contrast to Marcano-Reik and Blumberg (2008), who reported that spindle bursts did not overlap in opposing hemispheres. However, they showed that fast and slow component of spindle bursts arise from different forms of sensory input; tactile inputs give rise to the fast, whereas proprioceptive inputs give rise to the slow component. Furthermore, their preparation minimized tactile inputs during spontaneous twitches by keeping the limbs suspending away from any surface. In our preparation, the limbs were free to interact with each other and the supporting surface as they twitched. Thus, the activity we report may reflect tactile inputs from a complex interaction of the limbs moving under natural conditions.
Medial spread of cortical bursts
One key difference between the activity that we describe and previous descriptions of developmental cortical activity is that the activity we describe has a prominently asymmetrical spread (Figs. 2, 6, 7). Spindle bursts, in contrast, are generally described as locally confined and immobile (Khazipov et al., 2004; Yang et al., 2009). We believe that an important difference between the current study and the previous description of spindle bursts is that we have focused our analysis on activity well represented in the VSD signal, in the 0.1–10 Hz range. This corresponds to the slow envelope component of some spindle bursts (Marcano-Reik and Blumberg, 2008; Minlebaev, 2009). Yang et al. (2009) and Khazipov et al. (2004), in contrast, examined spread of the fast component of spindle bursts, examining signals that had been bandpass filtered with 5 Hz as the low cutoff. Nevertheless, the faster component has been noted to travel (Khazipov et al., 2004, their supplemental Fig. 3, which shows the fast component of a spindle burst moving medially over ∼2 mm). Similarly, Marcano-Reik and Blumberg (2008) found that inactivation of the forelimb somatosensory cortex does not eliminate the occurrence of spindle bursts in that region, which the authors interpreted as evidence for a contribution traveling from neighboring tissue. It is possible that a dynamic, traveling nature may be a minor feature of the fast component, but a major component of the slow component, of spindle bursts.
A traveling component to movement-related activity would be consistent with activity in many developing neural systems (Calderon et al., 2005; Firth et al., 2005; Watt et al., 2009). In sensory areas, they promote homotopic connections by synchronizing cortical regions receiving afferent inputs from adjacent sensory organs (Feller, 1999). In the adult rodent, close anatomical connections exist between the somatosensory and motor cortices (Donoghue and Parham, 1983; Fabri and Burton, 1991), and the motor cortex is rapidly altered by sensory input (Donoghue and Sanes, 1987; Sanes et al., 1990, 1992). Depolarization from the somatosensory cortex that moves medially within the developing cortex may serve to promote the maturation of these anatomical and functional connections. In this way, spontaneous twitches could promote appropriate connections within the cortex in a manner analogous to how they have been shown to do so at the level of spinal reflexes (Holmberg and Schouenborg, 1996; Petersson et al., 2003; Schouenborg, 2004). Interestingly, the tail representation of the motor cortex is small and indistinct in the rodent (Gioanni and Lamarche, 1985; Tennant et al., 2011), and we found that bursts in the tail sensory cortices, after either stimulation (Fig. 2) or twitching (Fig. 6), did not spread medially to the same extent as those in the hindlimb cortices.
Traveling waves of cortical activity have been described in the adult rodent cortex using VSD imaging (Wu, 1999; Berger, 2007; Han, 2008; Mohajerani et al., 2010). Although these waves are different from the activity we describe in that they reflect continuous, ongoing, internally generated cortical activity that does not emerge until approximately P12 (Seelke, 2008; Colonnese, 2012), they are similar to the waves we describe in that they are highly localized and bilaterally synchronized (Mohajerani, 2010) and may reflect a template of sensory experiences (Han, 2008).
Use of VSD to study developmental activity
VSDs have proven useful in the study of cortical dynamics across large regions in the mammalian cortex (Tsodyks et al., 1999; Ferezou et al., 2006, 2007; Xu et al., 2007; Huang et al., 2010; Mohajerani et al., 2010), as well as patterns of activity in slices of developing rat hippocampus (Bolea et al., 2006) and localized responses in the developing mouse sensory cortex (Borgdorff et al., 2007) but to our knowledge, this is the first time they have been applied to the study of bilateral developmental activity in the intact in vivo brain. Despite being an additional technique with the potential to provide another set of descriptions of cortical activity during development, we believe that VSD imaging can add to our understanding of this topic. It provides high-resolution signals that reflect membrane potential changes from the intact brain, an important consideration because cortical connections, which are disrupted by slicing, have been found to be essential to some forms of activity in the developing brain (Sun and Luhmann, 2007). It permits the collection of activity from large regions of the cortex, including multiple sensory regions (Figs. 3, 4) as well as regions outside of the sensory cortices (Fig. 8), in which our knowledge of activity patterns is limited (Seelke and Blumberg, 2010). Notable weaknesses of VSD imaging include a limited contribution to the signal from deep layers of cortex (Berger, 2007; Chemla and Chavane, 2010; Mohajerani et al., 2010), particularly relevant because synaptic inputs to superficial layers 2/3 are weak during early life (Stern, 2001; Bureau, 2004). This weakness contributes to the more complex EEG signal compared with the VSD signal (Fig. 1C) (Devonshire, 2010). It is also worth noting that VSD signals can reflect subthreshold, dendritic depolarization (Grinvald and Hildesheim, 2004; Chemla and Chavane, 2010) making direct comparisons to patterns of calcium waves attributable to spiking (Schwartz, 1998; Garaschuk et al., 2000; Adelsberger et al., 2005) difficult (Berger, 2007). Nevertheless, it has been suggested recently that the diverse patterns of developmental activity previously reported are in fact all manifestations of spindle bursts under different experimental conditions (Khazipov and Buzaki, 2010), and in vivo VSD imaging may provide important clues to resolve this issue.
Footnotes
This work was supported by Canadian Institutes of Health Research (CIHR) Operating Grant MOP-12675 and a Human Frontier Science Program grant (T.H.M.), a CIHR Vanier Award and a predoctoral fellowship from the Michael Smith Foundation for Health Research (D.A.M.), and a postdoctoral fellowship from the Michael Smith Foundation for Health Research, the Heart and Stroke Foundation of Canada, and a postdoctoral fellowship from CIHR Focus on Stroke (M.H.M.). We thank Cindy Jiang and Pumin Wang for surgical assistance and Jeff Ledue for optics.
- Correspondence should be addressed to Timothy H. Murphy, 4N1-2255 Wesbrook Mall, Vancouver, BC, Canada, V6T 1Z3. thmurphy{at}mail.ubc.ca


