

Abstract
The competitive processes that result in elimination/pruning of developing synapses are incompletely understood. Serial electron microscopy was used to image postnatal mouse neuromuscular junctions where elimination is well studied and events at every synaptic contact can be examined. Glial or Schwann cells (SCs) are shown to have two activities during elimination: their processes separate nerve terminals from each other and from the muscle fiber; they contact the plaque of acetylcholine receptors, apposing this surface as closely as the nerve, limiting the area where synaptic transmission occurs. SCs phagocytose nerve terminals contacting the muscle fiber. This phagocytosis involves all axons; SCs are not selecting the winner but rather driving turnover. Previous modeling of stochastic turnover and reoccupation of nerve contacts shows that single innervation of synaptic sites can result. Thus, our study shows roles of SCs in neuromuscular development beyond the previous demonstration of consumption of synaptic inputs after their elimination.
Introduction
The formation of circuits in the nervous system relies not only on synapse formation but also on turnover, a process termed “synapse elimination.” Such elimination has been most extensively studied in the case of the rodent neuromuscular junction (NMJ). Each motor neuron initially overconnects with the fibers in the muscle to which it projects (Brown et al., 1976). Each muscle fiber is innervated by multiple motor neurons within the single acetylcholine receptor (AChR) plaque near the center of each fiber. Then, during the first 2 postnatal weeks, all but one of these inputs is lost from each fiber. Compelling evidence that the motor neurons compete with each other for occupancy of each plaque has come from vital imaging (Walsh and Lichtman, 2003): as each axon withdraws from contact with the synapse, another expands to fill the vacated space. Laser ablation of one of two remaining axons results in the rapid expansion of the unablated axon into the territory of the ablated axon (Turney and Lichtman, 2012).
The substrate for the competition is most commonly proposed as the plaque of AChRs on each muscle fiber. Each plaque, oval in shape, becomes remodeled into a “pretzel” during elimination (Marques et al., 2000; Slater, 1982). If a toxin (α-bungarotoxin [α-BTX]) that blocks AChRs is puffed onto discrete portions of the receptor site, effectively silencing these portions of the synapse (Balice-Gordon and Lichtman, 1994), the blocked receptors and the overlying nerve terminal are lost, provided neuromuscular transmission continues through the remainder of the synapse. Thus, differential synaptic efficacy could drive input elimination and postsynaptic remodeling.
Glia, called terminal Schwann cells (tSCs), are present at the neonatal junction (Brill et al., 2011) but have not been considered to play a direct role in the competition. However, SCs do play a major role in the destruction of the losing axons once they are eliminated from the muscle surface (Bishop et al., 2004). As losing axons withdraw from the synapse, forming so-called retraction bulbs (Riley, 1977), tSCs phagocytose pieces of them (i.e., “axosomes”) (Bishop et al., 2004). tSCs also are important for the maintenance of axon terminals as their ablation in frog tadpoles reduces the growth of NMJs (Reddy et al., 2003). SC deletion in mice (Wolpowitz et al., 2000) results in loss of muscle innervation and motor neuron death. Interestingly, microglia in the CNS have been recently proposed to play a role in the postnatal elimination of retinal ganglion cell inputs to the lateral geniculate nucleus (Schafer et al., 2012) as well as synapse elimination in the hippocampus (Paolicelli et al., 2011).
We have reconstructed serial electron micrographs (EMs) of NMJs in the sternomastoid muscle of neonatal mice. These micrographs reveal that tSCs promote the turnover of motor neuron synaptic contacts by phagocytosis and by direct competition for the receptive surface of the muscle. Together, our data suggest that tSCs promote postnatal synapse elimination without selecting the winner of the competition.
Materials and Methods
Animals.
Wild-type C57B/6 mice of either sex, obtained from The Jackson Laboratory and bred in a colony at the University of Texas, were killed on postnatal day 3 (P3), P16, or P38-P40 by intraperitoneal injection of Euthasol (Virbac Animal Health). P0 was taken as the day of birth. Experimental procedures were approved by the University of Texas Institutional Animal Care and Use Committee.
Electron microscopy and reconstruction.
Animals were perfused transcardially with 0.1 m sodium cacodylate buffer, pH 7.4, followed by the same buffer containing 2% PFA and 3% glutaraldehyde. Sternomastoid muscles were removed and fixed overnight at room temperature in the same fixative. Muscles were washed with cacodylate buffer and stained en bloc in 1% osmium tetroxide, 1% ferrocyanide in cacodylate buffer for 5 h, washed with water, and then stained in 1% aqueous uranyl acetate for 2 h. Muscles were dehydrated in graded alcohols and acetone, then embedded in Epon 812. Regions containing neuromuscular junctions were located by thick (0.5–1 μm) sections made on a Leica Ultracut UTC Ultramicrotome with glass knives, stained with 1% toluidine blue, and examined under a light microscope. Blocks were further trimmed using a 45 degree cryotrim tool (Diatome) and serial 65 nm (silver) sections cut with a 35 degree diamond knife (Diatome). Sections were mounted on formvar-coated Synaptek slot grids (Electron Microscopy Sciences) and observed under a FEI Technai Spirit electron microscope with an AMT Advantage HR digital camera. NMJs were identified by the apposition of nerve terminals to within ∼50 nm of the muscle fiber surface in the presence of SCs. Digital images of individual NMJs and the immediately surrounding area were captured from each section at a magnification of 16,500. At this magnification, ∼6–12 overlapping images were acquired to include the entire extent of the NMJ. These individual images were then montaged by manual manipulation in Adobe Photoshop to create a single image. Such montaged images over 70–150 serial sections were then imported into the software program Reconstruct (Fiala, 2005), calibrating the pixel dimensions in the images to known distances in the specimen. In software, the montage in each section was aligned linearly to each adjacent montage using 6–8 objects common in both and starting with the central montage in the stack and working toward each the first and last montage. Once aligned, structures of interest in each section were segmented (traced) using the tools provided in the software. Measurements and 3D renderings of these structures were then generated in software.
In total, we made extensive serial sections from a total of 8 NMJs at P3, 2 at P16, and 4 at P40. One P3 muscle provided all 8 NMJs, although two other animals were used to provide 40 semiserial or nonserial sections to confirm the observations made in the serial sections. Of the 8 serially sectioned P3 junctions, 1 (NMJ1) has been completely reconstructed for all parameters reported here, 5 (NMJs 2, 3, 4, 7, and 8) have been completely reconstructed, except that their SCs were not individually identified, and 2 have been partially reconstructed (NMJs 5 and 6). Two animals were used for the serially sectioned P16 muscles; an additional 2 short serials and 10 nonserial sections were made. At P40, 3 animals were used and the four NMJs had between 54 and 231 sections, and approximately a dozen individual sections were made.
Fluorescence microscopy.
Fluorescent labeling of NMJs was performed as described previously (Hayworth et al., 2006, Kang et al., 2007, Lee et al., 2011). Briefly, C57B/6 mice carrying an S100-GFP transgene (to fluorescently label SCs) were anesthetized as described above and transcardially perfused with PBS, pH 7.4. Sternomastoid muscles were dissected and fixed with 4% PFA, pH 7.4, then blocked and permeabilized with a blocking solution (0.2% BSA-fraction 5, 0.3% Triton X-100, 0.1% NaN3). Presynaptic nerve terminals were labeled with a mouse anti-neurofilament antibody (2H3; Developmental Studies Hybridoma Bank) and an antibody against a vesicular protein: SV2 (Developmental Studies Hybridoma Bank) or synaptophysin (Invitrogen). AChR-rich plaques were identified using a fluorochrome-conjugated α-BTX (Invitrogen). The acquisition of confocal fluorescence images of neuromuscular junctions was performed on a Leica TCS SP5 upright microscope using Leica LAS AF image acquisition software with a 63× oil-immersion objective with a NA of 1.4. Maximum intensity projections and orthogonal slices of image stacks were generated using ImageJ. The presence of tSC somata not in contact with the postsynaptic surface and the curvature of the postsynaptic muscle fiber prevented an accurate measurement of tSC apposition to the AChR-rich portion of muscle membrane through en face views. In attempt to improve our ability to resolve this apposition, we made orthogonal, virtual sections in both the XZ and YZ planes through confocal z stacks near the center of the synapse. Portions of AChR-rich membrane apposed by tSCs and their processes and the lengths of tSC process that overshoot the postsynaptic surface were measured using iVision software (BioVision Technologies) and computed as a percentage of length of the AChR-positive membrane and found to be 98.1 ± 0.4% and 4.5 ± 0.5%, respectively. A total of 46 NMJs from 5 pups were examined in this fashion.
A fluorescent label for acidic organelles (LysoTraker Red DND-99; L-7528, Invitrogen) was used to confirm the presence of and quantify degradative bodies/organelles at developing and mature NMJs, a method described previously (Song et al., 2008). Briefly, S100-GFP transgenic mice were killed as described above and perfused transcardially with oxygenated-Ringer's solution (Oxy-Ringer's). Sternomastoid muscles were dissected and pinned in a Sylgard dish in Oxy-Ringer's. Muscles were then bathed, in the dark, in Oxy-Ringer's solution with LysoTracker-Red (1 μm) for a total of 30 min, replacing the solution every 4 min to maintain oxygenation. After LysoTracker-Red staining, muscles were washed in Oxy-Ringer's 3 times for a total of 15 min. The muscles were fixed in 4% PFA, pH 7.4, and prepared for immunofluorescence as described above.
Numerical data are reported as mean ± SE.
Results
Motor neurons make bouton-like contacts within the receptor plaque at each NMJ at P3
Serial, ultrathin cross-sections were made through eight NMJs in sternomastoid muscles at P3. The EMs of these serial sections were aligned using computer software. Structures of interest were outlined or “segmented” in each section (Fig. 1A,B), and 3D surface renderings of these segmented structures were constructed in software (Fig. 1C,D). Seven of these NMJs were completely reconstructed for these segmented structures. The first structures segmented were axons that touched the muscle surface (compare colored fills of axons in Fig. 1A,B). Axons were identified by the presence of synaptic vesicles, neurofilaments, and the lighter color of the axoplasm compared with surrounding cells (particularly SCs and their processes; see Fig. 3). Each terminal bouton could be followed through the sections to its axon of origin. On the basis of multiple processes entering them, all 7 of the extensively segmented junctions were polyneuronally innervated (Fig. 1C) by 3–7 axons. These axons wove around each other, had 8.4 ± 1.5 branchpoints (3 junctions, 12 axons), and touched the muscle fiber surface with bouton-like structures, coming within 48 ± 0.7 nm of the muscle fiber surface. At many of these sites, there were accumulations of synaptic vesicles facing the muscle fiber, but in very few cases was there obvious active zone material (see Fig. 3). The postsynaptic membrane lacked junctional folds. These observations are in agreement with prior results of Tapia et al. (2012), who used similar reconstructions to show that fibers in the mouse are polyneuronally innervated at this early stage of postnatal life. Indeed, this previous study shows that the level of polyneuronal innervation we observe at P3 is decreased from what was present earlier at P0, suggesting that significant synapse elimination has already occurred by P3 in this muscle (Tapia et al., 2012). The observations of poorly differentiated presynaptic structures and an absence of significant postsynaptic differentiation agree with previous descriptions of early rodent and rabbit NMJs (Kelly and Zacks, 1969; Korneliussen and Jansen, 1976; Riley, 1977; Teräväinen, 1968).

Several motor axons innervate sternomastoid NMJs at P3 and make bouton-like synaptic contacts over the surface of an oval AChR-rich plaque. A, Montage of individual micrographs spanning the entirety of the NMJ in a single thin section of a P3 mouse sternomastoid muscle fiber (NMJ-1). Nerve terminals (N) with synaptic vesicles come within ∼50 nm of the surface of the muscle fiber (M); there are no junctional folds at this stage of development. The nerves and terminals are associated with SCs, two of which have nuclei at edges of this montage. Vacancies (V) are present, some of which extend to the surface of the muscle. B, Segmentation of the muscle fiber surface, the terminals and axons, and SCs at this same NMJ. Red line represents the muscle fiber surface. Each of four separate axons, determined by their cytoplasmic continuity from section to section, was segmented and is filled with a different shade of blue. The places where the nerves come within 50 nm of the muscle surface interrupt the red line with a line the same color as the nerve terminal. Each of four SCs contacting these terminals was segmented and filled with a different shade of green. C, Surface rendering of a series of 139 sections of this same NMJ (location of above montages is indicated with an arrowhead). The axons retain the colors in B. D, Surface rendering as in C, but with the SCs added. Examined en face, the SCs appear to be a sheet over the junction. E, Confocal images in gray of each the AChR (with BTX), nerve (with antibodies against neurofilament and SV2, followed by a second antibody), and SCs (GFP expressed under the S100 promoter) in a P3 NMJ. Top, Maximum projections of each label. Bottom, XZ slice through the confocal stack at the position indicated by the white lines in the top in E. Arrowheads and the asterisks indicate points in the slice and the maximal projection. We conclude from this type of observation that, in the EMs, we can delineate the AChR plaque by the lateral extent of the SCs. Scale bars: B, 1 μm; E, 5 μm.
We also examined P3 NMJs by fluorescence microscopy to obtain information for comparison with the EMs. Presynaptic and postsynaptic structures were identified by a variety of fluorescent labels: α-BTX for AChRs, antibodies to neurofilaments, and the synaptic vesicle protein SV2 for axons and axon terminals, and transgenic expression of GFP in tSCs. These images show that the synapses and the axonal branches leading to them at P3 occur within an oval plaque of AChRs on each muscle fiber (see also Marques et al., 2000; Slater, 1982) (Fig. 1E). These receptor plaques occupied an average surface area of 179 μm2 and extended, on average, ∼20 μm along the length of the fiber and ∼12 μm across the fiber. There was, however, considerable variation; some of the junctions were as small as 60 μm2 and some as large as 300 μm2. The BTX staining was mostly contiguous and uniform. There were occasional small holes in most plaques (each <0.4 μm2 and in sum occupying <4% of total area), and a few had developed significantly larger “perforations,” such as described in later-stage junctions (Marques et al., 2000). The SCs, examined in confocal stacks to exclude cell bodies located a short distance above the fiber surface, showed a remarkable colocalization with the AChRs (Fig. 1E; quantification in Materials and Methods). SC processes appeared to cover almost the entire plaque. The tSC processes at P3 commonly extended to the edges of the AChR plaque; only occasionally did much smaller, short processes extend beyond this point (Fig. 1E). The axons appeared to contact much of the AChR-rich plaque (Fig. 1E), although, given the resolution of the light microscope, it is not possible to distinguish between actual terminals and the axons leading to them.
Thus, NMJs are polyneuronally innervated at P3, and this polyneuronal innervation is established within a receptor plaque whose outlines can be delineated by the lateral extent of SC processes. Although these observations are not particularly novel, they point out particular features that serve as a crucial foundation for the results that follow.
Nerve terminals at P3 contact only a fraction of the AChR plaque
Within software, we reconstructed the extent of each axon's close (∼48 nm) apposition to the muscle fiber (Fig. 2A,C). We arbitrarily call this area the nerve “footprint” on the surface of the muscle. We wanted to relate this footprint to the AChR-rich plaque. We could not do this directly because our EMs had no label for AChRs. However, the fluorescence micrographs clearly show that the axons contact the muscle within this plaque; moreover, the lateral edges of the SCs are coextensive with the edges of the plaque (Fig. 1E). Therefore, we are confident that we can identify the plaque in the EMs of P3 sternomastoid by the lateral extent of the SCs and their processes. We also know from the fluorescence micrographs that all but ∼4% of this area of the muscle membrane should contain a high density of AChRs. To assure we were assessing comparable areas both in the fluorescence and electron microscopy, we measured the extent of this EM-delineated plaque in each of five reconstructed junctions and found this area to be, on average, 123 μm2 (long axis, 12.9 ± 1.3 μm; short axis, 9.6 ± 0.2 μm), certainly within the range of 60–300 μm2 observed in fluorescence. Thus, despite the manner in which we began serial thin sectioning (within a few sections of the first sign of axon contact with the muscle surface), we reconstructed most of the NMJ contact in each case of these P3 junctions.

The nerve contact area within the AChR plaque is half that of the tSCs at P3. A, The “footprint” (i.e., surface rendering of the sites on the muscle where any nerve (blue, nerve footprint) or SC (green, SC footprint) approaches within 50 nm of the muscle surface at one NMJ (NMJ-2) at P3. Yellow areas represent vacancies (see also Movie 1). B, The average fraction of the AChR plaque (i.e., the total area of the muscle covered by SC, nerve, and vacancies) contacted by each nerve (blue), the SCs (green), or a vacancy (yellow) at 8 P3 NMJs. C, The footprints of individual axons at NMJ-1 and, below, the area of the footprint of each axon, retaining the blue shading in Figure 1. D, The footprints of the 4 SCs at NMJ-1 and, below the area of the footprint of the individual SCs, retaining the green shading in Figure 1.
For 7 NMJs at P3, the footprint of each axon, as well as the total footprint of all axons, was determined (Fig. 2B). Individual axons occupied from 0.5 to 20.4 μm2 on the surface of the muscle fiber and the total nerve contact areas at each NMJ were 12.3, 13.3, 18.8, 20.1, 23.6, 37.3, and 42.5 μm2 (average, 24.0 ± 4.4 μm2). This shows, comparing with the total plaque area estimated above, that, surprisingly, axon terminals contact <25% of the total area (Fig. 2B). The contacts are mostly small discontinuous areas on the muscle fiber surface (Figs. 1B and 2A,C). The axons leading to these terminals, if they had been viewed from above by fluorescence, would show a much more extensive terminal contact than actually occurs (compare the positions of terminal branches in Fig. 1C with the actual footprint in Fig. 2C; Movie 1). Thus, fluorescence images of the axons would overestimate the synaptic contact area.
Collectively, these observations show that the effective synaptic area at P3 is only a small portion of the oval receptor plaque on each multiply innervated fiber. Even if, as is presently thought, the competition during synapse elimination is for synaptic territory and the winning input in the competition occupies all the territory of its competitors, much remains unexplained. If all the contacts present at P3 become occupied by a single axon at the end of synapse elimination, the expected receptor pretzel with its contiguous gutters of receptors would not be the result (see, e.g., Fig. 2A,B). This suggests that, even as competition for territory occurs, there is a growth in synaptic contact area. However, the most intriguing result is that a considerable portion of what would be presumed to be the synapse from the receptor labeling is unoccupied by nerve at P3.
Several tSCs are present at P3 junctions, and each contacts several terminal boutons
Light microscopic examination of P3 NMJs using the transgenic labeling of SCs with GFP and AChRs with fluorescent α-BTX shows that there are an average of three tSCs present at each junction. As described above, these SCs extend to cover almost the entirety of the AChR plaque but very little beyond it. These observations are consistent with previous reports (Brill et al., 2011) but provide very little information on the exact relationships of the cellular elements here.
EM examination of 8 P3 NMJs revealed an average of 3.4 (range, 2–5) cell bodies located above the synaptic site. On the basis of their location and close contact with nerve, we identify these cells as SCs. In contrast to the cytoplasm of the axons and nerve terminals, these cells are more darkly stained and contain a prominent Golgi apparatus and endoplasmic reticulum (Fig. 3). Thus, by 3 d after birth, the innervation of the muscle is intimately associated with tSCs and their processes; it was rare to find any area of the nerve uncovered.

EMs of tSC phagocytosing a P3 nerve terminal. Select images from a serial set of EMs showing process of a single tSC (indicated by asterisk) and its relationship with a synaptic bouton in a P3 NMJ (NMJ-4). A, A finger of SC cytoplasm located inside the nerve terminal (black arrow). Note the two membranes. The finger extends 1800 nm into the terminal and bifurcates into two branches (shown in G below) but never emerges on the other side of the terminal. B, The site where the finger enters the nerve terminal. C, Near the base of the SC finger, a darker mass (yellow arrowhead) indicates the edge of a “phagocytic” vesicle that becomes visible in D. D, A phagocytic vesicle-containing cytoplasm of nerve terminal that is almost pinched off from the SC (double black arrowhead). E, The phagocytic vesicle in D is now completely surrounded by SC cytoplasm and appears to contain synaptic vesicles. The beginnings of a purported second phagocytic vesicle are located just to the left of this one (black arrowhead). F, The second vesicle first seen in E. This vesicle appears to contain mostly clear contents suggesting a further step in degradation. A–C, Adjacent 65 nm sections. C, D, Two sections apart. D, E, Three sections apart. E, F, Four sections apart. The serial sections for this portion of this junction are shown in Movie 2. G, Surface rendering of a small portion of this NMJ, showing one of the SCs (translucent green fill and marked with asterisk as in A), the muscle surface (red), the phagocytic vesicles (orange, marked with arrowheads as in panels above), and four axons present (1, 2, 3, 4, filled with color). The orange phagocytic vesicles derived from axon 3 are located next to the penetrating SC finger (black arrow). Scale bar: F, 500 nm.
Processes emerge from the somata of these cells and surround the individual axons as they enter the synaptic site and the small branches that lead to and between each synaptic bouton on the muscle surface. Each bouton is covered on its nonsynaptic surface (Figs. 1A,B and 3). The contacts between the nerves and SCs and between the SCs themselves are very close, most commonly on the order of 10–15 nm. This contrasts with the contacts between the nerve and muscle, described above, and the SCs and muscle, described below that are 3–4 times as wide. The processes of the SCs are very complex. The close apposition between processes, the fact that they fold back on themselves, and their sheer number make identifying the processes of individual cells difficult. As an illustration, we followed each of four contacts of a single SC onto the surface of the muscle back to the soma and found 8.2 ± 1.3 branch points along the way. Each tSC abutted the terminal boutons and axons of more than one motor neuron (Fig. 2D), as has been reported previously (Brill et al., 2011, Tapia et al., 2012), and there is little evidence of the segregation (“tiling”) of the processes of individual SCs present in the more mature junction (Brill et al., 2011).
tSCs make more extensive contact with the surface of the AChR plaque than the motor axons
In every EM section of the NMJ, we observed intimate contacts between the tSCs and the muscle fiber surface (Figs. 1A,B and 3). These SCs approached to within 49 ± 0.7 nm of the muscle surface, similar to the distance separating the early nerve terminal contacts from the muscle surface. Often this close apposition was maintained for a considerable distance, extending in some cases longer than 3.4 μm along the muscle fiber surface. The extent of this contact differs dramatically from EMs of adult NMJs where the SCs are seen to cap the nerve terminals and only contact the muscle fiber near the edges of the nerve terminals (Matthews-Bellinger and Salpeter, 1983; and see below). Although others have previously commented on these SC contacts with the muscle surface in neonates (Korneliussen and Jansen, 1976; Rosenthal and Taraskevich, 1977; Tapia et al., 2012) and even shown by autoradiography using radiolabeled BTX that they occur at sites containing AChRs (Matthews-Bellinger and Salpeter, 1983), no quantitative assessment of these contacts has yet been made. To evaluate the extent of these tSC contacts, we examined sets of aligned, serial EMs.
We reconstructed in software the area of the muscle fiber surface contacted by SCs (i.e., the “SC footprint”) (Fig. 2A,D). Surprisingly, we found that the tSCs contacted much more of the AChR-rich plaque (approximated as described above) than the nerve terminals (Fig. 2B). Indeed, almost all the space in the plaque not occupied by nerve was occupied by tSC contacts. Thus, the tSC footprint accounted for, on average, 57.0% of the plaque area (n = 8), in contrast to the nerve footprint, which accounted for 24.7% in P3 NMJs (Fig. 2B). There were some places where the tSCs were located at a larger distance from the muscle fiber surface, and this surface was unoccupied by nerve; these we termed “vacancies”; they accounted for 18.3% of the plaque area (Fig. 2) and are dealt with below. Each of the tSCs present at each NMJ made these contacts with the muscle surface (Fig. 2D), and there was no obvious pattern in the way these tSCs partitioned the plaque among themselves.
That tSCs are in such intimate contact with the areas on the muscle fiber surface containing dense AChRs and, as inferred from previous studies (Culican et al., 1998), with other synaptically enriched molecules associated with this plaque, suggests that nerves, to expand their contacts, must displace tSCs from their contacts or only occupy territory abandoned by other axons. This implies competition between the nerve and the tSCs for contact within the immature AChR plaque.
SCs extend fingers to intrude between the nerve and muscle at the edges of terminal boutons
Given the evidence above suggesting a competition between tSCs and nerve terminals for contact with the AChR plaque, we examined the interfaces between terminals and SCs. At ∼60% of the terminal boutons, we saw evidence of tSC fingers located between the nerve terminal and the muscle fiber surface (Fig. 3; Movie 2). These fingers were apposed to the muscle fiber surface with a separation of 52 ± 1.2 nm and the membrane of the nerve terminal by 17 ± 0.5 nm. Because the basal lamina remains between this intruding finger and the muscle, it appears that the SC enters the synapse between the linkages of the nerve terminal membrane to the basal lamina. The average length of such fingers was 730 nm, but some were much longer and some much shorter.
Such glial fingers have been proposed as a means of “synaptic stripping” at various sites within the nervous system. They do not represent extraordinary behavior of such cells: they are, for example, apparent during the early stages of degeneration of neuromuscular terminals after nerve section (Jirmanová and Thesleff, 1972; Miledi and Slater, 1970), in central neurons whose peripherally projecting axons are severed (Ronnevi, 1978), and in autonomic ganglia in cases where the supply of trophic materials from the target is interrupted (Njå and Purves, 1978). Here we propose that these fingers are a sign of the early competition between motor neuron terminals and the glial cells for contact with the muscle fiber surface. There appears to be something especially attractive about the surface of the neonatal AChR plaque (as distinguished from the rest of the muscle surface) because the light microscopic observations show that SCs are coextensive in their coverage with the edge of the AChR plaque (Fig. 1E).
tSCs phagocytose nerve terminals in synaptic contact with the muscle and degrade axonal material
Examination of serial sections of P3 NMJs shows that tSCs are active in phagocytosis of nerve terminal boutons. Indeed, approximately one-fourth of all degradation in axons was found within 350 nm of the postsynaptic surface (i.e., a distance equivalent to ∼9 synaptic vesicle diameters). A series of sections that illustrates several features observed is shown in Figure 3 (and in Movie 2). Here a tSC (Figure 3A, asterisk) extends a ∼300 nm diameter cytoplasmic finger (Figure 3A, black arrow) that penetrates the terminal bouton, reaches 1800 nm into the interior, but does not emerge on the opposite side. This finger even bifurcates part way into the bouton (Fig. 3G; Movie 2). This bouton is in synaptic contact with the muscle, as it has synaptic vesicles, some of which are gathered into clusters near the muscle fiber. This bouton joins, through small SC-wrapped neurites, one of the major axons entering the NMJ (see Fig. 5A, axon 3). Thus, this SC finger appears to penetrate an intact nerve terminal. In seven NMJs reconstructed at P3, we observed 14 clear incidences of such tSC fingers inside of nerve terminals.
Similar SC fingers were observed in the case of retraction bulbs by Bishop et al. (2004) and were shown to be very dynamic in vital imaging. However, these observations were of the destruction of recently eliminated axons and their retraction bulbs at the NMJ. Here we show that immature axon terminals in synaptic contact with the muscle fiber are also subject to SC-mediated phagocytosis.
Near the base of the tSC finger in Figure 3, a double membrane, “phagocytic” vesicle, ∼400 nm in diameter at its maximum, appears in the SC cytoplasm. This vesicle is still partly joined to the cytoplasm of the bouton (Fig. 3D). It is packed with vesicles that are the same size as the synaptic vesicles located in the cytoplasm of the bouton (diameters 42.2 ± 0.6 nm, n = 24 in bouton; 41.6 ± 0.9, n = 22 in the vesicle). Adjacent is a second, 400 nm vesicle located entirely within the tSC cytoplasm (Fig. 3F,G). This vesicle also has two membranes, but its contents are much more electron lucent, the membranes, particularly the inner one, are more complicated, and the few darkly staining structures within the inner membrane are less distinct and identifiable. This second vesicle appears to be in the process of degradation and likely represents a later stage in the processing of the phagocytic vesicle forming to its right. Such phagocytic vesicles were also reported by Bishop et al. (2004) during the destruction of retraction bulbs.
Throughout the sections, we encountered material contained within tSCs at the NMJ that had the appearance of the second type of phagocytic vesicle described above. This material, described variously in previous reports as membrane whorls, honeycombs, lysosomal bodies, and multivesicular bodies, was found in tSCs in close association with axon terminals. These were far more numerous than the instances of tSC-enclosed material that contained synaptic vesicles. We think a likely explanation is that the synaptic vesicles rapidly disintegrate after phagocytosis. These observations also make it likely that most of the debris found in the synaptic area is that of axons and not that of SCs. There is no evidence in our micrographs of loss of SCs or their processes during the early stages of synapse elimination, even though Brill et al. (2011) report that the processes of the neonatal tSCs, in contrast to those in the adult, are quite dynamic. In terms of numbers of SCs, a previous report shows that SCs are being added to NMJs during this period rather than lost (Love and Thompson, 1998).
To confirm phagocytosis by tSCs at developing NMJs, we used the marker Lysotracker Red, incubating nerve–muscle preparations in the dye. We found considerable staining in the form of small puncta within the receptor plaque in the plane of the AChRs and the tSCs at P3 (data not shown). Thus, we extend the data of Bishop et al. (2004) and Song et al. (2008) to encompass the synaptic region of earlier developing NMJs.
SCs attack and consume portions of nerve terminals of all the axons
We mapped the location of the degradation events at three NMJs. We found that they were distributed apparently randomly to portions of all the axons at the junction. We then segmented this debris for two of these three NMJs and obtained volumetric information about the debris associated with each axon (one of these is shown in Fig. 4). The tSCs appear to be randomly removing parts of each axon terminal on the muscle fiber surface. Therefore, it is clear that, although this type of consumption by the tSCs may play a role in driving synapse elimination, it is certainly not selecting the winner in the competition. Moreover, it is clear from examination of NMJs in which the individual tSCs were segmented (as in Fig. 2C) that consumption of nerve terminals occurs in all the tSCs rather than a select subset of them (data not shown). This observation is compatible with the lack of apparent segregation of tSCs contacts according to axon of origin at this stage of development.

Location of degradation in P3 NMJ. A, White structures represent an outline of the degraded material in NMJ-1. Much of the debris here appears above the junction but is actually located in SCs that are not shown here. B, Volume of degraded debris in each of the axons illustrated in A. C, Volume of degraded debris found in axons, SCs, and vacancies for the NMJ in A.
Vacant areas along the synaptic surface of the muscle appear to be sites previously occupied by eliminated axons
Within the serial sections, most of the space where the axons enter the NMJ as well as within the NMJ itself (but not other spaces between muscle fibers) was filled with cells and cellular processes. However, there were some distinct vacancies where there were no cell or processes present (Figs. 1A, 2A, 3E,F, and 5A–C). Most of these sites were contiguous between sections. When we reconstructed these vacant spaces through the sections, their contiguity became more obvious (Fig. 5A). These contiguous spaces resembled, in their size and shape, in their origin near the entry of the nerve, and in their proximity to and course along the muscle surface, the axons still in synaptic contact (compare Fig. 5A with Fig. 1C). Moreover, these vacancies contain free-floating cellular debris that appears to be axonal in origin (i.e., they contain synaptic vesicles and membrane whorls), as well as having, in some instances, direct connections to axons undergoing degradation (Fig. 3C). Together, these findings suggest that the vacant spaces were recently occupied by an axon. Thus, although it is impossible to be certain that these vacant spaces are not a consequence of tissue processing, the overall quality of fixation and organelles within the micrographs, the ordered arrangement of the spaces within the endplate region, the absence of such spaces in older material (P16 or adult sternomastoid), and the presence within some of the spaces of intact and well-fixed SC processes indicate that the spaces are not an artifact. Interestingly, such vacancies have been reported in fruit fly CNS during the pruning of axon terminals during metamorphosis (Awasaki and Ito, 2004); they are also present in figures of previous studies of the ultrastructure of neonatal neuromuscular junctions (Bixby, 1981; Korneliussen and Jansen, 1976; Riley, 1981; Tapia et al., 2012). We know from the studies of Tapia et al. (2012) that the number of axons present at these NMJs at P3 is reduced from that at P0, when there are ∼10 axons present. Therefore, these spaces could represent the sites occupied by recently eliminated axon(s). Comparing the “footprints” of these vacant sites on the surface of the muscle fiber with those of nerve terminals also suggests that these sites have been contacted by an eliminated axon(s) (Fig. 2A,C). It is also interesting to note that 58 of the 88 vacant sites observed on the surface of the muscle at P3 had, located next to them, an intact nerve terminal. This supports the suggestion of Turney and Lichtman (2012) and the fluorescence imaging of synapse elimination by Walsh and Lichtman (2003) that individual bouton contacts lost during elimination are quickly reoccupied by neighboring axons. However, it also seems likely, given the adjacency of nerve terminals of many axons on the muscle surface at earlier developmental times (Bixby, 1981; Kelly and Zacks, 1969; Korneliussen and Jansen, 1976; Matthews-Bellinger and Salpeter, 1983; see also below) and the SC-filled spaces between these axons seen at P3, that some of these vacant sites never become reoccupied or become occupied by SCs. Even in the experiments in which axons have been ablated (Turney and Lichtman, 2012), the reoccupancy of the territory of the ablated axon is not immediate and appears inexact, even when visualized with light microscopy.

Unoccupied sites (vacancies) in P3 NMJ. A, Surface rendering of the three largest contiguous vacancies (shades of yellow) present in presynaptic area of NMJ-4. One of the four axons still innervating this NMJ is shown in blue for comparison. B, One of the axons innervating another P3 NMJ (NMJ-1) (Fig. 1C and Movie 1, royal blue), and a vacancy (yellow). This vacancy appears to originate off a branch of the blue axon. This axon and vacancy are shown at higher magnification in B′. C, EM section through the blue nerve terminal (nt), muscle (m), SC, and the vacancy (asterisk). Scale bar: C, 1 μm.
Scrutiny of many of these vacancies suggested that some of them did not result from the loss of an entire competing axon from the synapse but rather are eliminated branchlets of axons still present at the synapse (Fig. 5B,B′,C). Indeed, in 12 cases for one of the NMJs, we could follow vacancies present at the muscle surface through an obvious, vacant pathway to an axon branch that led to other, intact terminal boutons. Eleven of these 12 branchlets contained degraded material, most of which was within 350 nm of the fiber surface. Moreover, all the axons present at the synapse had such eliminated branchlets, consistent with the observation that all of them are undergoing some turnover. These observations are consistent with previous studies (Keller-Peck et al., 2001; Tapia et al., 2012) showing that, not only are individual terminal boutons removed, but the branch giving rise to them as well.
SC occupancy of the synaptic site doubles between P0 and P3 while nerve occupancy is halved
Electron microscopy of random samples of NMJs early after birth has shown that nerve terminals abut each other on the muscle surface and has suggested that the arrival of SCs separates these nerve terminals from each other (Korneliussen and Jansen, 1976). If true, then one would predict dramatic changes in the occupancy of the synaptic site by axons and SCs during this period. We performed serial electron microscopy of 10 junctions at P0, reconstructed the axon terminals and SCs, and identified those portions that came within 50 nm of muscle surface in surface renderings, creating “footprints” of each (measured, as described above, as a percentage of the total area). We also measured the vacancies present. The number of axons present at each site fell slightly from P0 to P3: from an average of 5.1 at P0 (range, 2–9) to an average of 4.9 at P3 (range, 3–7). This is fewer inputs than reported by Tapia et al. (2012) at P0, and the difference may be explained by sampling. For example, our sample may have been biased toward smaller, secondary myotubes, whose fibers are generated and innervated later (Kelly and Zacks, 1969; Ontell et al., 1988). The critical observation is that the nerve terminal footprints at P0 were twice the size as those at P3 (51.6 ± 4.7% at P0 vs 24.7 ± 3.5% at P3). In contrast, the SC footprints at P3 were twice those at P0 (31.0 ± 2.9% at P0 to 57.0 ± 2.5% at P3). This shows that the total nerve contact with the receptor plaque is halved during this period, whereas the SC footprint is doubled. The footprint of the vacancies did not change appreciably from P0 to P3 (P0 = 17.4 ± 3.4%; P3 = 18.3 ± 1.4%). This suggests that the SCs are increasing their contact with the synaptic site at the expense of the axons. Such a conclusion is true even if the total area of each type of contact is compared. Although there is a small increase in the area of the receptor plaque between P0 and P3 (∼15%), this increase cannot by itself explain the shift in relative SC and nerve footprints. Computed as an actual area, the total nerve footprint declined (81.1 μm2 to 44.2 μm2), whereas the SC footprint increased (47.8–102.0 μm2) from P0 to P3. In the absence of time-lapse electron microscopy, this argues strongly for competition between the SCs and the nerve. The possibility that SCs merely occupy synaptic territories abandoned by the nerve seems unlikely, given the intrusive and phagocytic activities of these cells reported here.
Degradation events within SCs fall dramatically by the end of synapse elimination and are mostly absent in the young adult
Our observations of increased SC occupancy of the AChR-rich surface of the muscle and the decline in occupancy by the nerve prompted us to explore how glial activity changed during later stages of synapse elimination. We examined how the incidence of SC fingers entering nerve terminals and degradation of axon material change during two later stages in the sternomastoid muscle by light and electron microscopy.
At P16, the fibers in the sternomastoid are almost all singly innervated, and by P40 the NMJs should have achieved approximately their adult configuration in terms of the pretzel present on the muscle fiber surface (Balice-Gordon and Lichtman, 1993). Although at P16 some SC fingers penetrating nerve terminals remained and degraded axonal material was still apparent in SCs, the incidence was approximately half that present earlier at P3 and the total volume of debris decreased by ∼80% (Fig. 6A,C). This finding suggests that remodeling of the synaptic connection is less extensive, but is not yet complete by P16, even after single innervation is achieved. This is consistent with previous reports (Walsh and Lichtman, 2003) that NMJs continue to undergo minor changes after synapse elimination until ∼P21 and also serves as yet another indication that SCs do not select the winner by their activity as this selection has been completed by P16. The phagocytic activity of the SCs and degradation of axonal material was even less frequent at P40 (Fig. 6B,C). Thus, there is a developmentally regulated phagocytic activity of SCs.

Phagocytic activity of tSCs diminishes toward the end of synapse elimination and into maturity. A, Surface rendering of a P16 NMJ and (B) a P40 NMJ showing the muscle surface (red) and the innervating axon (blue). The synaptic contacts are simpler than at P3 (e.g., Fig. 4). A, B, White structures mark the outlines of phagocytic activity and axonal debris located in tSCs (cells not shown) and within axons for each. C, As the junction matures to single innervations, the phagocytic activity declines as shown by the volume of degraded material found at each P3, P16, and P40.
A developmentally regulated phagocytosis by tSCs is also suggested by observing the number of lysotracker puncta per NMJ. This number declines over the first 2 postnatal weeks and remains low in adult NMJs: 5.5 ± 0.7 at P0, 3.4 ± 0.4 at P3, 3.3 ± 0.5 at P5/6, 2.9 ± 1.0 at P10, 0.4 ± 0.1 at P21, and 0.3 ± 0.2 at P120.
SCs restrict their contacts with the muscle fiber as synapse elimination proceeds
Further evidence of continued remodeling comes from examination of the disposition of the SCs at synapses at P16 and at P40 (Fig. 7). The ratio of the nerve footprint to the SC footprint (i.e., the ratio of the muscle fiber surface contacted by nerve to that contacted by SC) changes from 3:2 at P0 to 1:3 at P3 to 1:1 at P16 and 4:1 at P40 (Fig. 7E). This change is not surprising given the ultimate restriction of SCs at the NMJ to contact with the surface of the nerve terminal (compare Love and Thompson, 1998). In individual EMs, this is seen in SC contacts with the surface of the muscle at P16 that, although diminished from those present at P3 (Fig. 7A,C), still extend into areas to the sides of the nerve contacts and in between the developing synaptic gutters (Fig. 7A,B). Suggestions that at least some of these contacts are with portions of the muscle surface still retaining AChR are obtained from examination of fluorescence micrographs where, at P16, SCs are more extensive at the sides of the nerve contacts: these areas have a wider labeling of AChR than the nerve terminal itself. By P40, except for areas where axons and/or SCs run between synaptic gutters without contacting the muscle surface, there is mostly coextensive labeling of SCs, nerve terminals, and AChR (Fig. 7B,D). These observations suggest that the relative adhesiveness of SCs for the muscle surface steadily decreases as that for the nerve terminal itself becomes stronger. These observations also suggest that this restriction is not complete by the conclusion of synapse elimination. Whatever the mechanism of this restriction, it does not appear to involve the localization of the SC-repulsive molecule laminin-β2, as this molecule is present in the synaptic basal lamina at the time of extensive SC contact with the synaptic surface (data not shown). This laminin isoform is a major component of the synaptic basal lamina and suggests that wholesale remodeling of the basal lamina is not responsible for these SC contacts.

tSCs slowly relinquish contact with the muscle and confine their contacts to the nerve terminals. A, B, Fluorescence micrographs of en face views of NMJs labeled with S100-GFP (green) for SCs, antibodies to neurofilament and SV2 (blue) for nerves, and fluorescent BTX (red) for AChRs at P16 and P40, respectively. As the junctions mature, SC processes become largely confined to covering the nerve terminal branches. C, D, Renderings from EMs of the surface of the muscle and the areas contacted by nerve (blue) and SCs (green) (i.e., the nerve and SC footprints) at P16 and P40. The portion of the muscle contacted by the SCs steady diminishes. Coverage of the nerve by SC is not shown here. E, The fraction of the muscle fiber surface covered by each SC and axon as a fraction of the area covered by both at P3, P16, and P40. Scale bar, 5 μm.
Discussion
Our experiments document novel behaviors of tSCs at NMJs that have major implications for the roles these cells play in sculpting synapses during development. These roles are illustrated in summary form in Figure 8.
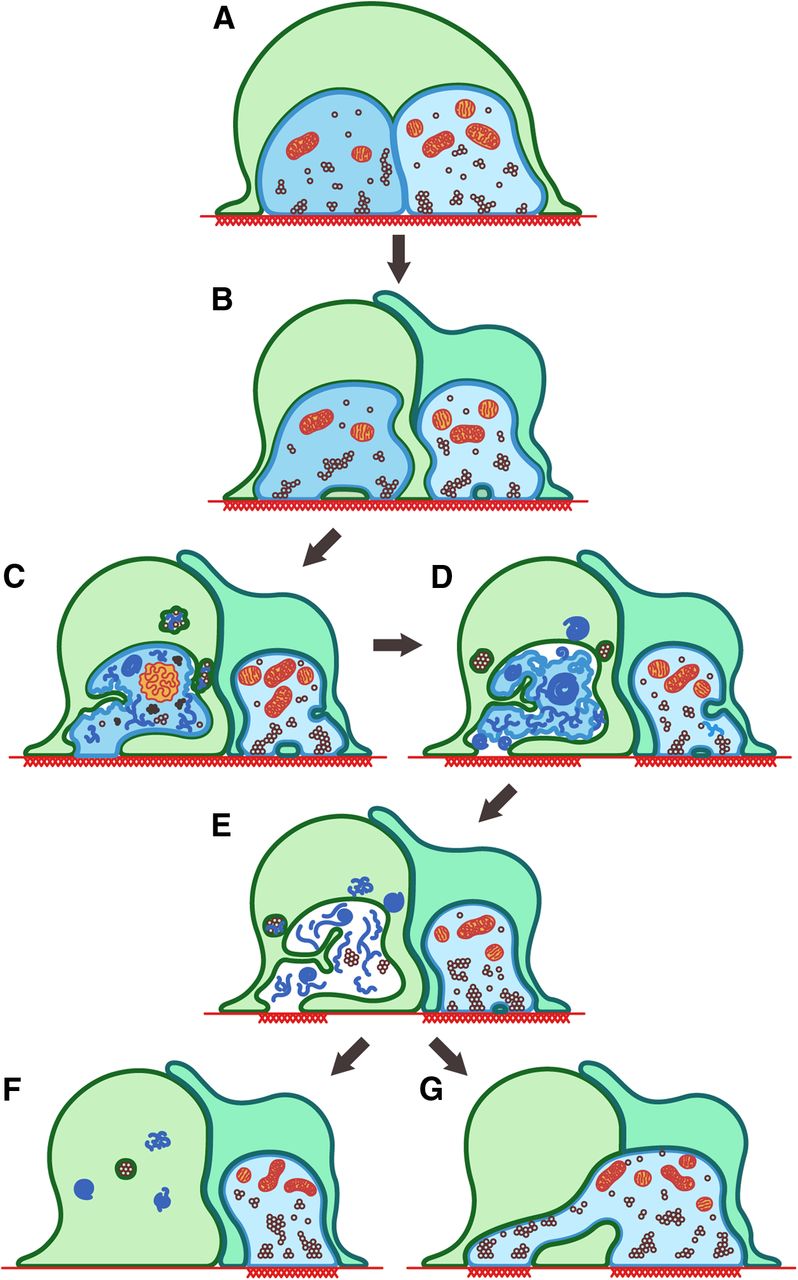
tSCs drive postnatal synapse elimination. Summary of findings and their relevance to postnatal synapse elimination at the NMJ. Two different axons (shades of blue) and SCs (shades of green) are depicted at sites where the muscle membrane has a high density of AChRs (red thatching). At the earliest stage shown (A), near the time of birth, several axons (in this case, 2 for simplicity) contact each site in the muscle. The SC(s) arrive after the nerves and initially just cover the nerve terminals. As development proceeds, the tSCs engage in two activities that result in the loss of polyneuronal innervation: (1) They compete with the axons for contact with AChRs, sending processes between and separating the nerve terminals and between the nerve terminals and the muscle fiber (B–E). This eventually results in remodeling (loss) of AChRs at those sites in contact with SCs and that receive no neurotransmitter. (2) They phagocytose and remove axonal boutons in synaptic contact with the muscle; the debris is consumed by SCs as well as left behind in vacated sites on the muscle membrane (B–E). This phagocytic attack is directed at all terminals and stochastically results in the destruction of some terminal contacts and creation of vacancies above regions with AChR. At least in some cases, these vacancies are filled on a stochastic basis by terminals of nearby neurons (G). In other cases, these vacancies remain nonsynaptic (F). Artwork courtesy of B. Colyear after a drawing by I.W.S.
First, we show that tSCs engage in phagocytosis of nerve terminals (Fig. 8C–E). Glial phagocytosis is not novel. Bishop et al. (2004) reported phagocytosis by tSCs during synapse elimination in the mouse, but the axons undergoing phagoctyosis had been eliminated from the surface of the muscle and were withdrawing (as “axosomes” shed from “retraction bulbs”). So in this case, the glia were involved in consuming the losing axon(s) once disconnected from the muscle. No role in the elimination events at the synapses was identified or proposed. Similarly, phagocytosis of degenerating nerve terminals is seen after peripheral nerve injury in adult rodent muscle (Miledi and Slater, 1970). Glial activity in the remodeling of the fly nervous system at metamorphosis (Awasaki and Ito, 2004, Watts et al., 2004) and the fly larval neuromuscular junction (Fuentes-Medel et al., 2009) has been documented, but this activity seems important for removal of debris rather than the remodeling itself. More recently, Paolicelli et al. (2011) have documented microglial activity in the removal of whole synaptic structures from the dendrites of developing hippocampal dendrites. Schafer et al. (2012) have documented microglial activity in developmental pruning of synapses in the lateral geniculate nucleus. In both cases, this microglial phagocytosis is activity driven; moreover, some molecules involved in this phagocytosis have been identified and shown to delay this process if genetically ablated. However, the process determining which inputs are lost remains less clear. The neuromuscular junction offers distinct advantages for these types of issues. It is possible to study the process longitudinally in time at individual synapses (Walsh and Lichtman, 2003), to manipulate the activity of individual inputs (Buffelli et al., 2003), to surgically and optically eliminate individual inputs or even parts of inputs (Turney and Lichtman, 2012), and to even examine the relative competitiveness of individual presynaptic inputs at various postsynaptic targets (Kasthuri and Lichtman, 2003). Moreover, with serial electron microscopy, it is possible to examine every input to a single postsynaptic cell as these inputs are confined within a small, circumscribed area on the muscle surface (i.e., the endplate) (Tapia et al., 2012). In this way, it has been possible in the present study to show that all synapses onto the postsynaptic cell undergo attack by the tSCs. Thus, this SC activity is not selecting the winner. There are several glia at the synapse; and although they ultimately partition the synapse among themselves (Brill et al., 2011), all of them at each NMJ participate in this activity. The role for glia at the NMJ (and perhaps in the CNS as well) appears to be driving synapse turnover, and this turnover plays a role in interneuronal competition (see discussion below).
Second, our experiments show that SCs compete with the nerve terminals for contact with the AChR-rich area on the surface of the muscle (Fig. 8A–G). This competition is demonstrated by several observations. The SCs contact receptor-rich muscle membrane because their occupancy of the endplate site far exceeds that of any discontinuities in the receptors, and in the EMs they appose the muscle surface as close as do the nerve terminals. Although there have been a few incidental reports of this relationship at developing junctions studied by EM (Matthews-Bellinger and Salpeter, 1983, Tapia et al., 2012), our study constitutes the first thorough analysis of this SC apposition to the synaptic site. We show that such apposition is quite substantial, even outstripping that of the nerve terminals themselves by P3. This observation was unexpected, as the contacts of the SCs at the adult NMJ are confined to the nonsynaptic surface of the nerve terminals and at the edges of the nerve terminals (Sanes and Lichtman, 2001). Indeed, these contacts in the neonates (separated from the muscle surface by ∼50 nm) would be impossible to demonstrate with even confocal microscopy given resolution limits. In the act of making contact with the muscle surface, the SCs appear to be displacing the nerve. This is clearly shown by comparing the apposition of the nerves and SCs in the developing endplate: the apposition of the SCs increases from P0 to P3, whereas that of the nerves decreases. This change fits previous EM descriptions of early NMJs that have shown that SC processes penetrate to separate a set of nerve terminals that initially abut each other on the muscle surface (Korneliussen and Jansen, 1976). Last, we observe many instances of SC fingers intruding between the nerve terminals and the muscle fiber, reminiscent of the reports of so-called “synaptic stripping” by glial cells, particularly in cases of axotomy-induced chromatolysis of neurons (Ronnevi, 1978). By preventing postsynaptic action of transmitter at these sites, SCs could be ultimately driving AChR turnover here. Furthermore, our experiments suggest that the behavior of the SCs at the synapse resemble those of SCs known to occur during peripheral nerve development. Here axons extend into the periphery as naked bundles; the SCs migrate along these nerves, proliferate, and extend processes into the nerve bundles to separate and wrap the individual axons (Peters and Muir, 1959).
If SCs phagocytose all the terminals present at polyneuronally innervated junctions, how do they manage to effect elimination of all but one axon? A possibility was recently suggested by Turney and Lichtman (2012). These investigators report a number of observations following up on vital imaging (Walsh and Lichtman, 2003), showing that the various inputs at each NMJ compete with each other for occupation of the synaptic space on the surface of the fiber, with the victor ultimately expanding its territory at the expense of the loser(s). They show that laser ablation of one of the axonal inputs to a dually innervated junction results in the rapid reoccupation of the territory of the ablated by the unablated axon. They even show, in a singly innervated, adult junction, that laser ablation of a portion of the terminal arbor results in new growth of the same terminal to reoccupy the vacated space. From this they conclude that a mechanism that removes portions of any input results in compensatory growth by the other input(s) (Fig. 8G). They model a process of random elimination of portions of the terminal arbor of each axon at polyneuronally innervated junctions combined with a random reoccupation of the vacated space by any of the adjacent terminals at the endplate. This model can account for the segregation of inputs into adjoining domains within the endplate (a behavior observed from vital imaging), followed by eventual loss of inputs, resulting ultimately in single innervation. Our observations assign the role of random removal of axon terminals from the surface and creating vacancies within the endplate to SCs. Thus, SCs would drive synapse elimination without selecting the winner. Presumably, some of the sites that become occupied by SCs are not reoccupied by nerve terminals (Fig. 8F); such represents only a small modification of the Turney and Lichtman (2012) model and could presumably help convert a uniform plaque of receptors into one that has discontinuities in the distribution of receptors (i.e., a pretzel of receptors) (however, see Kummer et al., 2004).
Such a model of SC consumption of nerve terminals in synaptic contact with the muscle fiber is not inconsistent with any previous studies of manipulations that change the rate or outcome of synapse elimination. All one would have to assume, for example, is that the manipulation favored the growth of one axon over other axons at the NMJ. For example, as in the visual system, the more active axon at a polyneuronally innervated junction is favored in the competition and ultimately displaces the less active axon; such could be explained by the more active axon(s) having a greater tendency to grow within an endplate experiencing turnover. Similarly, motor neurons that innervate larger territories might be proposed to be better (or worse) at reoccupation of vacated spaces.
The SC destruction of inputs reported here is seldom dramatic enough to produce obvious features of Wallerian degeneration, as previously reported (Rosenthal and Taraskevich, 1977). However, there are subtle but clear anatomical signs when one examines junctions in serial sections. Hence, some of the controversy over the anatomical signs of synapse elimination can be explained.
These experiments suggest obvious next steps to show whether SCs are necessary for synapse elimination. One possible caveat to such experiments is that SCs might be essential in other ways for the synaptic development and their removal causes failure of innervation (Wolpowitz et al., 2000). It also seems quite likely that, as in the cases of the hippocampus and the LGN where elimination is slowed but not prevented upon genetic alterations in phagocytic activity, elimination is so crucial to neural development that no single mechanism will completely explain it.
Notes
Supplemental material for this article is available at http://www.bio.tamu.edu/users/wthompson/media/. Figures of degradation, SC intrusion, degradation within vacancies, Lysotracker staining, synapse growth and laminin β2. Movies showing SCs are coextensive with AChR, nerve footprint, serial EM sections of SC degradation of nerve terminal, serial EM sections of vacancies, surface renderings of branchlets. This material has not been peer reviewed.
Footnotes
This work was supported by National Institutes of Health Grant NS20480 and the College of Science, Texas A&M University (startup funds and salary support). We thank D. Romanovicz for assistance with the electron microscopy; J. Mendenhall for advice on electron microscopy; and Drs. Y. Li, U.J. McMahan, M. Harlow, J. Szule, M. Rimer, and S. Haddix for discussions/comments on the manuscript and figures.
The authors declare no competing financial interests.
- Correspondence should be addressed to Dr. Wesley J. Thompson, Department of Biology and Institute for Neuroscience, Texas A&M University, College Station, TX 77843. wthompson{at}bio.tamu.edu


