

Abstract
In vivo intracellular spontaneous activity in striatal medium spiny (MS) projection neurons is characterized by “up” and “down” states. How this type of activity relates to the neuronal activity of striatal fast-spiking (FS) interneurons was examined in the presence of nigral and cortical inputs using cortex–striatum–substantia nigra organotypic cultures grown for 45 ± 4 d. The nigrostriatal projection was confirmed by tyrosine hydroxylase immunoreactivity. Corticostriatal (CS) projection neurons, striatal MS neurons, and FS neurons were intracellularly recorded and morphologically and electrophysiologically characterized. Intracellular spontaneous activity in the cultures consisted of intermittent depolarized periods of 0.5–1 sec duration. Spontaneous depolarizations in MS neurons were restricted to a narrow membrane potential range (up state) during which they occasionally fired single spikes. These up states were completely blocked by the glutamate antagonist CNQX. In FS interneurons, depolarized periods were characterized by large membrane potential fluctuations that occupied a wide range between rest and spike threshold. Also, FS interneurons spontaneously fired at much higher rates than did MS neurons. Simultaneous intracellular recordings established that during spontaneous depolarizations MS neurons and FS interneurons displayed correlated subthreshold neuronal activity in the low frequency range. These results indicate that (1) the CS projection neurons, striatal MS neurons, and FS interneurons grown in cortex–striatum–substantia nigra organotypic cultures show morphological and electrophysiological characteristics similar to those seen in vivo; (2) striatal MS neurons but not FS interneurons show an up state; (3) striatal MS neurons and FS interneurons receive common, presumably cortical inputs in the low frequency range. Our results support the view that the cortex provides a feedforward inhibition of MS neuron activity during the up state via FS interneurons.
- cortex
- striatum
- substantia nigra
- organotypic culture
- corticostriatal projection
- nigrostriatal projection
- medium spiny projection neuron
- fast-spiking interneuron
- intracellular recording
- cross-correlation
The main neuronal type in the striatum is the medium spiny (MS) projection neuron. Intracellular recordings from these neurons in vivo have demonstrated a characteristic shift in the membrane potential; they alternate between a resting level called the down state and a more-depolarized level called the up state (Wilson, 1993; Wilson and Kawaguchi, 1996; Stern et al., 1997) dictated by cortical inputs (Wilson, 1993; Plenz and Aertsen, 1996b). The up state is accompanied by irregular spike discharge at low frequencies as well as by burst firing (Wilson and Groves, 1981; Aldridge and Gilman, 1991).
In addition to the action of intrinsically rectifying ion channels (Wilson, 1992; Nisenbaum and Wilson, 1995; Wilson and Kawaguchi, 1996), GABA activity from local circuits is also considered to be involved in the generation of the up state in MS neurons (Kita, 1996; Plenz and Aertsen, 1996b). The reversal potential of GABAA-mediated synaptic responses in MS neurons lies at approximately −60 mV (Misgeld et al., 1982; Kita et al., 1985; Mercuri et al., 1991; Kita, 1996), which is within the range for the activation of outwardly rectifying currents (Nisenbaum et al., 1994) and the average potential range of the up state (Plenz and Aertsen, 1996b; Wilson and Kawaguchi, 1996;Stern et al., 1997). This action of GABA inputs to MS neurons might be crucial for striatal function, because it enables local GABAergic circuits in the striatum to detect complex timing relationships in cortical input activity (Plenz and Aertsen, 1994; Plenz et al., 1996) and also to generate complex striatal output activity patterns (Wickens and Arbuthnott, 1993; Kötter and Wickens, 1995).
However, GABAergic inhibition has not been detected during spontaneous up states in MS neurons recorded intracellularly in the urethane-anesthetized rat (Wilson and Kawaguchi, 1996). On the other hand, intrastriatal (Lighthall et al., 1981; Lighthall and Kitai, 1983;Kita et al., 1985; Cherubini et al., 1988; Calabresi et al., 1991;Jiang and North, 1991; Seabrook et al., 1991; Kita, 1996), cortical white matter (Calabresi et al., 1992, 1993; Nisenbaum et al., 1993;Stefani et al., 1994), or repetitive intracortical (Kita, 1996) stimulation in acute slices can elicit prominent GABAApostsynaptic responses in striatal MS neurons. Moreover, in cortex–striatum cocultures, GABAA activity has been demonstrated to prevent MS neurons from firing during long-lasting up states (Plenz and Aertsen, 1996b).
Because GABAergic interaction between MS neurons seems to be weak (Jaeger et al., 1994), local striatal GABA activity is considered to originate mainly from striatal fast-spiking (FS) GABA interneurons (Jaeger et al., 1994; Kita, 1996). These FS GABA interneurons (Kawaguchi, 1993; Kawaguchi et al., 1995; Plenz and Aertsen, 1996a) receive direct cortical inputs (Kita and Kitai, 1988; Kita et al., 1990; Bennett and Bolam, 1994) and are easily excited by cortical stimulation (Kawaguchi, 1993; Kita, 1993; Plenz and Aertsen, 1996b;Parthasarathy and Graybiel, 1997). However, the relationship between up states in MS neurons and neuronal activity in FS GABA neurons has not been analyzed.
The aims of the present study were (1) to characterize the morphology and electrophysiology of corticostriatal (CS) projection neurons, striatal MS projection neurons, and striatal FS interneurons in long-term triple (cortex–striatum–substantia nigra) organotypic cultures; (2) to determine the spontaneous intracellular activity in these two striatal neuronal types; and (3) to analyze how FS interneuron activity is related to the up and down states in MS neurons using paired intracellular recordings.
MATERIALS AND METHODS
Preparation of organotypic cultures. For the preparation of the cortex–striatum–substantia nigra organotypic cultures (triple cultures), coronal sections (350–400 μm) from rat brains (Harlan Sprague Dawley, Indianapolis, IN) at postnatal day 0–2 were cut on a vibroslice (VSL; WPI, Sarasota, FL). Slices containing the striatum and the cortex were used for dissection of dorsal or dorsolateral cortical and striatal tissue. For the substantia nigra (including pars compacta and pars reticulata), ventrolateral sections from mesencephalic slices were taken, and medial tissue regions were avoided. The tissue was placed on a small rectangular piece of a Millicell-CM membrane (Millipore, Bedford, MA) with 20 μl of chicken plasma (Sigma, St. Louis, MO) on a coverslip. Then 20 μl of bovine thrombin (1000 NIH units/0.75 ml; Sigma) was added. After plasma coagulation, the cultures were put into narrow culture tubes (Nunc, Naperville, IL), and medium was added (750 μl). The unbuffered standard medium consisted of 50% basal medium Eagle, 25% HBSS, and 25% horse serum (GIBCO, Grand Island, NY), with 0.5% glucose and 0.5 mml-glutamine (GIBCO) added. The cultures were rotated in a rollertube incubator set to 0.6 rpm (Heraeus GmbH, Göttingen, Germany) at 35°C in normal atmosphere. After 3 and 27 d in vitro (DIV) mitosis inhibitors were added for 24 hr (10 ml each of 1 mmcytosine-β-d-arabino-furanosid, 1 mm uridine, and 1 mm 5-flurodeoxyuridine; Sigma). Medium was changed every 3–5 d (for details, see Plenz and Aertsen, 1996a; Plenz and Kitai, 1996a).
Electrophysiology. For electrophysiological recording, the cultures were submerged in a salt solution at 36.5 ± 1°C containing (in mm) 126 NaCl, 0.3 NaH2PO4, 2.5 KCl, 0.3 KH2PO4, 1.6 CaCl2, 1.0 MgCl2, and 0.4 MgSO4 saturated with 95% O2/5% CO2. The glass bottom of the recording chamber allowed for visual selection of the cells from which to record. Intracellular recordings were obtained with sharp microelectrodes (110–150 MΩ) containing 2 m potassium acetate and 2% Neurobiotin (Vector Laboratories, Burlingame, CA). Signals were recorded in Spike2 (Cambridge Electronic Design, Cambridge, UK). Neurons were accepted for analysis if their membrane potential was stable and depolarizing-current injection elicited repetitive spike discharge. For drug application, tetrodotoxin (TTX) (Sigma) or 6-cyano-7-nitroquinoxaline-2,3-dione (CNQX) (Research Biochemicals, Natick, MA) was dissolved in the recording solution and bath applied. At the end of the recording of each neuron, Neurobiotin was injected with positive current pulses (250 msec; 2 Hz; 0.3–0.6 nA; 10–60 min) for morphological reconstruction (Horikawa and Armstrong, 1988; Kita and Armstrong, 1991).
Electrophysiological data analysis. Membrane potentials were sampled at 20 kHz (single-cell recordings) and 10 kHz (dual recordings). Membrane potential distributions were obtained from periods downsampled to 0.5–1 msec time resolution. Bimodal membrane potential distributions were fitted to two Gaussian functions, and the mean and the width of the distributions were obtained (Origin; Microcal, Southampton, MA). In MS neurons, the start of a transition to the down state was defined as the last time when the membrane potential was within the range of the mean value during the up state minus two SDs. The time constant for the transition to the down state was estimated from a semilogarithmic plot of the membrane potential. A linear function was fitted to the period of 100–500 msec of the return trajectory. For each neuron, three trajectories were measured, and the resulting time constants were averaged.
Spike discharge was detected off-line using a threshold operation with subsequent spike peak detection (Spike2). The average firing rate in FS interneurons was determined by averaging spike activity over a period of 1 sec using a sliding window. The maximum firing rate was taken from each neuron. Multiple resolution interspike interval histograms (INTH) and first-order autocorrelations of spike activity (AC) were calculated for each FS interneuron using bin widths ranging from 1 to 20 msec.
Powerspectra were calculated from periods downsampled to 0.5–1 msec time resolution using either Origin or Mathematica (Wolfram Research, Champaign, IL). Cross-correlation analysis was performed in Mathematica running on a Sun sparcs-station (Sun Microsystems, Mountain View, CA).
Anatomy. For immunohistochemistry and Neurobiotin reconstruction, triple cultures were fixed in 4% paraformaldehyde and 2% picric acid in 0.1 m phosphate buffer (PB), pH 7.4, overnight at 4°C and then incubated in 2% H2O2 in 0.1 m PBS and 0.3% Triton X-100 (30 min; Sigma). The underlying membrane was removed, and the cultures were mounted on slides. After preincubation in avidin–Texas Red (TR) (1:150; Vector) in PBS in 0.3% Triton X-100, the cultures were incubated overnight with a mouse monoclonal antibody against tyrosine hydroxylase (TH) (1:500; Incstar, Stillwater, MN) in PBS containing 3% normal horse serum (Vector) and 0.3% Triton X-100. The cultures were then incubated in fluorescein anti-mouse IgG (FITC) (1:150; Vector) in PBS containing 0.3% Triton X-100 for 3 hr at room temperature and were covered in 2.5% 1,4-diazabicyclo-[2.2.2]-octane (50% glycerol in PBS; Sigma) or in Vectashield (Vector). To make the staining of the Neurobiotin-labeled cells permanent, we used the standard avidin–biotin-complex method (Vector) with subsequent reaction with 3,3′-diaminobenzidine tetrahydrochloride (DAB) (Sigma) and nickel enhancement.
The fluorescent stains were analyzed using a confocal laser scanning microscope (Bio-Rad MRC 1000; Olympus Immunochemicals, Lake Success, NY). Optical sections (0.5–5 μm) were taken throughout the entire depth of the tissue. For each section, a Kalman filter (n = 3) and background subtraction (n = −1) were used to increase the signal-to-noise ratio. The sections were then merged into one single view. For the reconstruction of recorded neurons and TH-immunoreactive (TH-IR) neuronal elements, red and green fluorescence filters were used respectively. Permanently labeled cells were traced using a conventional light microscope with a drawing tube attached and, when further quantitative analysis was required, were captured with a CCD camera attached to a computer image analysis system (IPLab Spectrum; Signal Analysis Corporation, Vienna, VA).
Data are expressed as mean ± SEM if not otherwise stated. For the statistical analyses comparing cell classes, the one-way ANOVA or Mann–Whitney U test have been used. Correlation was estimated by regression analysis.
RESULTS
Development of the nigrostriatal pathway
Thirty-three triple cultures were examined after 45 ± 4 DIV. In all cultures, TH-IR neurons were found exclusively in the mesencephalic region. These TH-IR neurons had a fusiform or polygonal cell body with sparsely branched and slightly varicose dendrites (Fig.1; see Fig. 4D) TH-IR fibers from nigral neurons heavily innervated the striatum (see Figs.1, 4D). The density of TH-IR fibers always increased strongly at the striatal level (see Figs. 1, 4B2,D,6A2). In two cultures, few TH-IR fibers were also seen in the cortex (see also Plenz and Kitai, 1996a).

The nigrostriatal projection in a cortex–striatum–substantia nigra organotypic culture grown for 30 DIV and stained for TH (light). TH-IR neurons from the substantia nigra (sn) (n = 25) send fibers to the striatum (cp) but not the cortex (cx; arrow). Scale bar, 500 μm.
Morphology and electrophysiology of CS projection neurons
Five out of 48 morphologically reconstructed pyramidal cells from upper and lower cortical layers had axonal arborizations in the striatum and were considered to be CS projection neurons. CS projection neurons were located predominantly in the region of the cortex originally equivalent to the infragranular layers (Fig.2). The somatic cross-sectional area of these pyramidal cells was small (224 ± 36 μm2; long axis, 21 ± 1 μm; short axis, 13 ± 2 μm). The basal dendritic field consisted of four to seven primary dendrites and occupied an area of 180,000 ± 88,000 μm2. The apical dendrite was sparsely branched and never reached to the upper cortical border (distance from cell body to the longest dendritic tip, 530 ± 97 μm). In most cases the intracortical axonal arborizations of CS projection neurons were widespread throughout the cortex, and in each case several axonal branches traveled in parallel toward the striatum (Fig. 2). The axonal arborizations of CS projection neurons in the striatum were either restricted to a local area (Fig. 2A) or were widespread (Fig. 2B,C). These axon collaterals had swellings reminiscent of boutons “en passant” (Fig.2C, photo). All CS projection neurons were regular spiking pyramidal neurons (Fig.3) and had an average resting membrane potential of −69 ± 5 mV, an input resistance of 123 ± 36 MΩ, and a membrane time constant of 21 ± 7 msec.

Dendritic and axonal reconstruction of cultured CS projection neurons. A, CS projection neuron with a characteristic small apical dendritic tree (47 DIV). This neuron had two axonal projections to the striatum (red) that arborized within a relatively restricted striatal area. Thephoto depicts the Neurobiotin reconstruction (DAB-converted) of the neuron, and the inset shows spines at the basal dendrite. The icon indicates the position of the neuron within the triple culture. B, CS projection neuron with extensive intracortical axonal arborizations and less extensive intrastriatal axonal aborizations (33 DIV).C, CS projection neuron (46 DIV) and its intracortical axons that innervate the total extent of the cortical culture with a preference for the uppermost cortical layer. Note the multiple ascending intracortical axonal branches. The axonal projections within the striatum are relatively diffuse and widespread. Thephoto shows the typical corticostriatal boutons en passant (DAB-converted). cx, Cortex; cp: striatum; sn, substantia nigra; ub,wm, upper cortical border and white matter at the time of culturing, respectively. Inset(A) scale bar, 10 μm.
Response of a cultured CS projection neuron to intracellular current injections (47 DIV). A, Response to subthreshold and suprathreshold current injections at resting potential. B, Current–voltage responses from hyperpolarized levels. C, Steady state current–voltage relationship taken from B.
Morphology and current-clamp responses of striatal MS neurons
Striatal MS neurons had a medium-sized somatic cross-sectional area (93 ± 16 μm2) and a circular dendritic field (n = 14 neurons; Fig.4A,B1,B2; Table 1). The dendrites were covered with spines or spine-like protrusions except for the proximal part of the primary dendrites. Primary dendrites usually branched into higher order dendrites. The main axon traveled long distances throughout the striatal tissue and gave off local collaterals within or close to the dendritic field (Fig. 4C).

The morphology of cultured striatal MS neurons.A, Morphological reconstruction of a neuron labeled with TR using a projection of confocal pictures that covers a depth of 35 μm (75 DIV). The spherical dendritic tree and the main axon that originates from the cell body and gives off local axon collaterals (arrows) are the major features of the morphology of these neurons. B1, The dendritic tree at higher magnification. The dendrites are covered with spines except for the proximal part of the primary dendrites. B2, Same region seen in B1 but displaying the striatal TH-IR fibers (FITC). The arrow indicates the position of the MS neuron. C, Complete reconstruction of the axonal and dendritic arborization of the neuron (from DAB-converted original). The main axon courses throughout the striatum (cp) but does not enter the substantia nigra (sn). D, TH-IR neurons in the sn and adjacent striatal region from the same triple culture (cp) (FITC; projection of confocal pictures that covers the total depth of the culture). The broken line indicates the border between the sn andcp. Note the typical morphology of TH-IR neurons and the increase in TH-IR fibers on entering the cp. Scale bars:A, D, 200 μm; B1,B2, 100 μm.
Electrophysiological and morphological characteristics of striatal MS neurons and striatal FS interneurons
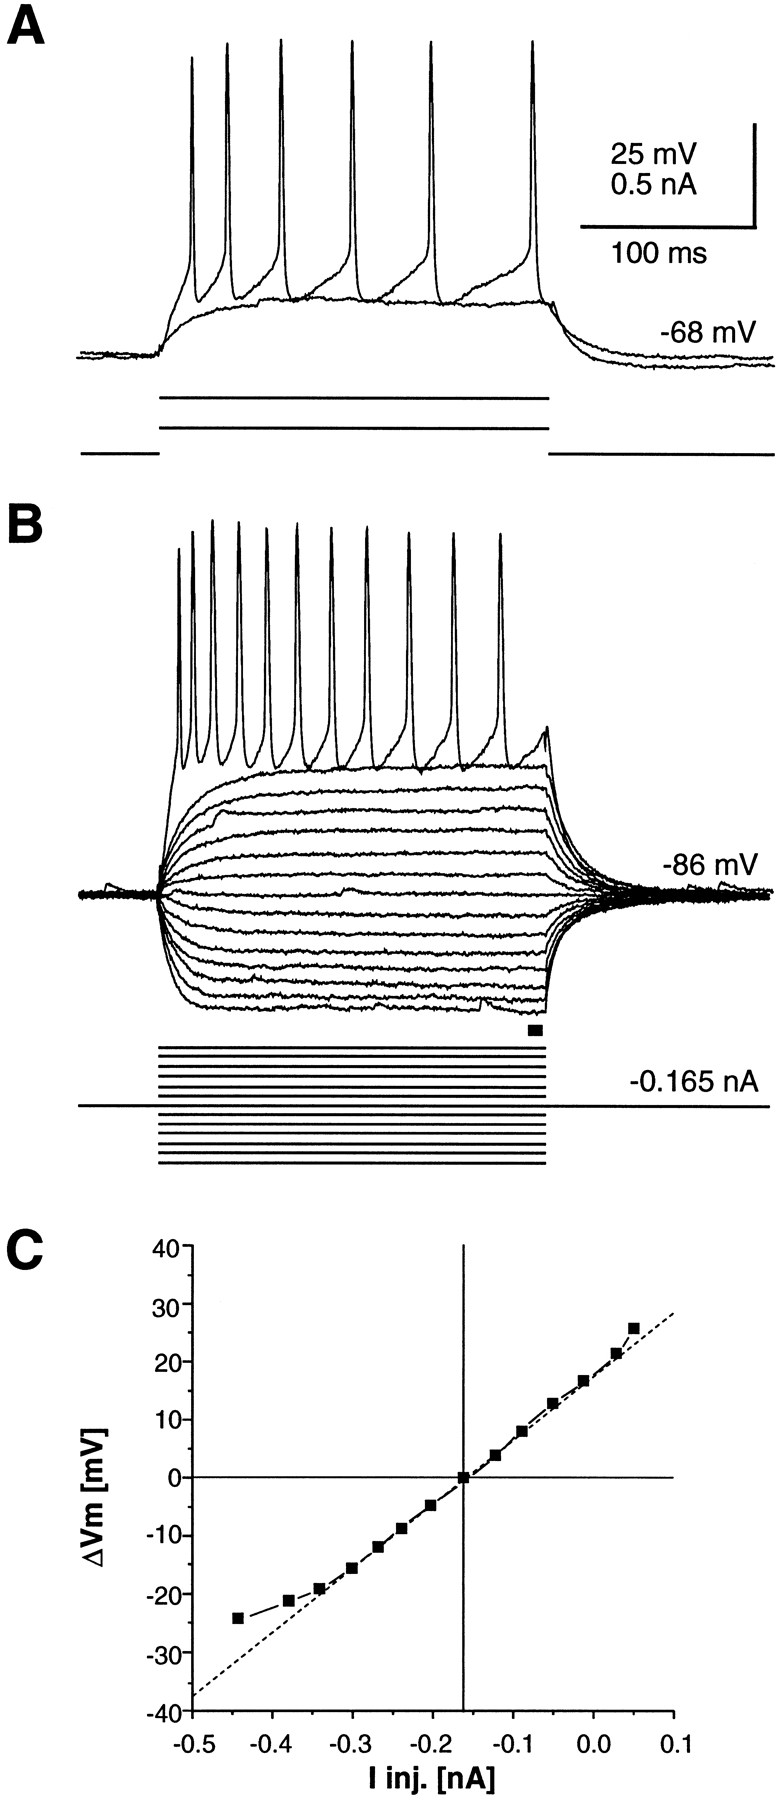
The current–voltage responses of MS neurons were characterized by strong anomalous rectification in the hyperpolarized range and by powerful early outward rectification after depolarization (Fig.5A1–A3). The early outward rectification was particularly visible in the presence of 1 μm TTX (n = 4; Fig.5A2,A3). MS neurons could fire spikes at frequencies up to 70 spikes/sec with little adaptation (Fig.5B1–B3).

Responses of cultured striatal MS neurons to intracellular current injections. A1, The current–voltage relationship of an MS neuron (56 DIV). Note the inward rectification at hyperpolarized levels and the early outward rectification (open arrow; dotted line) after depolarization from rest. A2, The outward rectification under the presence of TTX. A3, The steady state current–voltage relationship taken from A1 andA2. B1, The firing behavior of the neuron during 500 msec suprathreshold current injection. Note the delayed spike onset (open arrow) and the lack of prominent after-burst hyperpolarization (filled arrow).B2, The time course of the current–frequency relationship. B3, Plot of the first and second interspike interval (ISI) and the steady state frequency relationship (average from 100 to 200 msec) against current injection.
Morphology and current-clamp responses of striatal FS interneurons
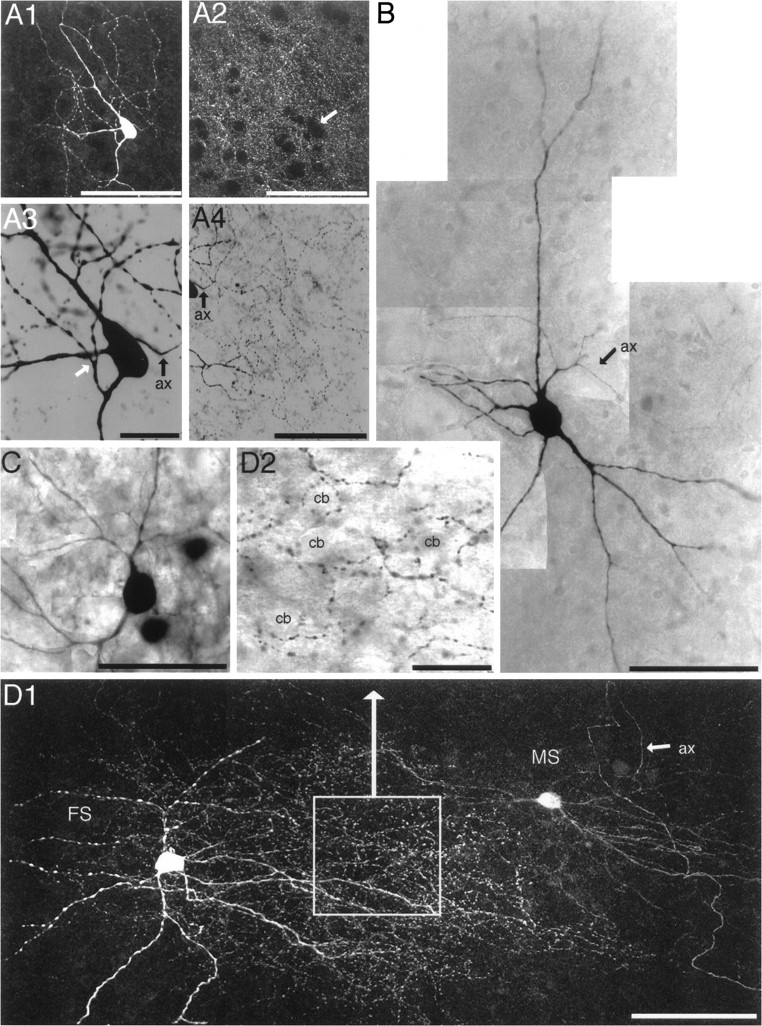
Twelve out of 19 recorded striatal interneurons were considered to be FS interneurons based on their morphological and electrophysiological characteristics; the FS interneurons had a larger somatic cross-sectional area (200 ± 23 μm2) than did striatal MS neurons (Table 1), and their two to five primary dendrites often branched within a short distance from the cell body into thin, varicose, and aspiny dendrites (Fig.6). Their dendritic field was two to three times larger than that of MS neurons, with single dendrites often exceeding a maximum length of 300 μm (320 ± 59 μm; n = 12; Table 1). The axons branched frequently within the vicinity of the cell and gave rise to a dense plexus of axonal collaterals with small-sized boutons en passant (Fig.6A4,D1,D2).

The morphology of cultured striatal FS interneurons. A1, Striatal FS interneuron filled with Neurobiotin and labeled with TR (30 DIV). A2, Corresponding striatal TH-IR fiber density (FITC). Thearrow indicates the position of the FS interneuron.A1 and A2 are projections of confocal images covering the total depth of the neuron. A3, Higher order dendrites of FS interneurons that are strongly varicose (white arrow; DAB) after branching. The main axon (ax) originates from the cell body.A4, Axonal arborization within the striatum of the FS interneuron. B, Multipolar striatal FS interneuron showing the typical morphology of thick primary dendrites that, after a short distance from the cell body, suddenly branch into several thin, varicose dendrites (27 DIV; DAB-converted; photomontage). In this case, the axon originates from a relatively thick primary branch. C, Bipolar striatal FS interneuron (33 DIV; DAB-converted; photomontage). D1, FS interneuron and MS neuron recorded simultaneously (40 DIV; projection of confocal images that covers the total depth of both neurons). Note the dense plexus of axonal boutons between both neurons that originate from the axon of the FS neuron. Note also the main axon (ax) of the MS neuron that originates from the cell body (arrow). D2, Area with the main axonal arborization of the FS interneuron from D1 shown at higher magnification (DAB). Note the dense axonal arborization that surrounds many small-sized striatal cell bodies (cb). Scale bars: A1, A2,A4, 100 μm; B, C,D1, 50 μm; A3, D2, 25 μm.
The resting membrane potential of FS interneurons was on average more depolarized, and the membrane time constant was shorter, than that in striatal MS neurons (Table 1). The duration of the action potential was relatively short, and the action potential often did not overshoot zero. Rectification in the hyperpolarized range was weak (Fig.7A1,A2). Single spikes in most neurons (9/12) originated from an underlying subthreshold depolarization (Fig. 7A1). The spike onset after depolarization was delayed by an early outward rectification (Fig. 7A1,B1,C2). Slightly suprathreshold current injections resulted in firing at high rates, thereby disallowing firing at long interspike intervals (Fig.7B1–B4). FS interneurons could maintain high firing rates without prominent adaptation up to 250 Hz (Fig.7B1–B4). However, in all cases, spike discharge was occasionally interrupted in an all-or-none manner (Fig.7C2).

Responses of cultured striatal FS interneurons to intracellular current injections. A1, The current–voltage relationship of an FS interneuron (56 DIV). Note the presence of a subthreshold depolarization (arrowhead) and outward rectification (arrow). A2, The steady state current–voltage relationship. All subthresholdtraces that were not distorted by spontaneous activity were combined into this plot. Note the outward rectification in the subthreshold range and the weak inward rectification in the hyperpolarized range (arrows). The linear regression line was calculated from responses to current injections between −0.2 and +0.1 nA. B1–B4, Firing behavior after current pulses. B1, Responses to long duration depolarizing current pulses. Note the abrupt and delayed (arrow) onset of spike discharge. This is the same neuron shown inA1. B2, Current–frequency relationships of an FS interneuron (29 DIV). Note the strong spike adaptation during the first 100 msec followed by sustained firing even at high spike frequencies. B3, Plot of the first and second interspike interval (ISI) and the steady state frequency relationship (average from 300 to 500 msec) against current injection. Data are taken fromB2. B4, Time course of the response to strong depolarizing constant current injection. Note that the burst after hyperpolarization is relatively weak, even after strong spiking activity (arrow). C1–C2, The variation in burst discharge seen in FS interneurons. C1, A brief burst followed by a late outward rectification (filled arrow; same neuron shown in A1).C2, Strongly delayed burst onset (open arrow) and abrupt pause (filled arrow; 40 DIV).
Spontaneous activity of striatal MS neurons
In general, the intracellular activity of MS neurons was characterized by a polarized resting potential (down state) from which the neurons spontaneously became depolarized to a subthreshold membrane potential range (Fig.8A1). The membrane potential during the depolarized period stayed within a relatively narrow membrane potential range (up state). The transition to the down state was stereotyped and lasted several hundred milliseconds.

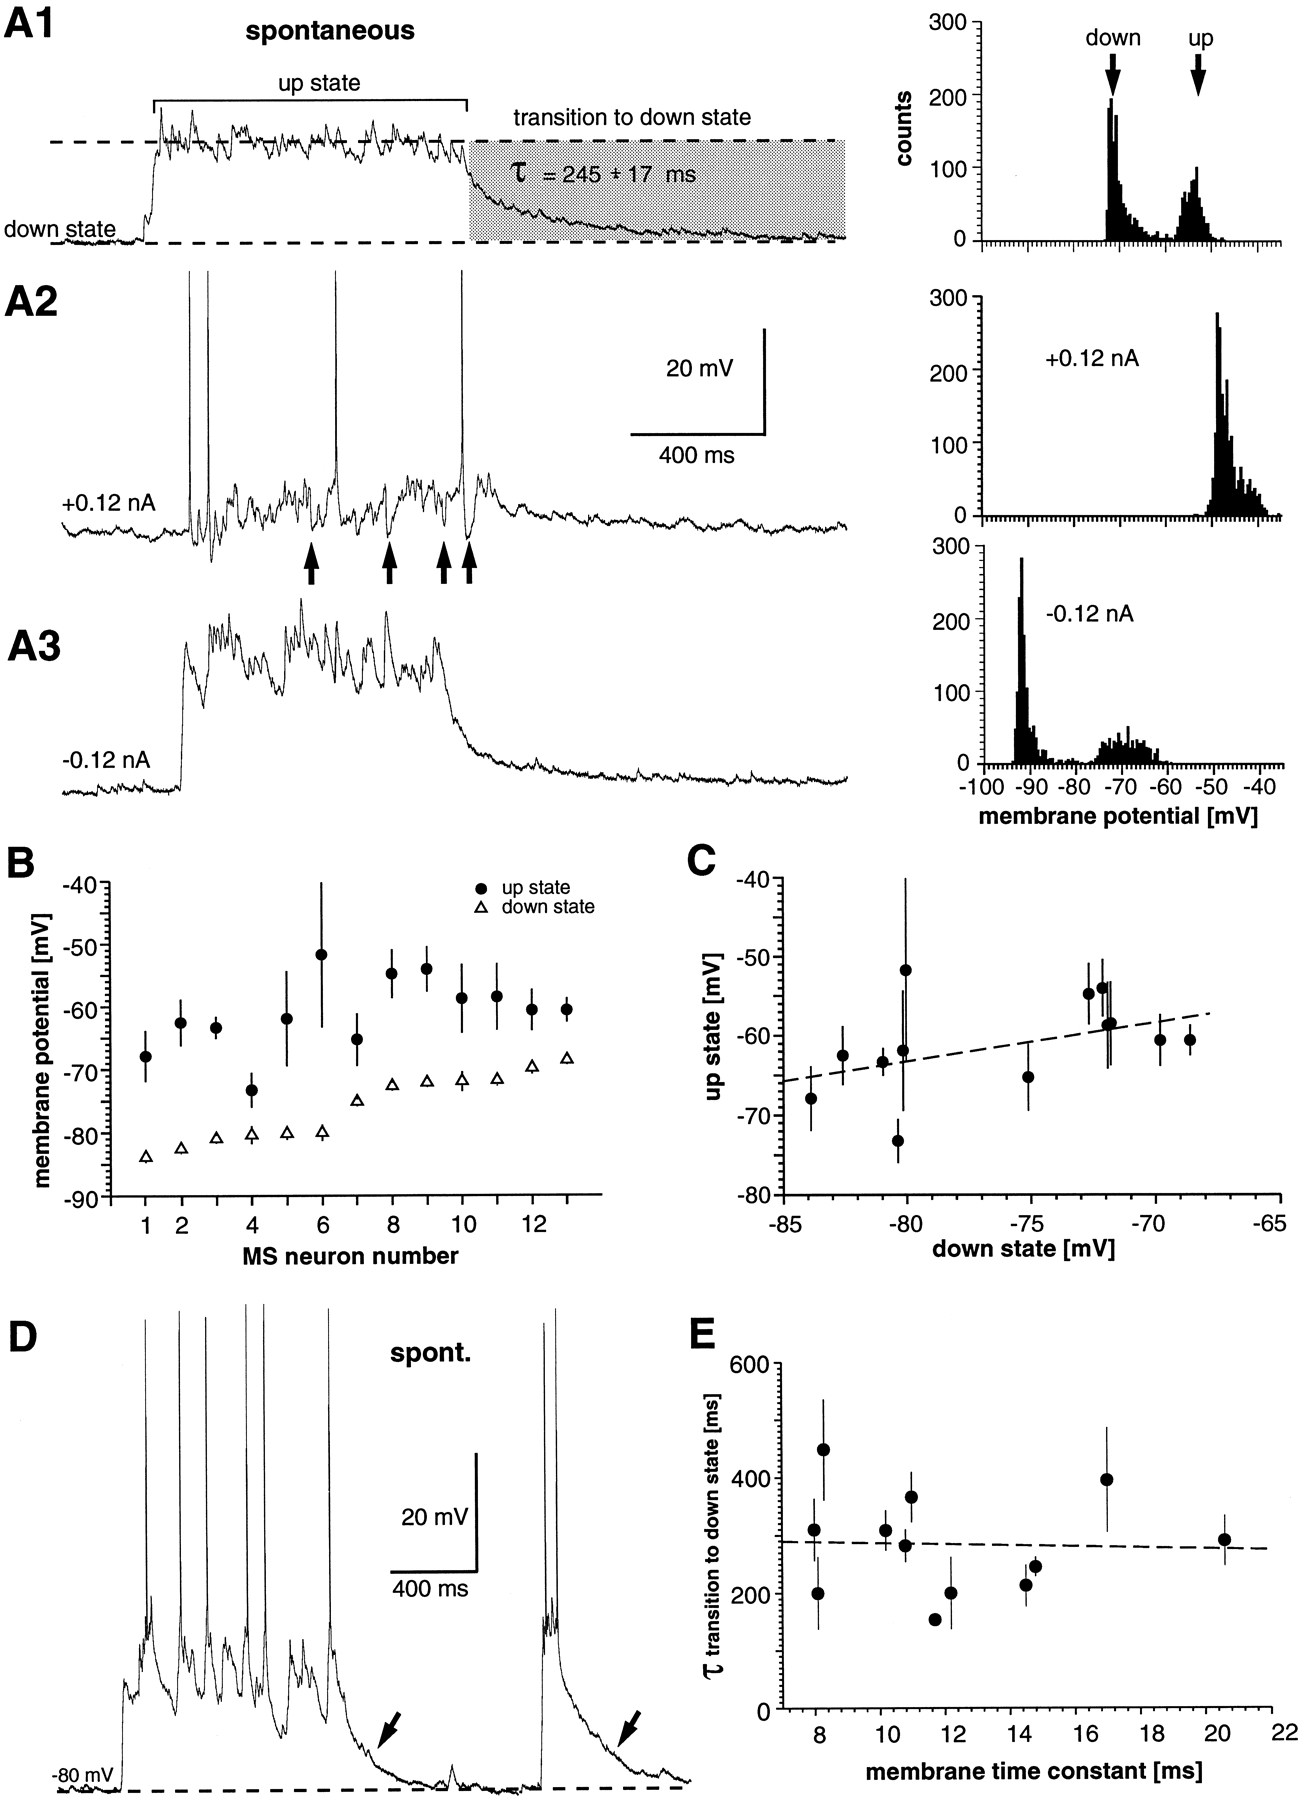
Up and down states in cultured striatal MS neurons during spontaneous activity. A1–A3, Spontaneous activity in an MS neuron (left) and corresponding membrane potential distributions (right) (51 DIV).A1, Spontaneous activity in the absence of steady state current injections. From resting level (down state), the neuron experiences a relatively fast transition to a depolarized membrane potential (up state). During the up state, the membrane potential is restricted within a narrow membrane potential range. The transition to the down state is slow and can be fitted to a single exponential function (see Results). A2, Depolarizing steady state current injections shift both states to more-depolarized levels and lead to irregular, single spike discharge during spontaneous activity. Note the occasional presence of large hyperpolarizing membrane potential deflections during spontaneous activity (arrows). A3, Hyperpolarizing steady state current injections that shift both states to more-hyperpolarized levels and enhance the membrane fluctuations during the up state.B, Plot of the mean and the width of the Gaussian functions that were fitted to membrane potential distributions obtained from 2 sec periods of spontaneous activity for all MS neurons. These periods included ∼1 sec of a down state period followed by ∼1 sec of an up state period. Paired values are ordered with respect to their mean down state value. C, Scatter plot for the mean down state in MS neurons and their corresponding up state value (mean and width of the Gaussian-fitting function). D, MS neuron (48 DIV) that fired spontaneously (spont.) during up states. Note that the long-lasting transition to the down state is present even after very short-lasting up states (arrows). E, No correlation is present between the time constant for the transition to the down state and the membrane time constant of a neuron. Data are averages from three transitions to the down state for each neuron. Broken lines in C and E indicate the best fit estimated by linear regression analysis.
This characteristic time course of spontaneous activity in MS neurons resulted in a typical bimodal membrane potential distribution, i.e., a very polarized peak corresponding to the resting potential (down state) and a second peak, which was clearly separated from the first peak, representing the more-depolarized up state (Fig.8A1). Both states could be shifted by steady state depolarizing and hyperpolarizing current injections (Fig.8A2,A3).
For further statistical analysis, membrane potential distributions from representative spontaneous activity periods were calculated for all neurons. Each spontaneous activity period examined over 2 sec showed ∼1 sec of a down state period followed by a spontaneous up state period. The bimodal distributions of down and up states were fitted to two Gaussian functions (n = 13 neurons; Fig.8B,C). The down and up states had mean values of −76 ± 1.5 and −61 ± 1.6 mV, respectively. The average SDs for the Gaussian functions were 0.9 ± 0.1 mV for the down state and 2.3 ± 0.4 mV for the up state. There was a slight correlation between the average membrane potential of a down state and its corresponding up state value, i.e., neurons with a more-depolarized down state also had a more-depolarized up state (r = 0.45; Fig.8B,C).
The transition to the up state was fast and occurred within 20–100 msec, whereas the transition to the down state was slow and could be fitted to a single exponential function. The time constant was 259 ± 23 msec (range, 153–395; n = 12). This time constant did not depend on the length of the up state period (Fig.8D) and was not correlated with the membrane time constant of a neuron (r = −0.04; n = 12; Fig. 8E). Spike discharge during the up state was rarely present, but if it occurred, it was irregular and at low rates (Fig. 8D; see Fig. 11C). The spontaneous activity of MS neurons was completely blocked by bath application of 10 μm CNQX (n = 4; Fig.9).

Spontaneous up states in an MS neuron are completely blocked by bath application of the glutamate antagonistCNQX (56 DIV).
Spontaneous activity of striatal FS interneurons
Spontaneous activity of FS interneurons was characterized by depolarized periods during which the neuron fired single spikes, spike doublets, or brief spike bursts (Figs.10A,B,11A1–A3). This spontaneous firing pattern was reflected in the spike INTH and AC as an early peak at 7 ± 4 msec (8 out of 12 neurons; Fig. 10C). This early peak was followed by a strong decrement in spiking probability after 20–50 msec in the AC (Fig.10C). The average firing rate during spontaneous depolarizations was 16.1 ± 3.4 spikes/sec (n = 12).

Spontaneous activity in cultured striatal FS interneurons. A, FS interneuron fires spontaneously even during brief spontaneous depolarizations (32 DIV). B, During long-lasting periods of spontaneous activity, the membrane potential in FS interneurons is depolarized and shows strong fluctuations. Neurons predominantly display irregular single spikes, spike doublets, or brief bursts (30 DIV). C,INTH and AC of spontaneous spike discharge for the neuron shown in A andB. D, Membrane potential distribution of the period indicated by a bracket in B. Note that despite the relatively moderate average depolarization during spontaneous activity, the membrane potential distribution is clearly bimodal, a polarized peak corresponding to the resting potential and a more-depolarized peak resulting from spontaneous depolarization.E, Membrane potential distributions from periods of spontaneous activity for all MS neurons and FS interneurons examined. Note that membrane potential distributions from MS neurons are more narrow than that from FS interneurons.

Up states in striatal MS neurons and their correlation with spontaneous activity in FS interneurons during simultaneous intracellular recordings. A1, Spontaneous activity in both neurons is characterized by correlated periods of depolarization that are interspersed by periods with very low visible activity (40 DIV). Although the FS interneuron fires spontaneously during depolarized periods, the MS neuron is mainly depolarized to the up state and does not spike. A2, Enlarged view from A1. Note the differences at the end of each activity period for both neurons. While the activity of the FS interneuron has stopped, the MS neuron is still depolarized and eventually reaches resting potential (arrowheads). A3, Enlarged view from A2. Note the high frequency fluctuations in the FS interneuron, which are not paralleled during the early period of the up state in the MS neuron. However, correlated activity in the low frequency range is visible in particular during the end of an up state. B, Membrane potential distribution of spontaneous activity for both neurons (traces fromA2). Note that the membrane potential distribution for the depolarized periods is much broader in the FS interneuron than in the MS neuron. C, Example of the spontaneous spiking activity of the MS neuron during an up state. D, Spike-triggered averages from the FS interneuron toward the MS neuron and its own membrane potential for three consecutive periods of 15 sec, each taken from the traces shown in A1. Note the strong correlation between both neurons. Neurons were not connected monosynaptically. E, The correlation in input activity between FS interneurons and MS neurons that is particularly visible if the FS neuron is hyperpolarized by steady state current injections (49 DIV).
For statistical analysis of the subthreshold membrane potential, membrane potential distributions were calculated from 1 sec periods that covered both spontaneous depolarized periods and periods with no spontaneous activity visible (9 out of 12 neurons; Fig.10B). For this analysis, only FS interneurons that showed spontaneous activity periods during which the neuron fired only a few spikes, or no spike, were used. Most (7/9) of the distributions of the membrane potential were bimodal with a first peak at the resting potential level and a second more-depolarized and much broader peak resulting from the spontaneous depolarization (Fig.10D). Both peaks were fitted to Gaussian functions that had mean values of −64 ± 2.2 and −57.8 ± 1.5 mV, respectively. The average SDs for the Gaussian functions were 0.8 ± 0.3 mV for the resting state and 5.3 ± 0.4 mV for the depolarized periods.
To compare spontaneous depolarized periods from MS neurons and FS interneurons further, we calculated membrane potential distributions from the first 500 msec of spontaneous activity periods for both neuronal classes (0.5 msec time resolution; Fig.10E). This analysis revealed that the average depolarization during spontaneous activity was −61.7 ± 1.7 mV in MS neurons (up state; n = 9) and −57.9 ± 1.6 mV in FS interneurons (n = 9). No statistical difference was observed between these two classes. In contrast, the average SD of the membrane potential during spontaneous activity (2.3 ± 0.3 mV for MS neurons and 4.2 ± 0.4 mV for FS interneurons) was highly significantly different for both classes (one-way ANOVA;p < 0.005).
Thus, whereas both neuronal classes depolarized spontaneously to a similar average membrane potential, the amplitude of the membrane potential fluctuation during spontaneous activity in FS interneurons was twice that seen in MS neurons.
Correlation in spontaneous striatal activity between MS neurons and FS interneurons
Simultaneous intracellular recordings from striatal MS neurons and FS interneurons were obtained in four cases (Fig. 11). Analysis of the membrane potentials indicated that the up state in MS neurons was strongly correlated with depolarized activity periods in FS interneurons. Both neuronal types became simultaneously depolarized and showed increased membrane potential fluctuations during similar lengths of periods. However, two differences were found in the overall time courses. First, MS neurons only fired occasionally single spikes during the up state, whereas FS interneurons fired more often during depolarized periods (Fig. 11A1–A3). Second, the transition to the down state in MS neurons was still incomplete when the membrane potential in FS interneurons had returned to its original resting potential (Fig. 11A2).
Also, the observations from these simultaneous recordings were in agreement with our results obtained from single intracellular recordings. That is, spontaneous membrane potential fluctuations during the up state in MS neurons were much smaller than the fluctuations from corresponding membrane potential periods in the FS interneuron (Fig.11A3,B).
The correlation of neuronal activity between MS and FS neurons was further studied using spike-triggered averaging. These studies revealed that spontaneous spike discharge in FS interneurons was correlated with simultaneous depolarizations in MS neurons (n = 4; Fig.11D). Furthermore, the similarities in the membrane potential for both neuronal classes were particularly evident during those spontaneous activity periods when the membrane potential in MS neurons did not completely reach the up state and when the FS interneuron was prevented from spiking by steady state hyperpolarizing currents (Fig. 11E).
To analyze the correlation in membrane potential during spontaneous depolarizations, we used cross-correlation analysis. For each pair of neurons, membrane potential periods of 800 msec in duration were taken from spontaneous activity periods. Then, the power spectrum was calculated for individual traces, and the cross-correlation function was calculated for corresponding membrane potentials from both neurons. The average membrane potential depolarization for all four pairs examined was −61 ± 2 and −54 ± 3 mV for MS and FS neurons, respectively.
This analysis revealed that the membrane potential of MS and FS neurons always revealed prominent frequency components below 15–20 Hz during spontaneous depolarization (n = 4; Fig.12A,B). Above this frequency range, the power spectrum showed no significant frequency components for either MS or FS neurons. Cross-correlation analysis showed that the membrane potential between MS and FS neurons was correlated during spontaneous depolarizations. This correlation was evident in the recording between a single pair as well as in the average correlation for all four pairs (Fig.12C,D). The cross-correlation function was strongly positive within a window of ± 50 msec around zero time shift and steeply dropped to small values outside this range. In general, FS neurons were phase-advanced by ∼10 msec with respect to MS neurons.

Correlated activity in FS and MS neurons during up state periods. A, Power spectrum of the corresponding membrane potential traces in an FS neuron. Note that during spontaneous activity, mainly frequency components below 10–15 Hz are present. B, Power spectrum of the membrane potential during up state periods in the simultaneously recorded MS neuron. Nine periods (800 msec in duration) were analyzed and averaged (mean ± SD). C, Average cross-correlation function between the MS and the FS neuron for the nine spontaneously depolarized periods analyzed in A andB. Strong correlation exists in the range of 0 ± 50 msec. The average depolarization during spontaneous activity was −56 and −60 mV for the FS and MS neurons, respectively. Nine cross-correlation functions were averaged. The gray areaindicates SD. D, Average cross-correlation function for all four simultaneously recorded MS and FS neuronal pairs. Each cross-correlation function per pair was based on five to nine spontaneously depolarized periods (>500 msec). The gray area indicates SD.
Monosynaptic inhibitory connection from an FS interneuron to an MS neuron
In one out of four paired recordings, we found a monosynaptic connection from the FS interneuron to the MS neuron. The postsynaptic potential (PSP) was recorded from the MS neuron in response to a single spike of the FS interneuron. The PSP was hyperpolarizing near spike threshold, was reversed in polarity at −56 mV, and was depolarizing at the resting potential (Fig.13A). At rest, the PSP reached maximal amplitude within 10 msec. The decay time course could be fitted to a double exponential decay with time constants of 23 and 82 msec (Fig. 13B1,B2). Each single spike of the FS interneuron was followed reliably by a corresponding PSP in the MS neuron, even at high firing frequencies. However, the synaptic connection showed a pronounced depression of PSP amplitude during the first 100 msec (Fig. 13C).

FS interneurons inhibit MS neurons via a fast monosynaptic connection. A, The reversal of the fast monosynaptic connection from an FS interneuron to an MS neuron (49 DIV). Each response is an average from four action potentials.B1, Time course of the synaptic event elicited by a single spike of the FS interneuron. The decay could be fitted to two exponential time courses. B2, The first 25 msec of the postsynaptic response in the MS neurons after a single spike in the FS neurons, an enlargement from B1. The time derivative of the membrane potential (five point smoothing enabled) clearly shows two peaks. C, PSPs in the MS neuron under steady state hyperpolarizing (bottom) and depolarizing (top) conditions. The FS interneuron was depolarized by constant current pulses of 200 msec in duration and fired spikes at high frequencies (dots). The PSPs showed a strong depression during the first 100 msec.
DISCUSSION
Cortex–striatum–substantia nigra organotypic cultures
Recently, cortex–striatum organotypic cocultures have been introduced to study corticostriatal processing in vitro(Plenz and Aertsen, 1996a,b). In the present study, this coculture system was extended to include the substantia nigra, making it a cortex–striatum–substantia nigra triple culture. The length of culturing was extended to 6–7 weeks in vitro to ensure maturation of the involved tissues (Plenz and Kitai, 1996a). Furthermore, the extracellular potassium concentration was lowered from 5.8 to 2.8 mm to match the [K+]o used in most in vitrostudies. The dense striatal innervation by TH-IR fibers from the substantia nigra is in agreement with earlier reports using organotypic cultures (Ostergaard et al., 1990; Holmes et al., 1995).
Despite the differences in dopamine inputs, age, and [K+]o, remarkably similar qualitative neuronal activities are present in both culture systems. In both systems, striatal neuronal activity is characterized by depolarized periods separated by periods with no activity. Furthermore, in both systems striatal MS neurons show similar up states that have been described in vivo (Wilson and Kawaguchi, 1996; Stern et al., 1997; see also below), and FS neurons spontaneously burst with no distinct up state visible (Plenz and Aertsen, 1996a,b; see also below). However, in contrast to the observations in cocultures, most MS neurons did not spontaneously discharge during the up state. This difference might be a combined effect of the differences in the [K+]o used and in the increased threshold of MS neurons by dopamine (Calabresi et al., 1987; Surmeier and Kitai, 1993). To summarize, the additional dopamine inputs did not qualitatively change the basic neuronal activity patterns that are characteristic for striatal MS neurons and FS interneurons. Nevertheless, the triple culture system introduced in the present study is a more mature in vitro system. This system allows for studying the effects of cortical glutamate inputs and nigral dopamine inputs on striatal neurons in the presence of up states in MS neurons.
CS projection neurons
The most prominent corticostriatal projection neuron is characterized by its medium-sized cell body (Wise and Jones, 1977), its small basal dendritic field, a sparsely branched apical dendrite, and extensive axonal arborization in the cortex and the striatum (Wilson, 1987; Cowan and Wilson, 1994; Plenz and Aertsen, 1996a). In the rat somatosensory cortex in vivo (Schwab et al., 1977; Wise and Jones, 1977) and in vitro (Plenz and Aertsen, 1996a), these CS projection neurons are mainly situated in infragranular layer V.
Extracellular recordings in the behaving monkey demonstrated that CS projection neurons fire differently than do the bursting “pyramidal tract” neurons (Bauswein et al., 1989). This is supported by intracellular recordings in vivo that showed that the main corticostriatal projection neurons are regular spiking pyramidal neurons (Cowan and Wilson, 1994). Our cultured CS projection neurons were quite similar to these neurons with respect to their cortical location and morphological and electrophysiological characteristics described previously.
Striatal MS projection neurons
Studies using the Golgi technique (Chang et al., 1982) and intracellular labeling with HRP (Kitai et al., 1976; Preston et al., 1980; Wilson and Groves, 1980; Bishop et al., 1982; Penny et al., 1988) or biocytin (Kawaguchi et al., 1989) demonstrated the morphology of neostriatal MS neurons. These neurons have a cell body ∼15–18 μm in diameter and an approximately spherical dendritic tree with an average diameter of up to 300 μm. The dendrites are densely covered with spines except for the proximal primary dendrites (Wilson et al., 1983; Wilson, 1992). Their axonal projection is characterized by one main projection axon and local axonal collaterals (Chang et al., 1981) that are ramifying mostly within the dendritic field (Bolam et al., 1981; Penny et al., 1988; Kawaguchi et al., 1989, 1990). In the triple cultures, MS neurons showed similar morphological characteristics. They had a small cell body, a spherical dendritic tree, dendrites covered with spines except for the proximal dendrite, and a main axon that gave off many local axon collaterals.
Furthermore, the cultured MS neurons showed the basic nonlinear electrophysiological characteristics described in vivo and in the acute slice preparation (Kita et al., 1984; Calabresi et al., 1987, 1990a,b; Bargas et al., 1988; Kawaguchi et al., 1989; Jiang and North, 1991; Wilson, 1992; Galarraga et al., 1994; Nisenbaum et al., 1994; Nisenbaum and Wilson, 1995). In vivo, MS neurons have at least three different types of A current (Surmeier et al., 1988,1989; Bargas et al., 1989; Nisenbaum and Wilson, 1995) that develop during the first few weeks postnatal (Surmeier et al., 1991; Tepper and Trent, 1993). The strong outward rectification present after early depolarization indicates that these A currents have matured in the cultured MS neurons. In addition, the cultured MS neurons displayed an anomalous rectification after hyperpolarization. Finally, the regular firing without strong spike adaptation during constant current injections was similar to that described in the acute neostriatal slice (Kawaguchi et al., 1989) and in vivo (Calabresi et al., 1990a).
Striatal FS GABA interneurons
The relatively large cell body and the distinct dendritic arborization of the FS interneurons described in this study correlate well with the morphology of strongly parvalbumin-immunoreactive neuronsin vivo (Kita et al., 1990; Chang and Kita, 1992) and in cortex–striatum cocultures in vitro (Plenz and Aertsen, 1996a). This morphology also corresponds with the morphology of GABA FS interneurons (Kita and Kitai, 1988; Kawaguchi, 1993) and the type V interneuron described by Chang et al. (1982).
In slices (Kawaguchi, 1993) and in cocultures (Plenz and Aertsen, 1996a), the steady state current–voltage relationship of striatal FS interneurons is almost linear, and after depolarizing current injections, these neurons fire at high frequencies with occasional brief pauses. Furthermore, striatal GABA interneurons fire in bursts in response to evoked cortical inputs in vivo (Kita, 1993), in acute slices (Kawaguchi, 1993), and in cocultures (Plenz and Aertsen, 1996b). A relatively weak rectification, high frequency discharge, and abrupt burst onset and offset and onset were also the hallmarks of the striatal FS interneurons in our triple culture preparation. In addition, we described a monosynaptic connection from the FS interneuron to the MS neuron. This PSP reversed in a potential range indicative for a GABAA-, chloride-mediated synapse (Misgeld et al., 1982). These morphological and electrophysiological characteristics of the triple-cultured FS interneurons strongly support the view that these neurons are striatal FS GABA interneurons as described in vivo.
Up and down states in MS neurons in vivo and in the triple cultures
In vivo spontaneous intracellular activity in MS neurons is characterized by polarized periods (down states) interrupted by depolarized periods to the subthreshold range of approximately −51 mV (up state; Stern et al., 1997) from which spikes may arise (Wilson, 1993; Wilson and Kawaguchi, 1996). The transitions to the up or down states occur relatively fast with an additional long-lasting decay toward the end of the down state transition (see Wilson and Kawaguchi, 1996, their Fig. 4).
These basic characteristics of up and down states were clearly present in the MS neurons in this study. The average spontaneous depolarization in MS neurons was at −60 mV, the transitions to the up state were relatively fast, and the transition to the down state showed a distinct long-lasting decay toward the end. This decay was not observed in FS interneurons and was not related to the membrane time constant. Thus, it might represent an outstanding feature of MS neurons. Strong differences exist with respect to the occurrences and durations of down states in vivo and in triple cultures. In vivo, down states occur much more often, and their durations are shorter (less than several hundred milliseconds; Stern et al., 1997) than in the triple cultures in which down state durations regularly exceed many seconds. This may be because of differences in the patterns of cortical activity that in triple cultures are not structured by thalamic inputs.
Correlated activity in medium spiny neurons and fast-spiking interneurons
Spontaneous neuronal activity in FS interneurons resulted in clearly bimodal membrane potential distributions with an average membrane potential depolarization similar to that in MS neurons during spontaneous activity. However, a clear up state was only present in MS neurons. Spontaneous intracellular activity from morphologically reconstructed FS interneurons has not been recorded in vivo, and thus no further comparison can be made (see, however, Plenz and Aertsen, 1996b).
Despite the differences in the general activity patterns between FS and MS neurons, the present results from simultaneous recordings demonstrate that within the low frequency range (<12 Hz) the neuronal activity of FS and MS neurons is strongly correlated. On a timescale of several hundred milliseconds, FS interneurons were always depolarized when MS neurons were in the up state. Furthermore, on a timescale of several dozen milliseconds during depolarized periods, brief depolarizations in MS neurons were also present in FS neurons. In vivo, similar types of correlations have been found between pairs of MS neurons intracellularly recorded in the anesthetized rat (Stern et al., 1996). Such a type of correlation most likely results from common cortical inputs; in vivo, MS neurons receive direct cortical inputs with one corticostriatal projection neuron contacting many MS neurons (Kincaid et al., 1995). Furthermore, corticostriatal axons synapse on striatal FS interneurons that in turn innervate MS neurons (Bolam et al., 1985; Lapper et al., 1992; Kita, 1993; Bennett and Bolam, 1994). Interestingly, no significant frequency components >20 Hz (γ-oscillations) were found during spontaneous activity for both classes of striatal neurons. This agrees with previous studies showing that γ-oscillations in the cortical culture are also absent during spontaneous activity but appear when the cortical culture is stimulated by a brief electrical shock (Plenz and Kitai, 1996b).
When the up state in MS neurons is below the reversal potential of GABAA inputs, inhibition from FS interneurons results in depolarization of MS neurons. Thus, these inputs will add to a positive correlation resulting from common, depolarizing cortical inputs. Furthermore, common inputs should be particularly prominent when the influence of early outwardly rectifying currents in both neurons are inactivated. These interpretations are supported by the present data that show strong correlated activity when both neurons were relatively hyperpolarized from −60 mV (Fig. 11E) or toward the end of up states when A currents were ceased (Fig.11A3).
Conclusions
The present findings indicate that striatal MS neurons and FS interneurons receive common cortical inputs and that FS interneurons fire while MS neurons are in the up state. This arrangement ensures that the cortex can control MS neuron discharge during the up state via FS interneurons.
The cortex–striatum–substantia nigra organotypic culture is a valuable in vitro model that captures the main features of the corticostriatal and nigrostriatal pathway in vitro. Individual neuronal classes such as CS projection neurons, striatal MS neurons, and FS interneurons display similar morphological and physiological characteristics as reported in vivo. At the neuronal system level, up states that are a distinct intracellular neuronal feature of striatal MS neurons in vivo are also present in this in vitro system. Thus, because of itsin vitro nature, the present model may be useful to test hypothesis on neuronal interactions that at present can only be suggested from in vivo results.
Footnotes
This study was supported by grants from the National Institute of Neurological Disorders and Stroke (NS-20702 and NS-26473). D.P. received a fellowship from the Deutsche Forschungsgemeinschaft. We thank Dr. Bin Teng for expert technical assistance with the preparation of cultures, immunohistochemistry, and neuroanatomical reconstructions. We wish to express our gratitude to Drs. C. Richards and M. Herrera-Marschitz for critical reading of earlier versions of this manuscript.
Correspondence should be addressed to Dr. S. T. Kitai, University of Tennessee, College of Medicine, Departments of Anatomy and Neurobiology, 875 Monroe Avenue, Memphis, TN 38163.


