

Abstract
Although intercellular Ca2+ waves resemble spreading depression (SD) and occur in hippocampal organ cultures (HOTCs), SD has not been reported in these cultures. Accordingly, electrophysiological and Ca2+ imaging techniques were used to examine potential interrelations between Ca2+ waves and electrophysiological changes of SD. Our results show, for the first time, that HOTCs can support SD. Furthermore, two distinct Ca2+ waves were found to precede SD. The first traveled >100 μm/sec along the pyramidal cell dendritic layer. The second subsequently traveled mostly perpendicular to the pyramidal cell layer from CA3 (or CA1) but also in all directions from its area of initiation. This second, slower wave spread with the interstitial DC change of SD at millimeters per minute but always ahead of it by 6–16 sec. Heptanol, which uncouples gap junctions, blocked both of these Ca2+ waves and SD. Thus, two types of Ca2+ waves occur with the initiation and propagation of SD. The first might reflect interneuronal changes linked by gap junctions, whereas the second might stem from interastrocyte changes linked via similar connections. Because individual cells can be followed in space and time for protracted periods in HOTCs, this preparation may be ideal for studies designed to explore not only the mechanisms of SD but also the long-term consequences of SD, such as ischemic tolerance.
- calcium waves
- spreading depression
- hippocampal organ cultures
- ischemic tolerance
- astrocytes
- calcium-sensitive dyes
- Fluo-3
Slowly propagating intracellular and intercellular Ca2+ waves are a recently recognized phenomenon of neural cells (Cornell-Bell et al., 1990; Charles et al., 1991, 1992, 1996; Cornell-Bell and Finkbeiner, 1991; Finkbeiner, 1992;Enkvist and McCarthy, 1994) and tissues (Dani et al., 1992; Newman and Zahs, 1997), which may be a concomitant of spreading depression (SD) (Nedergaard, 1994). Given the widespread potential signaling capacities of Ca2+ waves (Nedergaard, 1994; Parpura et al., 1994), their detailed study may be a particularly fruitful means to advance the understanding of SD. Ca2+ waves occur within astrocytes and between astrocytes for distances that extend up to 200 μm (Newman and Zahs, 1997; Wang et al., 1997). They also occur among neurons. Neuronal Ca2+ waves propagate ∼10 times faster (Charles et al., 1996) than the propagation velocity of SD, so their relation to SD is particularly uncertain. Indeed, the relation of Ca2+ waves to SD has only begun to be defined (Nedergaard et al., 1995). Intercellular Ca2+ waves have not been associated with the electrophysiological criteria of SD. SD classically is defined by electrophysiological criteria as a propagating wave (i.e., 1–6 mm/min) of evoked or spontaneous silence in neuronal fast electrical activity that is associated with a large negative DC potential (Leão, 1944; Bureś et al., 1974).
We have developed a highly reproducible model of SD in hippocampal organ cultures (HOTCs) and show, for the first time, that these cultures can elicit recurrent episodes of SD for hours without persistent compromise to normal evoked polysynaptic electrical activity. Furthermore, simultaneous electrophysiological and Ca2+ imaging measurements show that electrical initiation of SD is associated with a fast (>100 μm/sec) wave of Ca2+ rise that moves along the pyramidal cell basilar dendritic layer before electrophysiological changes of SD begin. This wave may reflect changes between neurons (Herreras et al., 1994; Charles et al., 1996). Then a second, slower Ca2+ wave precedes the electrophysiological changes of SD by seconds but propagates at the speed of SD (mm/min), mostly perpendicular to the pyramidal cell layer from a focus in CA3 (or less often CA1). The latter Ca2+ waves are reminiscent of those seen among astrocytes. Exposure of HOTCs to glutamate, which evokes Ca2+ waves, failed to induce any electrophysiological changes of SD. Finally heptanol, which inhibits gap junctions, inhibited Ca2+ waves and SD. Thus, Ca2+ waves may be part of second messenger cascades that influence the initiation as well as the propagation of SD.
This work has appeared in abstract form (Kunkler and Kraig, 1997b).
MATERIALS AND METHODS
HOTC preparation and maintenance. Preparation and maintenance of the HOTCs have been described previously (Kunkler and Kraig, 1997a). Briefly, Wistar rat pups (6–9 d old) were decapitated after halothane anesthesia; the brains were removed and placed into cooled (3°C) HBSS supplemented with d-glucose (6.5 mg/ml). Hippocampi were isolated, placed on agar-coated (3.5% in 150 mm NaCl) Teflon plates, and sectioned perpendicularly to their septotemporal axis (400 μm thick). Slices that displayed an intact dentate gyrus (DG) and pyramidal cell layer were transferred to uncoated 30 mm Millicell-CM tissue culture inserts (Millipore, Bedford, MA) in six-well culture dishes (Becton Dickinson, Lincoln Park, NJ). The medium around HOTCs was replaced twice per week (1.2 ml) and contained Eagle’s basal medium (50%), Earle’s balanced salt solution (25%), horse serum (23%), 25 U/ml penicillin/streptomycin, and 1 mml-glutamine, supplemented with additional d-glucose to a final concentration of 7.5 mg/ml. All tissue culture reagents were obtained from Life Technologies (Grand Island, NY). Slices were maintained at 37°C with 5% CO2/balanced humidified air in a standard incubator (Heraeus Instruments, South Plainfield, NJ) for >3 weeks.
HOTC loading with Fluo-3. HOTCs were loaded with the fluorescent calcium indicator Fluo-3 acetoxymethyl (AM) ester (Molecular Probes, Eugene, OR) in a HEPES buffer [containing (in mm) 10 HEPES, 25 dextrose, 137 NaCl, 5.3 KCl, 3 CaCl2, and 1 MgCl2, pH 7.4] (van den Pol et al., 1992). The dye (50 μg/vial) was dissolved in 10 μl DMSO/Pluronic F-127 (2% w/v) and added to the HEPES buffer to achieve a final concentration of 2 μm. To facilitate Fluo-3 loading, we placed the solution under the insert (1.2 ml); we placed an additional 0.5 ml on top. Dye penetration into HOTCs was enhanced further by gentle tilting (0.1 Hz) of the culture dish on a rocker platform at room temperature during loading. After a 30 min incubation, free dye was washed out with three rinses of HEPES buffer over 30 min while the rocking continued. The HOTC, with its insert, was transferred to a 35 mm culture dish and perfused with recording solution (see below) at 36 ± 1°C for an additional 30 min before use.
Electrical stimulation. For electrophysiological studies, HOTCs (maintained in vitro for 21–60 d) were placed in 35 mm culture dishes mounted in a movable open perfusion microincubator (PDMI-2; Medical Systems, Greenvale, NY) on an inverted microscope (Flouvert UV; Leica Mikroskopie und Systeme GmbH, Wetzlar, Germany). The cultures were perfused (1 ml/min) with a normal Ringer’s solution of (in mm): 124 NaCl, 2 KCl, 26 NaHCO3, 2.5 CaCl2, 1 MgCl2, 1.25 KH2PO4, and 6 glucose, adjusted to pH 7.4 with 5% CO2/95% O2. Normal Ringer’s also contained 25 μmisoproterenol (ISO). Stock solutions of ISO (100 mm) were prepared freshly and protected from the light. After being superfused within the insert for 30 min to rinse excess dye further, the Ringer’s solution was directed outside (i.e., around and beneath) the insert and continued to flow at 1–2 ml/min. Next, an interstitial microelectrode (tip diameter 4–6 μm) filled with 150 mm NaCl was driven into the culture with a hydraulic micromanipulator (WR60; U.S. Narishige, Sea Cliff, NY). A bipolar [90% platinum/10% iridium twisted Teflon insulated wire (125 μm diameter; number 7780, A-M Systems; Everett, WA)] stimulating electrode was placed on top of the DG immediately inside the genu. A 1 m KCl agar bridge ground electrode was placed outside the insert in the perfusate. Stimulating pulses were 200 μsec in duration and 20–100 V. HOTCs with evoked CA3 field potentials of 2 mV or less were not used. To enhance the interstitial DC signal, we gently “wicked” the recording solution off the surface of the insert next to HOTCs, using cotton-tipped applicators. To prevent dehydration, we then immediately covered the HOTCs with a layer of light mineral oil. This procedure enhanced the interstitial DC field potential signals by two- to threefold. HOTCs were allowed to equilibrate with perfusion beneath the insert for 30 min before experimental procedures.
Interstitial DC signals were monitored via an A-1 Axoprobe amplifier system (Axon Instruments, Foster City, CA), digitized with a 1200 series Digidata system (Axon Instruments), and processed with Axoscope software (version 1.1; Axon Instruments). Separate 486 AST computers (AST Research, Irvine, CA) were used to acquire fast and slow signals. Fast evoked signals were sampled every 100 μsec; slow potential recordings were sampled every 0.1–5 msec. For propagation velocity measurements a microelectrode array was created, which consisted of three glass microelectrodes glued so that their tips were 100 μm apart in the horizontal plane. Field potential and slow potential records were analyzed with Axoscope software. All field potential figures and slow potential figures were composed with Origin (version 5.0; Microcal Software, Northampton, MA) and CorelDraw software (version 5.0; Corel, Ontario, Canada). Field potential records were smoothed by a Savitzky–Golay smoothing filter @ 13 pts in Origin.
Spreading depression induction. To initiate SD, we switched the recording solution to a modified Ringer’s solution in which NaCl was replaced with a millimolar equivalent of NaAc, pH 7.60 (Bureśet al., 1974). In addition, NaAc–Ringer’s contained 25 μm ISO. This modified Ringer’s was pulsed on for 90–120 sec, and a SD episode was initiated with a single pulse from the bipolar stimulus electrode placed in the DG immediately after the perfusate was switched back to normal Ringer’s. SD episodes were induced every 10–15 min to simulate SD induction in in vivopreparations in neocortex (Kraig et al., 1991) and hippocampus (Kraig and Kunkler, 1997). Using this interval between SD events, we could use a single preparation for 8–10 hr. Experiments were stopped by choice, not from deterioration of the ability of an HOTC to sustain SD. Occasionally, two to three pulses of modified Ringer’s were needed initially to induce SD.
SD propagation velocities were calculated with three-microelectrode array recordings. First, for all electrode recordings, the DC deflection that coincided with the start of SD was defined as the slight positive turn in the wave that followed the initial, sharply negative spike (i.e., point 0, Fig. 6). Second, the amplitude of this point was subtracted from peak amplitude reached during SD. Third, this relative change in DC potential was multiplied by 0.75. Finally, the time points along the SD wave that corresponded to the 75th percentile of SD DC deflection were compared among the three traces, and the velocities between microelectrodes (100 μm apart) were determined.
For experiments that used heptanol, a 1 m stock solution of 1-heptanol (Sigma, St Louis, MO) in pure ethanol was prepared fresh daily and diluted into Ringer’s with sonification immediately before use (Largo et al., 1997). Final concentrations ranged from 0.75 to 3 mm. HOTCs were incubated for 30 min in the heptanol–Ringer’s solution before the initiation of SD. Control data were collected first in normal Ringer’s, followed by exposure to Ringer’s containing only vehicle (i.e., ethanol), and then in Ringer’s containing heptanol. A 20 min washout followed each concentration of heptanol, during which field potentials and SD were evoked to ensure tissue viability.
Image acquisition. Fluorescence was elicited by excitation with a 100 W mercury vapor lamp that used a standard fluorescein filter set. Electrical power for the mercury lamp was stabilized with a Topaz Escort micropower conditioner (Square D, Costa Mesa, CA). HOTCs were photographed (256 × 256 pixels) by a 12-bit cooled, charge-coupled camera (CH250; Photometrics, Tucson, AZ). The camera was run under a Windows (3.1) environment on a 486-DX50 AST computer (AST Research) with PMIS software (version 3.0; Photometrics). Electronic images were stored on a Pinnacle Micro optical drive (Sierra 1.3 GB; Pinnacle Micro, Irvine, CA). Images were acquired every 1.2 sec with either a 10 or 25× objective. To diminish the possibility of phototoxicity, we used a computer-controlled Uniblitz shutter (Vincent Associates, Rochester, NY) to reduce exposure times of cultures to ≤100 msec/photograph. The PMIS shutter output signal also was displayed on the slow potential record so that image acquisition could be correlated precisely with DC signals. Bright-field images were acquired with a 540/40 bandpass filter (Chroma Technology, Brattleboro, VT) to confirm HOTC pyramidal cell layer morphology and microelectrode tip position. Power to all electronic equipment was stabilized with an uninterruptible power system (MUPSA-1000; Philtek Power, Blaine, WA).
Image processing and analysis. Computer-based image analysis software, Image Pro Plus (version 1.3; Media Cybernectics, Silver Springs, MD), was used for the analysis of Ca2+images. For Figure 5, images were corrected by using a background reference image, which was sharpened by using a high Gaussian filter (7 × 7 pixel matrix at 50% strength and one pass), and pseudocolored. The pseudocolor palette was created in Image Pro Plus and consisted of 128 colors over a 0–255 range. For the SD composite image shown in Figure 6, individual images represent a change in fluorescence over baseline (ΔF/Fo), with the fluorescent level under normal conditions (immediately before SD initiation) serving as baseline (Fo). The images were background-corrected by using a reference file, which consisted of averaging three images that preceded the images of interest. Then the corrected images were equalized linearly, filtered with a low-pass filter to reduce high frequency noise (3 × 3 pixel matrix, at 50% strength and one pass), and pseudocolored with the same palette as that shown in Figure 5.
Analyses of normal Ca2+ fluorescent intensity fluctuations were conducted by outlining an area of interest (AOI) around individual cells and applying the AOI to subsequent images (with Image Pro software). Intensity values from each AOI were transferred to a spread sheet (Microsoft Excel version 97; Microsoft, Redmond, WA) for statistical analyses. Ca2+ propagation velocities from the SD experiments were determined by measuring the position of the leading edge of the Ca2+ fluorescence increase in successive images and calculating the Δposition/Δtime.
Preparation of illustrations. The depth profile bright-field and corresponding reference images were acquired as 12-bit images (1024 × 1024 pixels) with PMIS software, then converted to 8-bit images of analogous size, and background-corrected in Image Pro Plus. The image brightness was reduced and contrast was increased by applying brightness, contrast, and γ function values of 35, 64, and 1.0 and applying a high Gaussian filter (7 × 7 pixel matrix at 50% strength and one pass). Images then were converted to RGB files in Adobe Photoshop (version 4.0; San Jose, CA); the color balance was adjusted (100% red for shadow, medium, highlights), filtered (unsharp mask, 100%, 2.0 pixel matrix), and adjusted for brightness (+40) and contrast (+20).
Individual images shown in Figures 5 and 6 were “screen-captured” from Image Pro Plus, and composites were created in Adobe Photoshop. Final images in all instances were printed by using a dye sublimination printer (XKT-7720; Eastman Kodak, Rochester, NY).
RESULTS
Electrophysiological behavior of HOTC
The general histological organization of HOTCs (Fig.1A) is consistent with previous reports of HOTCs (Zimmer and Gähwiler, 1984;Frotscher and Gähwiler, 1988). The HOTC shown is from a culture maintained in vitro for 25 d. HOTCs used in this study were maintained in vitro for 21–35 d to help ensure that synaptic activity had reached a plateau before experimental manipulations (Buchs et al., 1993; Muller et al., 1993; Bahr, 1995). All cultures showed distinguishable CA1, CA3, and DG subfields. The CA3 pyramidal cell layer maintained a compact layer similar to that seenin vivo. In contrast to that seen in vivo, the CA1 pyramidal cells spread out to form a loosely defined layer (Kunkler and Kraig, 1997a). In addition, the infrapyramidal limb of the DG frequently was diminished in width (Zimmer and Gähwiler, 1984;Kunkler and Kraig, 1997a), yet overall the cytoarchitectural organization of HOTCs was comparable to that seen in vivo.
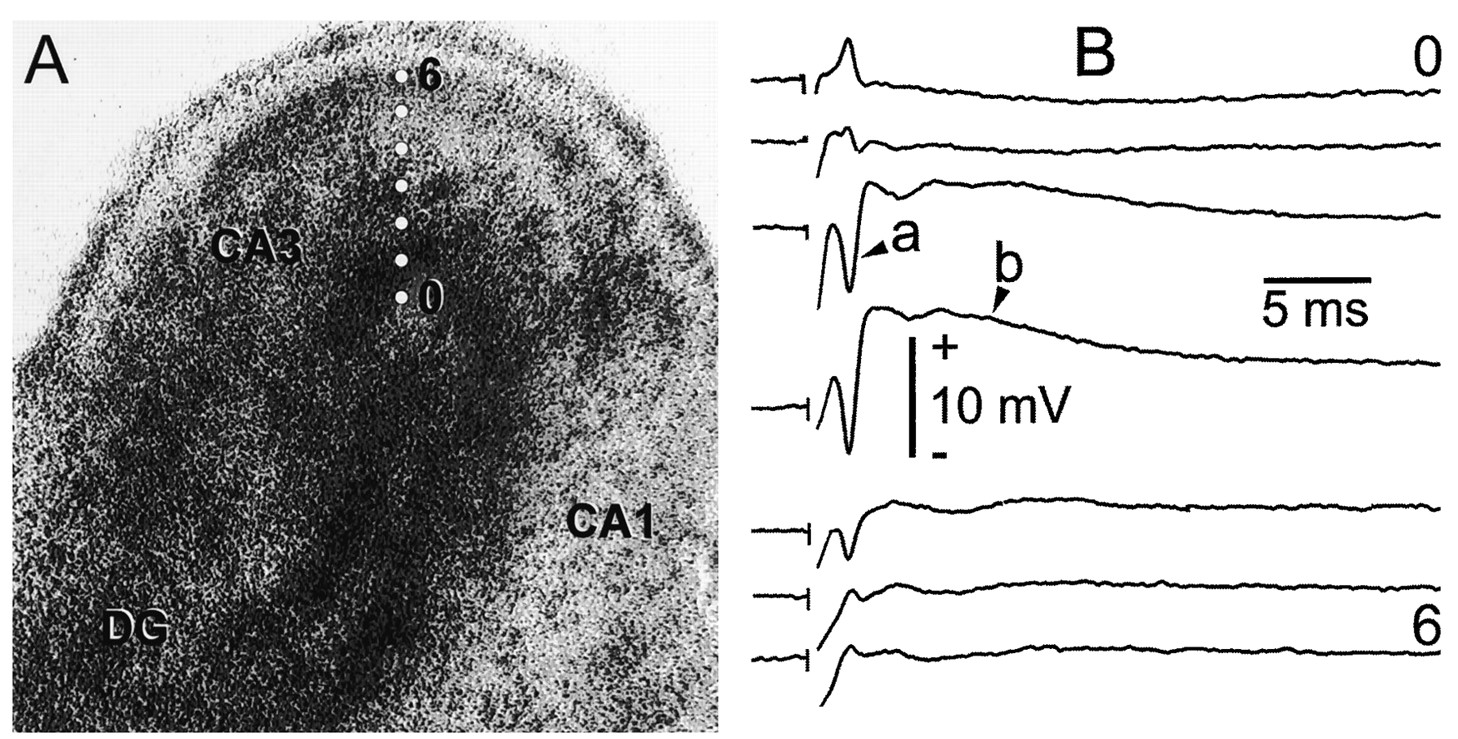
Evoked field potentials from the CA3 pyramidal cell layer. A, Low-power phase-contrast micrograph of a HOTC maintained in vitro for 25 d. The image shown is 1.9 mm wide. A bipolar stimulating electrode was placed in the hilus of the dentate gyrus (DG) for activation of mossy fiber afferents to CA3 pyramidal cells (CA3). The CA1 pyramidal cell area (CA1) is shown to theright. White dots in the CA3 area are 100 μm apart, beginning at 0 and ending at6 (e.g., total distance of 600 μm) perpendicular to the CA3 pyramidal cell layer, and represent electrode recording sites.B, Traces represent corresponding evoked field potentials recorded from the outer edge of the culture (0) to 600 μm into the culture (6). Field potentials were evoked with a 200 μsec, 50 V stimulus. DC records show the typical population spike (a) from pyramidal cell action potentials and the slower, large fEPSP of pyramidal cells (b) triggered from pyramidal cell activation. These potential changes are most evident in the third and fourth traces at 200 and 300 μm, respectively, from the outer edge of the HOTC throughout the pyramidal cell layer area where the so-called inverted fEPSP (i.e., synaptic current source) is maximal. Notice that these potentials reverse as the electrode is moved out of this active area (e.g., traces 0 and 2 for the population spike andtraces 5 and 6 for the fEPSP). Time and amplitude calibrations are shown. These CA3 field potentials parallel their counterparts within the rodent hippocampus in vivo.
Evoked synaptic behavior of the CA3 subfield was also similar to that found in vivo and in situ (Fig.1B). Hippocampal mossy fibers arise from DG granule cells and terminate on CA3 pyramidal cells in vivo (Lorente de Nó, 1934; Hamlyn, 1962; Blackstad et al., 1970; Ramon y Cajál, 1995). Similar synaptic connections from the DG to the CA3 pyramidal cells exist within HOTCs (Zimmer and Gähwiler, 1984). Accordingly, bipolar electrical stimulation of the DG may be expected to show evoked field potentials within HOTCs that are similar to those seen in vivo. Field potential recordings (Fig.1B) of CA3 pyramidal cell responses to DG stimulation confirmed this. With sufficient stimulation of the mossy fiber afferents, CA3 pyramidal cells began to fire action potentials noted in the interstitial space as a population spike (a, Fig.1B). This was seen during the longer-lasting field EPSP (fEPSP) (b, Fig. 1B) that was maximally inverted (i.e., moves in the positive direction) at the pyramidal cell layer (trace 4, Fig. 1B), where synaptic currents from excitatory dendritic synapses flow from pyramidal cells nearer the cell body (Andersen et al., 1971a,b; Martin, 1983; Alger et al., 1984). Stimulus strength was increased so that the mossy fiber presynaptic volley that otherwise would have been evident (i.e., at a, Fig. 1B) was, instead, overshadowed by the pyramidal cell population spike (most evident intraces 3 and 4, Fig. 1B). Field potentials commonly were recorded for SD experiments at the CA3 pyramidal cell layer. To prevent possible induction of synaptic facilitation or depression (Malenka, 1994), we evoked field potentials at a rate of 0.5 Hz for no more than 2–3 min every 10–15 min. In most experiments a single field potential was evoked to verify microelectrode placement and the physiological status of the HOTC before the induction of each SD.
Electrographic seizures could be induced in HOTCs (Fig.2). Spontaneous fast electrical activity often was seen when DC potential microelectrodes were advanced into the interstitial space of HOTCs. Such spontaneous electrical activity could be enhanced to include electrographic seizures by, for example, a single bipolar electrical stimulus at the hilus. Others have found similar electrophysiological behavior within HOTCs (Fowler et al., 1986). Ideally, SD can be studied best when evoked by predetermined stimuli, such as bipolar stimulation in the hilus. However, SD will not pass through gray matter areas that are hyperexcitable (i.e., are experiencing or recently have experienced electrographic seizures) (Bureś et al., 1975; Koroleva and Bureś, 1979, 1980). Electrographic seizures within HOTCs also prevented SD.

CA3 pyramidal cell layer electrographic seizure. HOTCs showed spontaneous electrical activity that could include electrographic seizures. The record shown is from a microelectrode placed among the basilar dendrites of the CA3 pyramidal cell layer. Shortly after exposure to NaAc–Ringer’s, the interstitial DC potential swung millivolts more positive. After 45 sec, DC potential swung quickly positive and then more slowly negative. The latter culminated in seizure activity, followed by typical sawtooth activity that initially increased and then progressively decreased in size. Here the HOTC was exposed to NaAc–Ringer’s for a total of 75 sec. Increasing Ringer’s Ca2+ concentration from 1.25 to 2.5 mm promptly eliminated any spontaneous seizure activity and any that occurred from exposure to NaAc–Ringer’s.
The occurrence of electrographic seizures usually was prevented by the addition of ISO, a β-adrenergic agonist, along with raising Ca2+ from 1.25 to 2.5 mm in all Ringer’s solutions. This effect of ISO might seem paradoxical, because ISO increases pyramidal cell excitability. For example, ISO increases population spike amplitude in adult CA1 pyramidal cells (Mueller et al., 1981; Dunwiddie et al., 1992) without affecting the fEPSP (Heginbotham and Dunwiddie, 1991). ISO affected HOTCs in this manner. In addition, ISO depolarizes and increases the input resistance of CA3-affected pyramidal cells in immature hippocampal slices as young as postnatal day 7 (Moudy and Schwartzkroin, 1992). However, ISO also increases gap junctional connectivity among astrocytes (Giaume et al., 1991). Thus, the ability of ISO to enhance pyramidal cell excitability and yet decrease electrographic seizures may be attributable, at least in part, to direct effects of this β-adrenergic agonist onastrocytic gap junctional connections, which could increase the dispersal of K+ via increased spatial buffering (Newman, 1995). Nonetheless, despite the improved electrophysiological function after the addition of ISO to the normal Ringer’s solution that was bathing HOTCs, SD still could not be induced by bipolar recurrent electrical stimulation in the hilus.
Induction of SD in HOTCs
SD could be induced by hilar bipolar electrical stimulation when Cl− in the Ringer’s solution was replaced by other anions (Bureś et al., 1974). Cl− was reduced by (1) removing NaCl (124 mm) from the Ringer’s solution, (2) replacing 124 mm NaCl with an isosmotic amount of sucrose, (3) replacing 124 mm NaCl with an equimolar amount of sodium propionate or (4) sodium acetate (NaAc) (Bureś et al., 1974). At least three different HOTCs were used for each Ringer’s solution above, and the cultures were exposed/stimulated at least 10 times. Each of these Ringer’s solutions provided a sufficient “conditioning” change to induce SD after a single bipolar electrical stimulus in the hilus. However, substitution with NaAc was the most consistent conditioning change. Therefore, it was used to induce SD in all experiments. Prolonged exposure of HOTCs to NaAc–Ringer’s alone would induce electrographic seizures. However, with the addition of ISO and raised Ca2+ to all Ringer’s solutions, coupled to transient (90–120 sec) exposure of HOTCs to NaAc–Ringer’s solution, seizure activity was rarely seen. Finally, SD was induced consistently (n > 100) only when Ringer’s solution above the HOTCs was removed and replaced with mineral oil or moist air. Only rarely would exposure to NaAc–Ringer’s successfully induce SD in submerged HOTCs. None of the other anion-substituted Ringer’s solutions above were a sufficient conditioning solution for SD when HOTCs were submerged.
Two of the three fundamental electrophysiological characteristics of SD are shown in Figure 3. The first is the slow interstitial DC potential change of SD (thick record, Fig. 3). Exposure to NaAc–Ringer’s always produced a small positive deflection in the interstitial DC potential. After 90–120 sec the Ringer’s solution was returned to normal, and a single bipolar electrical stimulus was delivered quickly to the hilus. This invariably produced SD, as evidenced by a dramatic negative shift in the interstitial DC potential of 30–50 mV (points 2–4 of slow DC potential record, Fig. 3) (Leão, 1944). When the DC shift of SD began to recover toward the baseline, spontaneous epileptiform activity commonly was seen (points 5–7 along DC potential record, Fig. 3). This has been observed in hippocampal brain slices derived from adult (Snow et al., 1983) and immature (Psarropoulou and Avoli, 1993) rats. Notice that the bipolar stimulus to trigger SD also is associated with a uniquely large DC negative shift (between points1 and 2 of the slow DC potential record, Fig. 3). This initial negative deflection of ∼10 mV occurred synchronously throughout the HOTC, as evidenced by three microelectrodes separated by 100 μm (Fig. 4) and placed variably throughout HOTCs. Furthermore, the initial DC negative deflection was never evident from bipolar stimulation without exposure to NaAc–Ringer’s (data not shown). The DC potential change from the bipolar stimulus also was associated with a fast propagating Ca2+ wave (see below). These fast Ca2+ waves were never seen with bipolar stimuli in HOTCs exposed to normal Ringer’s solution.

Evoked field potential and interstitial DC potential changes associated with SD. Classical electrophysiological evidence for SD consists of a slowly propagating, large negative DC potential in the interstitial space associated with a transient loss of spontaneous and/or evoked neuronal activity. The association of the DC potential (thick record) with the change in evoked field potentials (thin traces) during SD in a HOTC is shown. This event was one of 40 such SD episodes induced every 10–15 min from the same culture over an 8 hr period. Field potentials were evoked at specific time points (0–8) shown on the DC record. A calibration pulse (10 mV, 2 msec) is shown toward the latter half of each field potential trace. The interstitial DC calibration time and voltage bars are shown. With NaAc exposure, the interstitial slow DC potential (large thick line) initially shifted more positive. Then with the evoked pulse from the hilus (1), interstitial DC potential briefly became more positive and then swung negative, reaching a peak (2) approximately −10 mV from baseline. Finally, SD occurred. This was evidenced by a massive shift in DC potential that reached −45 mV from baseline (0) in this example before returning to baseline. Further support that this DC change was SD came from alterations in the field potentials. Successive SDs (n = 12) could make pyramidal cells hyperexcitable. For example, two population spikes are seen (trace 0) before the associated slower, large fEPSP. Then, with exposure to NaAc–Ringer’s, evoked potentials became even more excitable (trace 1), showing multiple population spikes before becoming completely absent (traces 2–4) as the DC potential swung to its most negative extreme. Recovery frequently was associated with epileptiform activity, as in this example (points 5–7 along the slow DC record). In addition, pyramidal cells initially showed an exaggerated fEPSP (traces 5 and 6) and then multiple population spikes (trace 7). Shortly after SD, pyramidal cell fEPSPs were reduced slightly (compare trace 8 with 0).

Propagation of interstitial DC potential associated with SD. Three microelectrodes were placed in a row along the CA3 pyramidal cell layer to demonstrate the third classical electrophysiological characteristic of SD, that of interstitial DC potential propagation. In the example shown, the center trace is from a microelectrode placed at the apex of the CA3 pyramidal cell layer where the hilar-evoked CA3 field potential was maximized. Other microelectrodes were 100 μm to either side of the center microelectrode. The bottom trace is from the microelectrode that was closer to the CA1 area. The top trace is from the microelectrode that was closer to the dentate gyrus. The arrowhead indicates the time of triggering evoked field potential used to initiate SD. Dotted lineswith arrows show peak DC potential change from SD at each recording zone. Propagation velocity between thebottom and middle traces equals 12.1 mm/min and between middle and top tracesequals 6.1 mm/min. Propagation velocities overall averaged 5.47 mm/min ± 0.47 (n = 15), based on recordings compiled from nine HOTCs. Time and voltage calibrations are shown.
The second hallmark of SD, transient cessation of evoked electrical activity (thin traces 2–4, Fig. 3) (Leão, 1944), was also evident during the negative, slow DC potential change. CA3 pyramidal cell responses could become hyperactive after successive SDs (n = 12). This was evident before SD (fast DC potentialtrace 0, Fig. 3) in which two population spikes are seen before exposure to NaAc–Ringer’s. The latter further increased excitability (fast DC potential trace 1, Fig. 3) so that multiple population spikes occurred along with a dramatically widened fEPSP. Then, as expected with the onset of SD (fast DC potentialtrace 2, Fig. 3) until the peak slow DC change (fast DC potential traces 3 and 4, Fig. 3), no evoked field potentials were seen. With recovery (fast DC potentialtraces 5–8, Fig. 3), pyramidal evoked activity progressively returned. Initially, only an exaggerated fEPSP could be seen (fast DC potential traces 5 and 6, Fig. 3). This quickly was followed by epileptiform activity (as noted above in the slow DC potential record) and the production of multiple population spikes by bipolar stimulation (fast DC potential trace 7, Fig. 3). Finally, the fEPSP was reduced immediately after SD (compare fast DC potential traces 0 and 8, Fig. 3).
The third classical electrophysiological change of SD, slow propagation of a large negative interstitial DC potential (Leão, 1944), is shown in Figure 4. DC propagation velocities averaged 5.47 ± 0.47 mm/min (n = 15), a speed similar to values foundin vivo (Leão, 1944; Bureś et al., 1974) and in the in vitro hippocampal brain slice preparation (Snow et al., 1983; Psarropoulou and Avoli, 1993).
Intercellular Ca2+ waves and SD
Glutamate can be an effective stimulus to evoke SD (Bureś et al., 1974). Furthermore, it evokes propagating intracellular and intercellular Ca2+ waves in HOTCs (Dani et al., 1992) (Fig. 5). HOTCs are surrounded by a rim of glial (astrocytes and microglia) cells (Kunkler and Kraig, 1997a) that can be used as a mixed glial cell preparation. Ca2+ waves from glutamate exposure were noted in both of these areas. In the mixed glial cell rim around the HOTCs, Ca2+ waves could be seen in individual cells (Fig.5). Glutamate (100 μm) evoked oscillations within single cells as well as rapidly propagating waves of Ca2+between cells (n = 10), as has been reported previously in primary astrocytic cultures (Cornell-Bell et al., 1990; Charles et al., 1991, 1992; Cornell-Bell and Finkbeiner, 1991; Finkbeiner, 1992;Enkvist and McCarthy, 1994). Ca2+ waves also were seen within HOTCs during exposure to elevated glutamate. These changes have been noted previously within HOTCs (Dani et al., 1992) and within the in situ rat retina (Newman and Zahs, 1997). However, electrophysiological changes of SD were never seen from glutamate exposure (n = 30). Thus, glutamate-evoked Ca2+ waves can occur without electrophysiological evidence of SD.

Astrocytic Ca2+ fluctuations at HOTC edge. HOTCs are surrounded by a rim of microglial cells and astrocytes that can be used as a mixed glial cell preparation. Here a HOTC (maintained in vitro for 45 d) was preloaded with the intracellular calcium-sensitive dye Fluo-3. Glial cells at the edge of the HOTC, initially identified via phase-contrast microscopy, were examined with time-lapse digital photo microscopy (1.2 sec/image) during exposure to 100 μm glutamate in normal Ringer’s solution. Images were pseudocolored to emphasize changes in fluorescence intensity that correspond to changes in intracellular calcium. The intensity scale extends from 0 to255 (i.e., low to high Ca2+concentration) and is shown in image 0. Repeated exposures to glutamate caused a progressive rise in fluorescence intensity that is evident in the images shown. Arrowsemphasize particular spontaneous Ca2+ changes. Thetop arrow points to astrocytes that show a transient rise and fall of cellular Ca2+ concentration. Thebottom arrow points to cells that undergo propagation of a rise in intracellular Ca2+ concentration between two adjacent astrocytes. Image 1 shows a rise in Ca2+ from that seen in image 0. In addition, this rise propagates to the distal aspects of the right-hand cell and to the left-hand cell (image 2). Ca2+ concentration is beginning to fall in distal aspects of both cells in image 3. Cells were presumed to be astrocytes by using morphological criteria in phase-contrast microscopy. These cells showed 90–100% fluctuations in fluorescent intensity between images. The propagation of the Ca2+ signal changes that appeared both within (top arrowhead) and between cells (bottom arrowhead) is consistent with changes reported from primary cultures of astrocytes. Scale bar, 10 μm.
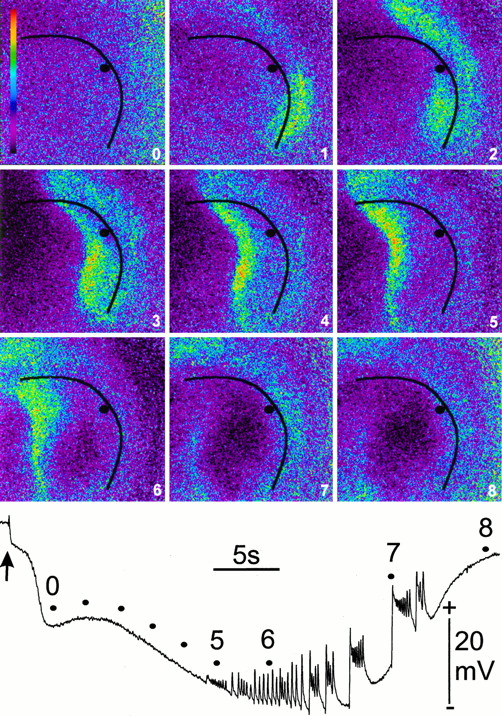
Electrophysiological changes of SD, on the other hand, do occur with Ca2+ waves (Fig. 6). Transient exposure to NaAc–Ringer’s was necessary to elicit SD in HOTCs by a single bipolar stimulus to the hilar area of the DG. SD always (n = 6) occurred with two distinct Ca2+ waves. The first occurred within 1–2 sec of the synchronous DC deflection recorded in the pyramidal cell layer from bipolar electrical stimulation. Furthermore, it propagated >100 μm/sec in the oriens layer and originated either in CA1 or CA3. Figure 6 shows this wave beginning in CA1/CA2 (image 1, Fig.6) and rapidly propagating toward the hilus along the oriens layer (image 2, Fig. 6). The second wave propagated mostly perpendicular to the pyramidal cell layer from a nidus in CA3 (or less often CA1) (images 3–6, Fig. 6). In addition, this second wave propagated at the speed of SD (4.0 ± 0.2 mm/min;n = 6). However, the peak change in Ca2+ of this second wave always preceded the peak interstitial DC change of SD by a significant (p< 0.001 tested by an unpaired Student’s t test;n = 6) margin of 6–16 sec.

Propagation of intercellular Ca2+ wave associated with SD in HOTC. The classic electrophysiological changes of SD have never been shown to occur with Ca2+ propagating waves. Here interstitial DC potential and intracellular Ca2+were monitored simultaneously to determine whether Ca2+ waves occurred with SD. A microelectrode was placed in the pyramidal cell layer (black line) in CA3 (black dot) after Fluo-3 was loaded into the HOTC, as described in Figure 5. Changes in fluorescence intensity were pseudocolored on a 0–255 scale, as described in Figure 5.Purple and black indicate low Ca2+, whereas blue,yellow, and red indicate progressively higher calcium concentration. Images were acquired every 1.2 sec, with the first six images shown in sequence. After a 90 sec perfusion with NaAc–Ringer’s, SD was initiated by a single electrical pulse (200 μsec, 50 V) via a bipolar stimulating electrode in the hilus (arrow). No changes from the preceding baseline images in Ca2+ were detectable with either the single electrical pulse (arrow; positive deflection in DC record) or with the subsequent negative shift that immediately followed (image 0). The first increase in Ca2+ was observed in the oriens layer at the CA1/CA2 pyramidal cell junction (bottom right of black line; image 1), followed by a rapid propagation through the oriens layer of CA3 toward the hilus (top left of black line; image 2). The second change was a Ca2+ increase that spread similarly into stratum radiatum of CA1/CA2 and rapidly propagated through this layer into CA3 (images 2–5). Besides propagating parallel to the pyramidal cell layer, a third aspect of the Ca2+ changes was a slower propagation of Ca2+ change perpendicular to the pyramidal cell layer (images 3–6) along the apical dendrites. Ca2+ propagation away from the pyramidal cell layer was measured at 4.0 ± 0.2 mm/min (n = 6). Only minor fluctuations in Ca2+ fluorescence were observed after the SD episode reached its peak amplitude (image6) and as the slow potential trace returned to baseline values (images 7 and 8). Note that maximum Ca2+ change at the microelectrode recording site (images 2–3) preceded the maximal change in interstitial DC potential (bottom record) by a few seconds. The DC record was not filtered. As often occurred with repolarization, the HOTC showed spontaneous epileptiform activity (positive-going deflections between points 5 and8). Time and amplitude calibrations are shown. Image dimensions are 920 × 920 μm.
To explore further whether Ca2+ waves are essential for SD initiation and propagation, we exposed HOTCs to heptanol (data not shown). Heptanol reversibly uncouples gap junctions (Spray and Bennett, 1985; Bastiaanse et al., 1993). Furthermore, it can stop the propagation of intercellular Ca2+ waves as well as the initiation of SD (Martins-Ferreira and Ribeiro, 1995; Nedergaard et al., 1995). DC potentials were recorded in the CA1 and CA3 pyramidal cell layers after HOTCs were loaded with Fluo-3. Ethanol, the vehicle for heptanol, did not affect evoked field potentials or SD and associated Ca2+ waves (n = 5). Heptanol in high concentrations (3 mm) reversibly abolished field potentials (n = 3) as well as Ca2+ waves and SD. However, because an evoked field potential was needed to initiate SD, the dose of heptanol was titrated downward to discover if Ca2+ waves could be separated from SD. The results suggest that such a separation cannot be accomplished. First, without exposure to heptanol, electrophysiological changes of SD occasionally did not propagate from CA3 to CA1 (and vice versa). Under these cases, Ca2+ waves were not seen in those areas that did not show DC changes of SD (n = 7). Then in other experiments, exposure to lower levels of heptanol (0–1.5 mm) often extinguished Ca2+waves and SD despite preserved evoked field potentials in both CA3 and CA1 (n = 9 HOTCs and 26 SDs). For example, SD and Ca2+ waves were seen in 11 of 13 trials (85%) at 0.75 mm heptanol, 2 of 4 trials (50%) at 1.0 mm heptanol, 2 of 9 trials (22%) at 1.5 mmheptanol, and 0 of 3 trials at 3.0 mm heptanol. Thus, two distinct types of Ca2+ waves precede SD and appear to be essential for the initiation and propagation of this phenomenon.
DISCUSSION
Ca2+ waves in neural cells (Cornell-Bell et al., 1990; Charles et al., 1991, 1992, 1996; Cornell-Bell and Finkbeiner, 1991; Finkbeiner, 1992; Enkvist and McCarthy, 1994) and tissues (Dani et al., 1992; Newman and Zahs, 1997) resemble SD because of their similar propagation velocities, yet the relationship of Ca+ waves to the electrophysiological changes of SD is unknown. Our results show, for the first time, that HOTCs support SD. Furthermore, two distinct Ca+ waves travel through HOTCs ahead of the SD electrophysiological changes. The first travels rapidly along the basilar pyramidal cell dendrites, whereas the second travels slowly and mostly perpendicular to the pyramidal cell layer. These findings may be linked to functional changes in gap junctions.
Initiation of SD in HOTCs
Despite the increased use of HOTCs, SD has not been reported in these cultures. This lack is attributable to at least two facts. First, although acute rodent hippocampal slices easily support SD (Snow et al., 1983; Psarropoulou and Avoli, 1993), HOTCs typically do not. Both preparations lack extrinsic inputs. Furthermore, they both display similar spontaneous and evoked electrophysiological activity. Nonetheless, the tissue volume activated by depolarizing stimuli is less in HOTCs than in acute hippocampal brain slices. HOTCs are ∼50–150 μm thick (our unpublished observations), whereas acute hippocampal slices are typically 300–400 μm thick (Alger et al., 1984). Thus, DG gyrus bipolar electrical stimulation activates a smaller volume of CA3 pyramidal cells in HOTCs than acute slices. SD initiation requires a sufficient volume of gray matter to be acutely depolarized (Bureś et al., 1974). Perhaps the volume of CA3 activated by bipolar DG stimulation in HOTCs is simply too low to initiate SD in either CA3 or CA1 under normal conditions. This conclusion is supported by our finding that SD could be initiated very rarely in HOTCs submerged under normal Ringer’s superfusion. However, when HOTCs were used in an “interface” chamber where Ringer’s exposure was restricted to the bottom surface of the cultures, SD could begin to be initiated by electrical stimulation. This implies that soluble substances released to the interstitial space are essential for SD. Diffusion (Nicholson, 1995) of essential materials away from thin submerged HOTCs might be too rapid to allow for SD initiation. Alternatively, ephaptic interactions between neural cells (Taylor and Dudek, 1984; Faber and Korn, 1989) could be enhanced within HOTCs in an interface chamber, as compared with submerged HOTCs.
A second potential reason why SD has not been reported previously in HOTCs stems from the seemingly convoluted “conditioning” needed to evoke the phenomenon consistently. Our first attempts at inducing SD in HOTCs centered on increasing HOTC excitability by altering Ringer’s constituents (our unpublished observations) and were unsuccessful. Raising Ringer’s K+ or lowering Ca2+ or Mg2+ only induced spontaneous or evoked seizure activity. Similarly, the addition of glutamate, NMDA, carbachol, or 4-aminopyridine, each of which has excitatory effects, only resulted in seizure activity. Later attempts centered on reducing Ringer’s Cl−. This is a well recognized method of altering interstitial fluid to promote the induction of SD (Bureś et al., 1974). The mechanisms responsible for this effect are unknown but may be related to increased excitability (Nicholson and Kraig, 1981; Haglund and Schwartzkroin, 1984). Again, only epileptiform activity occurred when Cl− was replaced with propionate or acetate. Similar results occurred in acute hippocampal slices when Ringer’s Cl− was replaced with propionate (Yamamoto and Kawai, 1967). The final, and virtually always successful, method used to induce SD involved transient exposure to NaAc–Ringer’s that also contained ISO and raised Ca2+.
Ca2+ waves and SD
Gap junctions between neurons (Somjen et al., 1992; Herreras et al., 1994; Largo et al., 1997) and astrocytes (Nedergaard et al., 1995) may play important roles in SD initiation and propagation, respectively. Although raised Ca2+ has no direct effect on gap junction, other Ringer’s changes (the addition of ISO and the replacement of Cl− by acetate) could increase gap junctional conductances. For example, ISO increases gap junctions between cultured astrocytes (Giaume et al., 1991). Furthermore, transient exposure to NaAc should begin to acidify neural cells (Roos and Boron, 1981). This might be expected to reduce gap junctional conductances (Spray et al., 1981). However, conductance through gap junctions made of connexin 43 and connexin 32, gap junctional proteins found in brain (Giaume and McCarthy, 1996), increases with a reduction in cellular pH. For example, gap junctions formed between pairs of Xenopus laevis oocytes expressing homologous channels for these proteins show an increase in conductance when intracellular pH is lowered from 7.2 to 6.8 or from 7.2 to 6.3, respectively (Liu et al., 1993).
The magnitude of the interstitial DC potential change from bipolar stimulation (see Fig. 3) supports the notion of increased cellular connectivity during HOTC exposure to NaAc. During normal Ringer’s solution exposure the DC deflection from a bipolar stimulus to the DG was not seen in CA3 (i.e., points 0 and 8 of slow DC potential record, Fig. 3) or CA1 (data not shown). However a positive and then a large negative DC deflection of ∼10 mV was always seen in CA3 (and CA1) synchronously with the same stimulus during NaAc exposure. The large size of this DC deflection and the distance (i.e., >1 mm) over which it simultaneously was seen implies the existence of a long-distance conductance path along the pyramidal cell layer. This could be attributable to the opening of normally closed neuronal gap junctions between pyramidal cells, as has been suggested for seizures (Perez-Velazquez et al., 1994) and SD (Somjen et al., 1992; Herreras et al., 1994; Largo et al., 1997).
The speed and cytoarchitectural direction of the rapidly propagating Ca2+ wave seen shortly after the start of SD further support the suggestion of increased gap junctional connectivity among pyramidal cells. Neuronal Ca2+ waves travel at >100 μm/sec (Charles et al., 1996), a speed consistent with that seen for the rapidly propagating wave that spreads along the pyramidal cell basilar dendritic layer (see Fig. 6). Furthermore, no cellular elements extend along this layer that otherwise could account for the propagating intercellular Ca2+ wave. Finally heptanol, which uncouples gap junctions (Spray and Bennett, 1985;Bastiaanse et al., 1993), stopped this Ca2+ wave as well as the large DC deflection associated with bipolar stimulation.
Heptanol also stopped the slower Ca2+ wave and SD itself, as reported by others (Martins-Ferreira and Ribeiro, 1995;Nedergaard et al., 1995). The slowly propagating Ca2+ wave traveled at speeds consistent with similar waves seen among astrocytes (Cornell-Bell et al., 1990; Charles et al., 1991, 1992; Cornell-Bell and Finkbeiner, 1991; Finkbeiner, 1992;Enkvist and McCarthy, 1994). Furthermore, the slower Ca2+ wave spread mostly perpendicular to pyramidal cells but also in all directions from an initial focus. Astrocytes are dispersed ubiquitously throughout the laminae of the HOTC (Kunkler and Kraig, 1997a). Therefore, as suggested by others (Nedergaard, 1994;Nedergaard et al., 1995), it is plausible to propose that this slower Ca2+ wave during SD in HOTCs also relies on gap junctional connections among astrocytes. A Ca2+ wave that precedes SD has been noted by others in acute hippocampal brain slices (Basarsky and MacVicar, 1997).
Significance of SD in HOTCs
The discovery of two distinct Ca2+ waves that precede electrophysiological changes of SD adds further support to the suggestion that changes in neural function precede the regenerative depolarization of SD (Herreras et al., 1994). Somjen and colleagues (Somjen et al., 1992; Herreras et al., 1994; Largo et al., 1997) suggest that SD involves the opening of previously closed neuronal gap junctions. That these waves occur before the regenerative electrophysiological changes of SD suggest they could effect triggering mechanisms within (Post and Silberstein, 1994; Finkbeiner, 1995) and among neural cells (Nedergaard, 1994; Parpura et al., 1994) that are essential for SD. Furthermore, given the diverse and potentially long-lasting effects of cellular Ca2+ changes (Whitfield, 1990; Post and Silberstein, 1994), Ca2+waves from SD also may trigger mechanisms responsible for temporally remote phenomena, such as SD-induced modulation of ischemic injury.
The discovery of the mechanisms responsible for SD has increased importance because SD is now known to influence ischemic brain injury. When SD precedes ischemia by <1 d, injury is greater than otherwise would be expected from ischemia alone (Takano et al., 1996). However, when SD occurs >1 d before ischemia, injury is reduced from that which otherwise would be seen (Kawahara et al., 1995; Kobayashi et al., 1995;Matsushima et al., 1996). Clarification of the mechanisms responsible for SD could lead to improved insight to the pathogenesis of ischemic brain injury. Furthermore, knowledge of specific mechanisms responsible for SD might reveal how brain injury from ischemia may be mitigated or perhaps even reversed. Currently, the mechanisms by which SD confers this dual effect on ischemic injury are unknown. However, HOTCs may be ideal for studies directed toward such mechanisms, because HOTCs support SD and they can be maintained in vitro for months, where individual cells can be followed in space and time.
Footnotes
This work was supported by the National Institute of Neurological Disorders and Stroke (Grant NS-19108), a Zenith Award from the Alzheimer’s Association, and the Brain Research Foundation of the University of Chicago. P.E.K. was supported in part by a National Institutes of Health Research Service Award (NS-10190). We thank several members of our laboratory for their assistance in this project. Ms. Marcia P. Kraig gave assistance in culture preparation and maintenance. A. O. Caggiano critically read a final version of this manuscript. C. D. Lascola suggested that we reduce extracellular volume and cover cultures with a thin layer of mineral oil. Mr. R. Hulse did image analyses and restorations.
Correspondence should be addressed to Dr. Richard P. Kraig, Department of Neurology MC2030, The University of Chicago, 5841 South Maryland Avenue, Chicago, IL 60637.


