

Abstract
Neurotrophins are important regulators of visual cortical plasticity. It is still unclear, however, whether they play similar or different roles and which are their effects on the electrical activity of cortical neurons in vivo. We therefore compared the effects of all neurotrophins, nerve growth factor (NGF), brain-derived neurotrophic factor (BDNF), neurotrophin-4 (NT-4), and neurotrophin-3 (NT-3) on visual cortical plasticity and on cell spontaneous and visually evoked activity. Rats were monocularly deprived for 1 week at the peak of the critical period, and neurotrophins were infused intracortically. The main finding is that, with the exception of NT-3, all neurotrophins affect the outcome of monocular deprivation, but there are clear differences in their mechanisms of action. In particular, NT-4 and NGF counteract monocular deprivation effects without causing detectable alterations either in spontaneous or visually evoked neuronal activity. BDNF is less effective on ocular dominance plasticity and, in addition, strongly affects spontaneous and visually evoked activity in cortical neurons.
It has been recently shown that neurotrophins, neurotrophic factors of the nerve growth factor (NGF) family (Levi-Montalcini, 1987; Lewin and Barde, 1996), have an important role in neural activity-dependent development and plasticity of the brain and in particular of the neocortex (Thoenen, 1995; Bonhoeffer, 1996; Cellerino and Maffei, 1996; Pizzorusso and Maffei, 1996). The first evidences in this sense were that exogenous supply of NGF prevents the effects of monocular deprivation (MD) (Maffei et al., 1992), whereas block of endogenous NGF action severely interferes with development of the visual system and prolongs the critical period (Berardi et al., 1994; Domenici et al., 1994).
Subsequently, a large number of investigations tackled the problem of the role of neurotrophins in the plasticity of the visual system, using different species and different experimental protocols. The results obtained are not always in accordance, and there is still controversy on the identity of the active neurotrophin (Cabelli et al., 1995, 1997;Gu et al., 1995; McAllister et al., 1995, 1997; Riddle et al., 1995; Galuske et al., 1996; Hata et al., 2000) (for review, seeMcAllister et al., 1999). It is unclear whether the discrepancies observed are simply caused by the different experimental conditions, such as use of different animals, different administration of the drugs, different experimental protocols, and different age of the animal or whether different neurotrophins play different roles.
Another open question concerns the effects of neurotrophins on visual cortical cell electrical activity. Many studies have been done on the effects of neurotrophins on synaptic transmission, but all of them were performed on in vitro preparations (Kang and Schuman, 1995; Akaneya et al., 1997; Carmignoto et al., 1997;Rutherford et al., 1998; Turrigiano, 1999). Surprisingly few studies have documented the effects of neurotrophins in vivo on visual cortical cell activity and responsiveness. Knowledge of neurotrophin effects on cortical cell activity in vivo is essential to understand more thoroughly neurotrophin mechanisms of action in regulating visual cortical plasticity. Indeed any strong direct effect on visual cortical cell electrical activity is bound to influence developmental cortical plasticity (Shaw and Cynader, 1984;Ramoa et al., 1988; Reiter and Stryker, 1988).
We thought therefore of interest to compare in vivo the actions of all four neurotrophins, NGF, brain-derived neurotrophic factor (BDNF), neurotrophin-3 (NT-3), and neurotrophin-4 (NT-4), on ocular dominance plasticity in the rat, in strictly the same experimental conditions. At the same time, we evaluated the effect of each neurotrophic factor on several basic aspects of cell spontaneous activity and visual response properties. In this way we have been able to correlate the presence of an action on cortical plasticity with the presence of an effect on electrical activity.
We have found that all neurotrophins affect the outcome of monocular deprivation with the exception of NT-3. However the effects of NGF, NT-4, and BDNF on cortical plasticity do not present the same characteristics. Indeed, to our surprise, NT-4 and NGF, although acting on different receptors (and presumably different targets), show very similar behavior, in that they both counteract monocular deprivation effects without causing detectable alterations either in cell spontaneous or visually evoked activity. BDNF, which shares a common receptor with NT-4, is less active than NT-4 (or NGF) in preventing monocular deprivation effects. In addition, BDNF action clearly shows one important peculiar characteristic, in that it alters both spontaneous cortical activity and visually evoked responses.
MATERIALS AND METHODS
Animal treatment
A total of 42 Long–Evans hooded rats were used in this study. Thirty rats were implanted with osmotic minipumps (model 1007D; Alzet, Palo Alto, CA) at P21 and were monocularly deprived for 1 week by eyelid suture under avertin anesthesia. Minipumps were connected via a PE tubing to a stainless steel cannula (30 gauge) implanted in the visual cortex contralateral to the deprived eye (1 mm lateral to lambda; Pizzorusso et al., 1999). Osmotic minipumps (pumping rate, 0.5 μl/hr) were filled with: mouse (m) NGF (2.5 S, gift of Dr. D. Mercanti) 1 μg/μl, human recombinant (hr) NT-3 (Regeneron) 0.9 μg/μl and 8.3 μg/μl, hrNT-4 (Regeneron) 0.56 μg/μl, and hrBDNF (Regeneron) 1.6 and 8.3 μg/μl; to control for aspecific effects of infusion Cytochrome C (Cyt C; Sigma, St. Louis, MO) 1 μg/μl and 8.3 μg/μl was used. We had therefore eight treatment groups, MD + NGF (n = 4), MD + NT-4 (n= 7), MD + BDNF 1.6 μg/μl (n = 3), MD + BDNF 8.3 μg/μl (n = 4), MD + NT-3 0.9 μg/μl (n = 3), MD + NT-3 8.3 μg/μl (n = 3), MD + Cyt C 1 μg/μl (n = 3), and MD + Cyt C 8.3 μg/μl (n = 3). Two animals of each treatment group were recorded double-blind, for a total of 16 double-blind recordings. The results obtained in double-blind and non-double-blind recordings did not differ. Six animals were left undeprived and recorded at P28.
In six rats the cannula was implanted at 4 mm from the midline (corresponding to the representation of the vertical meridian) and 4 mm from lambda, to allow recordings at different distances from the infusion site while maintaining the same receptive field location. In this case the minipumps were filled with BDNF (8.3 μg/μl;n = 2), NT-4 (0.56 μg/μl; n = 2), and Cyt C (8.3 μg/μl; n = 2). All these six animals have been recorded double-blind.
Electrophysiological analysis. Electrophysiological procedures were performed in normal and in MD-treated animals at P28 as previously described (Maffei et al., 1992; Pizzorusso et al., 1999). Briefly, animals were anesthetized in urethane (0.7 ml/hg, 20% solution in saline; Sigma) by intraperitoneal injection and placed in a stereotaxic frame. Additional doses of urethane (0.03–0.05 ml/hg) were used to keep anesthesia level stable throughout the experiment. Body temperature was continuously monitored and maintained at ∼37°C by a thermostated electric blanket during the experiment. ECG and EEG were also continuously monitored. A hole was drilled in the skull in correspondence with the binocular portion of the primary visual cortex (binocular area 17 or Oc1B) contralateral to the deprived eye. After exposure of the brain surface, the dura was removed, and a micropipette (2 MΩ) filled with NaCl (3 m) was inserted into the cortex (stereotaxic coordinates >4 mm from the central fissure). To prevent sampling bias, because of the organization of area Oc1B with respect to the ocular dominance, our penetrations were angled (20°–30° with respect to the perpendicular to the cortical surface, estimated from the reconstruction of micropipette track), and for each animal at least three well-spaced penetrations were performed. Care was taken to equally sample cells across the whole cortical depth so that all layers contributed to the analysis of the ocular dominance and electrical activity. Cortical depth was determined from the nominal depth at which single units were encountered corrected for the angle of penetration (Caleo et al., 1999a).
Both eyes were fixed and kept open by means of adjustable metal rings surrounding the external portion of the eye bulb, and the cornea was protected by artificial tears (Lacrinorm; Farmigea, Pisa, Italy). Pupils were left undilated because it proved extremely difficult to provide artificial pupils that would not cause vignetting (Lennie and Perry, 1981). Given the impossibility of backprojecting the optic disk with natural pupils (∼0.5 mm in diameter with the luminance used), we dilated the pupil (atropine sulfate, 0.1%) at the end of the experiment. The position of the optic disk was marked onto a tangent screen where the position of all the cell receptive fields had been plotted.
Visual stimuli were hand-moved light bars projected on a reflecting tangent screen or bars computer-generated on a display (Daewoo, 28 × 22 cm, 15 cd/m2). Both the screen and the display were 20 cm from the rat eyes.
On isolating a cell, the following experimental protocol was followed: the location of the receptive field in the visual space and the orientation properties were determined with hand-held stimuli. In the pigmented rat, the binocular portion of each visual hemifield extends ∼40° from the vertical meridian in the upper visual fields, and the vertical meridian is 55°-58° from the optic disk (Reese and Jeffery, 1983). Only cells with receptive field within 20° from the vertical meridian were included in our sample. Care was taken that receptive fields were at comparable eccentricities in the different groups. In this study a total of 1332 cells have been recorded.
Quantitative measure of the main cell response properties
Cell responsiveness. Cell responsiveness was assessed according to standard criteria in terms of the amplitude of modulation of cell discharge in response to an optimal visual stimulus (peak response divided spontaneous discharge). Spontaneous discharge (spikes per second) was evaluated [by a spike counter or by a peristimulus time histogram (PSTH)] over a period of 1–2 min during which the screen was kept at constant luminance. Peak response was evaluated as the peak firing rate (spikes per second) in the cell response to the stimulus averaged over 10–20 stimuli presentations (Pizzorusso et al., 1999).
Ocular dominance. Ocular dominance was evaluated according to the classification of Hubel and Wiesel. Cells in ocular dominance class 1 were neurons driven only by the contralateral eye; cells in ocular dominance classes 2 and 3 were binocular preferentially driven by the contralateral eye (ratio of contralateral to ipsilateral peak response, >1.5); neurons in ocular dominance class 4 were equally driven by the two eyes; neurons in ocular dominance classes 5 and 6 were binocular and preferentially driven by the ispilateral eye (ratio of ipsilateral to contralateral peak response, >1.5), and neurons in ocular dominance class 7 were driven only by the ipsilateral eye. To evaluate the binocularity and the eye dominance of each individual animal, we calculated a binocular index and an ipsilateral index:
Binocular index is:
 where N(i-j) = number of cells in class (i-j) and N Tot = total number of cells recorded.
Ipsilateral index is
 where N(i-j) = number of cells in ocular dominance class (i-j), andN Tot is the total number of cells recorded. Indexes range from 0 to 1 with high values reflecting a high proportion of binocular or ispilaterally driven neurons, respectively (Maffei et al., 1992;Pizzorusso et al., 1999).
Orientation selectivity. Cells were classified as orientation-selective (O) if the cell response was maximal for a given stimulus orientation (preferred orientation) and indistinguishable from spontaneous activity for at least the orthogonal stimulus orientation; cells were classified as orientation-bias (B) if the response was present at all orientation but was clearly greater (>2×) for certain orientation than for others; cells were classified as non-orientation-selective (N) if the response was of comparable strength at all six orientations (0, 30, 60, 90, 120, and 150°).
To evaluate the overall degree of visual orientation selectivity in neurons from each individual animal, we calculated an orientational index.
Orientational index is:
 where N(O) is the number of orientation selective cells, N(B) is the number of orientation-biased cells, and N Tot is the total number of cells recorded.
Receptive field. RF size and type were determined from PSTHs recorded in response to a computer-generated bar of optimal orientation and velocity drifting on a display. PSTHs were recorded for at least 20 stimulus cycles. To determine RF size, we assumed as visual response the signal above a value equal to: mean spontaneous discharge + 2 SD (Fagiolini et al., 1994, 1997).
Autocorrelation. Autocorrelograms of spikes were computed from periods of 3–5 min of spontaneous activity recorded on the computer. Bin size was 100 or 200 msec. Autocorrelograms were considered rhythmic when displaying two or more distinguishable peaks (Amzica and Steriade, 1995). For each experimental group, the cells analyzed for the autocorrelation were equally distributed across all cortical layers.
At the end of recording session, the position of the last electrode penetration was marked by withdrawing the electrode, gently brushing its tip with a saturated solution of DiI (Molecular Probes, Portland, OR) in absolute ethanol and, after drying of the DiI solution, slowly reinserting it into the cortex for 1.5 mm. During the penetration with the pipette labeled with DiI, some cells were always isolated, and the location of their receptive fields was mapped on the tangent screen where all the other receptive fields had been plotted.
Immunohistochemistry
For the detection of intracortically infused neurotrophins, at the end of the recording session animals were transcardially perfused with PBS, followed by freshly prepared 4% paraformaldehyde in 0.1 m phosphate buffer, pH 7.4. Brains were quickly removed and cryoprotected in 30% sucrose overnight. Fifty micrometer coronal sections were cut on a freezing microtome, washed in PBS, and immersed for 1 hr in blocking solution containing 10% normal goat serum and 0.3% Triton X-100; sections were then incubated with different antibodies according to the neurotrophin infused, namely anti-hrNT-3 and NT-4 (1:1000; Chemicon, Temecula, CA), and anti-hrBDNF (1:1000; kind gift of Dr. Q. Yan). NGF immunostaining was performed as described (Conner and Varon, 1992) incubating sections with an anti-2.5 SNGF antibody (0.75 mg/ml; a kind gift of Dr. J. M. Conner). Neuropeptide Y (NPY) staining was performed using an anti-NPY antibody (1:2000; Biotrend). Antibodies were detected by incubating sections with biotinylated anti-rabbit or anti-sheep IgG (1:200; Vector Laboratories, Burlingame, CA) for 2 hr at room temperature. Sections were then washed and incubated with the avidin–biotin peroxidase reagent (ABC kit; Vector Laboratories) followed by nickel-enhanced diaminobenzidine reaction.
Statistical analysis
Differences in ocular dominance distributions were assessed using a χ2 test (4 df). Differences between groups have been assessed with one-way ANOVA with Tukey'spost hoc test for data normally distributed and with Kruskal–Wallis one-way ANOVA on ranks with Dunn's post hoctest for data non normally distributed. For the analysis of data collected at different distances from the cannula, a two-way ANOVA (factor 1, distance, two levels, factor 2, treatment, three levels) was performed. Differences between percentages have been analyzed with thez-score. Differences between cumulative distributions have been evaluated with Kolmogorov–Smirnov (K–S) test. Level of significance p = 0.05.
RESULTS
Effects of NGF, BDNF, NT-4, and NT-3 on rat ocular dominance plasticity
To evaluate cortical synaptic plasticity in vivo we have chosen the paradigm of monocular deprivation, which measures the susceptibility of visual cortical connections to alterations in the balance of afferent activity. Rats were monocularly deprived for 1 week at the peak of the critical period [postnatal day 21 (P21)–P28], that is during the period of maximal susceptibility of the visual cortex to monocular deprivation. Neurotrophins (NGF, NT-4, BDNF, and NT-3) or Cytochrome C as control were infused in the visual cortex contralateral to the deprived eye throughout the deprivation period by means of osmotic minipumps connected to a cannula inserted 1 mm from the midline. Undeprived untreated littermates (normal animals) were also recorded at P28 to assess the functional properties of visual cortical cells at this age. Ocular dominance of visual cortical neurons was quantified measuring cell firing rate in response to visual stimulation of either eye and assigning each cell to a class of ocular dominance according to the classical Hubel and Wiesel criteria.
Neurotrophin diffusion in the treated cortex
To control that the infused neurotrophins actually reached the recording site (which is 3 mm away from the infusion cannula), we have performed immunohistochemistry on the brains of the recorded animals for all neurotrophins. The results for neurotrophin concentration in the range of 0.56–1.6 μg/μl (Gu et al., 1995; concentrations previously used in similar experiments, Galuske et al., 1996;Pizzorusso et al., 1999) (Fig.1A) show that immunoreactivity for all neurotrophins is clearly present in the recording zone (Fig. 1A, left, arrows) with the exception of BDNF. Although evaluating neurotrophin diffusion by immunohistochemistry is probably an underestimate (Cabelli et al., 1997), it is conceivable that less neurotrophin reaches the recording zone in the case of BDNF compared with the other neurotrophins. Results for BDNF at a higher concentration (8.3 μg/μl) (Fig.1B) show that immunoreactivity in the recording zone is clearly detectable. That BDNF reached the recording zone is confirmed by immunostaining for NPY (Fig. 1C,D). NPY is a neuropeptide that is expressed by a class of inhibitory interneurons and is upregulated by BDNF and NT-4 (Nawa et al., 1993). NPY expression in the recording zone is more evident for BDNF than for NT-4 (Fig.1C–H). This result has been confirmed by determining the percentage of positive cells in in situ hybridization experiments for NPY mRNA (Engelhardt, Wahle, Dicristo, Berardi, and Maffei, unpublished results).
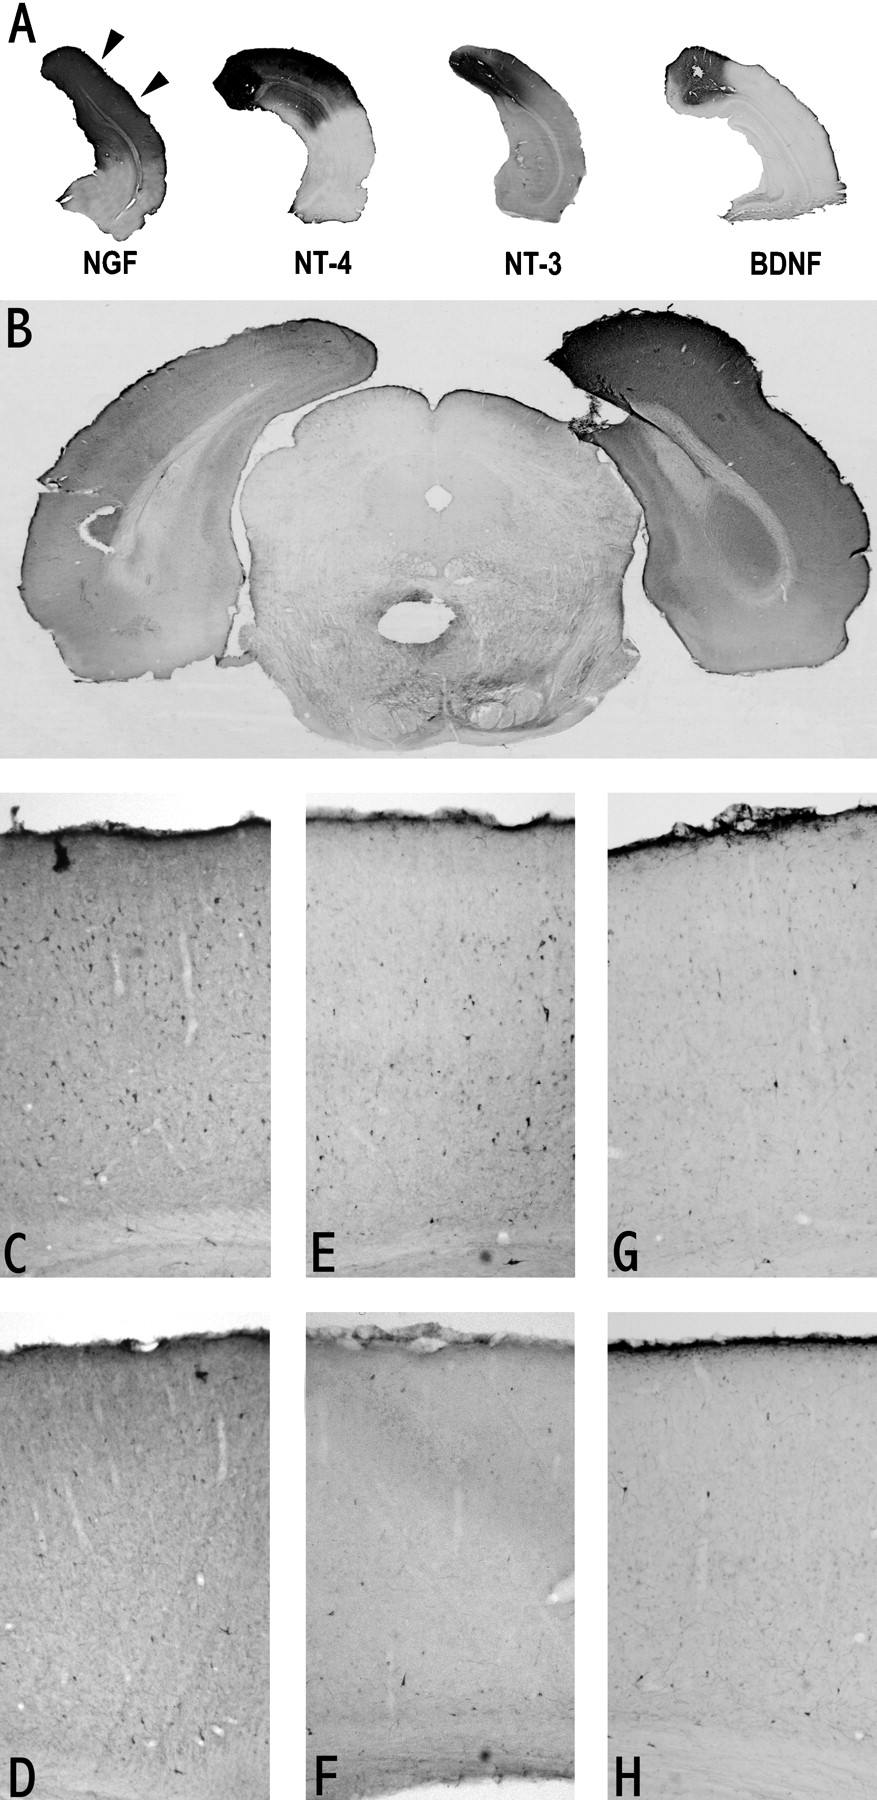
A, Coronal sections through the primary visual cortex immunostained to visualize the extent of diffusion of the infused neurotrophins. Arrows indicate the binocular portion of Oc1B. Neurotrophin concentration in the minipump: BDNF, 1.6 μg/μl; NGF, 1 μg/μl; NT-4, 0.56 μg/μl; NT-3, 0.9 μg/μl. B, Coronal section at the level of the primary visual cortex immunostained to visualize BDNF (8.3 μg/μl in the minipump) diffusion in the infused cortex (right) after 1 week of infusion. At this concentration, BDNF immunostaining is clearly detectable at the recording zone.C–H, Sections of primary visual cortex immunostained to reveal NPY-positive neurons in BDNF (8.3 μg/μl; C, D)-, NT-4 (E, F)-, and CytC (G, H)-treated animals (top, treated cortex;bottom, contralateral untreated cortex). Only in BDNF- and NT-4-infused cortex the number of NPY stained neurons is higher with respect to the control cortex; the increase is more evident for BDNF.
Effects of NGF and NT-4
In normal P28 rats (n = 8; Fig.2, NOR) the overwhelming majority (95%) of visual cortical cells are binocular; there is a clear dominance of the contralateral eye (44% of the cells are in classes 2 and 3, 3.7% in class 1, only 18% in classes 5 and 6, and no cell in class 7), reflecting the high percentage of crossed retinal fibers. As previously shown (Fagiolini et al., 1994; Pizzorusso et al., 1999), 1 week of monocular deprivation at the peak of the critical period is sufficient to induce a strong shift of the ocular dominance distribution toward the dominance of the open eye and a reduction in binocularity. Indeed, in control animals intracortically infused with Cytochrome C (n = 3; Fig. 3, CYT), 88% of cells are dominated exclusively (38% in class 7) or predominantly (50% in classes 5 and 6) by the undeprived eye. Intracortical infusion of NGF (1 μg/μl) or NT-4 (0.56 μg/μl) during the deprivation period counteracts the effects of monocular deprivation (Fig. 2; NGF, n = 4 and NT-4,n = 7); indeed binocularity is almost identical to that in normal animals in both cases (91 and 94% of cells in classes 2–6 for NT-4 and NGF, respectively), the undeprived eye dominance is significantly diminished (only 1.7 and 7% of cells in class 7 for NGF and NT-4 rats), and the deprived eye is able to drive and even dominate a good percentage of visual cortical neurons (higher for NGF than for NT-4, 37.6 and 22% of cells in classes 2 and 3, respectively;p < 0.001). These effects of NGF and NT-4 are not accompanied by detectable alterations of either spontaneous or visually evoked activity of cortical cells (see next section).

Differential effects of neurotrophins on ocular dominance plasticity. Ocular dominance distribution for the different experimental groups: NOR, normal P28 rats (n = 6; 190 cells); CYT, monocularly deprived. CytC (1 μg/μl)-treated control rats (n = 3, 108 cells); NGF, monocularly deprived, NGF (1 μg/μl)-treated rats (n = 4; 173 cells); NT-4, monocularly deprived, NT-4 (0.56 μg/μl)-treated rats (n = 7; 245 cells);NT-3, monocularly deprived NT-3 (8.3 μg/μl)-treated rats (n = 3; 73 cells); and BDNF,monocularly deprived, BDNF (8.3 μg/μl)-treated rats (n = 4; 146 cells). Both NGF and NT-4 distributions are significantly different from that of control Cyt C-treated rats,p < 0.001, χ2, ν = 4. The distribution of NT-3 does not differ from that of CytC animals. BDNF distribution significantly differs from all the other distributions shown in figure (p < 0.001).

Scatter plot summarizing ocular dominance for each group of animals: ipsilateral and binocular indexes are reported for each group (mean ± SD). NT-3 (n = 6) and CytC (n = 6) animals group together (no significant difference) both for the ipsilateral and for the binocular index and differ from the group normal (n = 6). NGF, NT-4, and normals group together (p > 0.05) for both indexes. BDNF differs from both NT-3 and Cyt C for the ipsilateral (p < 0.001) but not for the binocular index; it differs from normal for both indexes (p < 0.01) (one-way ANOVA, 5 df,post hoc Tukey's Test).
Effects of NT-3 and BDNF
At comparable doses for which NT-4 and NGF were clearly effective on ocular dominance plasticity, NT-3 (0.9 μg/μl; n= 3) was totally ineffective in counteracting the shift in ocular dominance distribution induced by MD, despite its good diffusion to the recording zone. Indeed the ocular dominance distribution in NT-3-treated rats is almost superimposable on that of control Cyt C-treated rats (90% of the cells in classes 5–7, data not shown). To evaluate whether this failure could be ascribed to an insufficient amount of NT-3 in the recording zone, we have increased its concentration in the minipump to 8.3 μg/μl. Even at this higher dose NT-3 (n = 3) failed to counteract MD effects (Fig.2, NT-3, no significant difference with respect to the ocular dominance obtained at the lower dose).
BDNF treatment at the low dose (1.6 μg/μl; n = 3) was totally ineffective in counteracting the ocular dominance shift, possibly because of poor diffusion (58% of cells in class 7; 33% in classes 5 and 6, data not shown). At the higher dose, BDNF (8.3 μg/μl; n = 4, Fig. 2) attenuated the MD-induced shift in ocular dominance, although the distribution is still significantly different from that of normal animals as well as from that of NGF- and NT-4-treated MD animals, (p < 0.001). The data reported in Figure 1 suggest that the low efficacy of BDNF at the higher dose in restoring a normal ocular dominance distribution with respect to NGF and NT-4 cannot be ascribed to poor diffusion. Even this partial effect of BDNF on ocular dominance plasticity is accompanied by a significant effect on visual cortical cell electrical activity, both spontaneous and visually evoked (see next section).
Ocular dominance distribution for MD animals treated with high (8.3 μg/μl) dose of Cytochrome C (n = 3) was identical to that found for the low (1 μg/μl) dose (data not shown).
The ocular dominance data for all animals recorded are summarized in Figure 3. For each group, the ipsilateral index, which is a measure of the ipsilateral eye (open eye in MD animals), dominance, and the binocular index, which is a measure of binocularity, are reported. The data for low and high doses of NT-3 are pooled together, because they are not statistically different; the same has been done for low and high doses of Cytochrome C.
All normal animals are characterized by high binocular index values (mean value, 0.61 ± 0.5) and a low level of ipsilateral index (mean value, 0.07 ± 0.039) and therefore fall in the bottom right quadrant; on the contrary, monocularly deprived Cytochrome C-treated rats have very high ipsilateral indices (mean value, 0.64 ± 0.03) and low binocular indexes (0.35 ± 0.04) and fall in the top left quadrant. It is clear from Figure 3 that the values for NGF- and NT-4-treated MD animals group with those of normal animals (no statistical difference). The values for NT-3 MD animals group with those of control Cytochrome C-treated animals. The indices for BDNF MD animals are clearly intermediate between the two clusters formed by the other groups (one-way ANOVA, post hoc Tukey test,p < 0.001). In particular, binocular index is quite low in BDNF animals (mean binocular index, 0.46 ± 0.1; not significantly different from that in CytC MD animals).
To assess whether neurotrophins had differential effects on ocular dominance according to the cortical layer, we calculated the ipsilateral index separately for layer II-III, layer IV, and layers V-VI for each animal in the different experimental groups. None of the neurotrophins showed layer-specific effects on ocular dominance (one-way ANOVA, 2 df, p > 0.05).
Effects of NGF, BDNF, NT-4, and NT-3 on spontaneous and visually evoked activity of rat visual cortical neurons
The evaluation of the effects of the different neurotrophins on the activity of visual cortical cells is important both to understand their effects in vivo on synaptic transmission and to gain insight into their possible mechanisms of action in modulating synaptic plasticity. Here we report data on the spontaneous and visually evoked activity of visual cortical neurons recorded in our normal and MD-treated animals.
Spontaneous discharge
At this age, spontaneous activity has rather low frequency (median, 3 spikes/sec; interquartile ranges, 1.8–4.6 spikes/sec), a value still slightly lower than in adult animals (Fagiolini et al., 1994) and is characterized by the presence of periods of silence up to 1–2 sec, with the tendency of action potentials to be separated by relatively long intervals (Fig.4A, NOR). The treatment with Cyt C, NGF, NT-4, and NT-3 (low or high dose) does not alter significantly this pattern of spontaneous activity (Fig.4A,B). BDNF (8.3 μg/μl) increased the mean firing rate of visual cortical cells. In particular, in BDNF-treated animals, cell spontaneous discharge was rich in trains of spikes with short (<20 msec) interspike distance (Fig. 4A). In Figure4B box plots summarizing the distribution of spontaneous activity for all groups are depicted. It is evident that only for BDNF (median value 8, interquartile 5–15) there is a significant increase with respect to normal and control Cyt C animals (Kruskal–Wallis one-way ANOVA on ranks, p < 0.01).

A, Examples of spontaneous discharge for cells recorded in normal and neurotrophin-treated animals. Each vertical bar is an action potential.B, Box plots summarizing the distribution of spontaneous discharge for cells recorded in normal animals (125 cells), MD + NGF (46 cells), MD + NT-4 (91 cells), MD + CytC (57 cells), MD + BDNF (8.3 μg/μl, 92 cells), and MD + NT-3 (94 cells). For each box plot, thecentral horizontal line is the median value, and the other two horizontal lines are the 25 and 75% interquartile ranges; the open square is the mean value, and the vertical bars are the SDs. Data for animals treated with NT-3 at both concentrations used (0.9 μg/μl and 8.3 μg/μl) have been pooled together because the two distributions did not differ. Only BDNF distribution significantly (asterisk) differs from those in normal and CytC-treated control animals (Kruskal–Wallis one-way ANOVA on ranks, p < 0.001).
The increase in spontaneous discharge found in BDNF cells is accompanied by a modification of the temporal patterning of the cell discharge. Indeed, the interspike interval distribution for these cells shifts toward shorter interspike intervals [median value, 30 msec (interquartile 10–56 msec); Kruskal–Wallis one-way ANOVA on ranks across treatments, p < 0.001, followed by a post hoc Dunn's test] with respect to that found in normal [156 msec (64–325 msec)] or in the other MD-treated animals [NGF, 144 msec (66–344 msec); NT-4, 140 msec (60–283 msec); NT-3, 140 msec (51–290 msec); Cyt C, 140 msec (60–335 msec)]. In addition, very few interspike intervals longer than 300 msec, which are typically present in normal cell discharge, are found in BDNF cells.
It has been previously shown (Contreras and Steriade, 1995; Steriade et al., 1996) that neocortical cells show periodic oscillations in their spontaneous activity over different frequency ranges that are indicators of the cortical and thalamocortical circuitry state. We asked whether BDNF treatment affected the intrinsic periodicity of spontaneous discharge of visual cortical cells. We have therefore performed autocorrelation of spontaneous discharge in cells recorded in normal and BDNF-treated animals under the same conditions and levels of anesthesia (see Materials and Methods).
In normal animals, the great majority of the cells examined (18 of 20) exhibited a slow (<1 Hz) oscillation of their spontaneous discharge (Fig. 5, top), as already described for the cat (Steriade et al., 1996). In BDNF-treated animals, by contrast, only 2 of 18 cells presented this type of periodicity (Fig. 5, bottom). Treatment with NGF, NT-3, or NT-4 did not affect the intrinsic periodicity of spontaneous firing. Indeed, the spontaneous discharge of cells recorded in animals treated with these neurotrophins showed slow oscillations as in normals (16–17/18 cells per group exhibiting oscillations, see examples in Fig. 5, middle rows). Because this slow oscillation is considered to be an emergent property of cortical circuitry (Steriade et al., 1996), its modification by BDNF witnesses BDNF strong effectiveness in modulating cortical circuitry (Rutherford et al., 1998; Sherwood and Lo, 1999;Turrigiano, 1999).

Examples of autocorrelograms for the spontaneous discharge of cells recorded in normal and neurotrophin-treated animals.
Cell responsiveness
To evaluate quantitatively cell responsiveness to visual stimulation we have computed for each cell the peak-to-baseline ratio (Fox et al., 1989; Pizzorusso et al., 1999; Rittenhouse et al., 1999), namely, the ratio between peak firing rate in response to an optimal visual stimulus and the rate of spontaneous discharge. We have found a lower responsiveness in cells recorded in BDNF-treated animals with respect to normal rats or MD animals treated with the other neurotrophins or Cyt C (Fig. 6). In Figure 6A, examples of PSTH for normal and treated animals are shown: it is evident a lower peak-to-baseline ratio in the example from BDNF-treated animals with respect to the other examples shown. In Figure 6B the cumulative fraction of recorded neurons is reported as a function of the peak-to-baseline ratio. It is clear that the curve for BDNF animals is significantly shifted to the left, that is toward lower peak-to-baseline ratios, with respect to all the others (p < 0.05, K–S test).
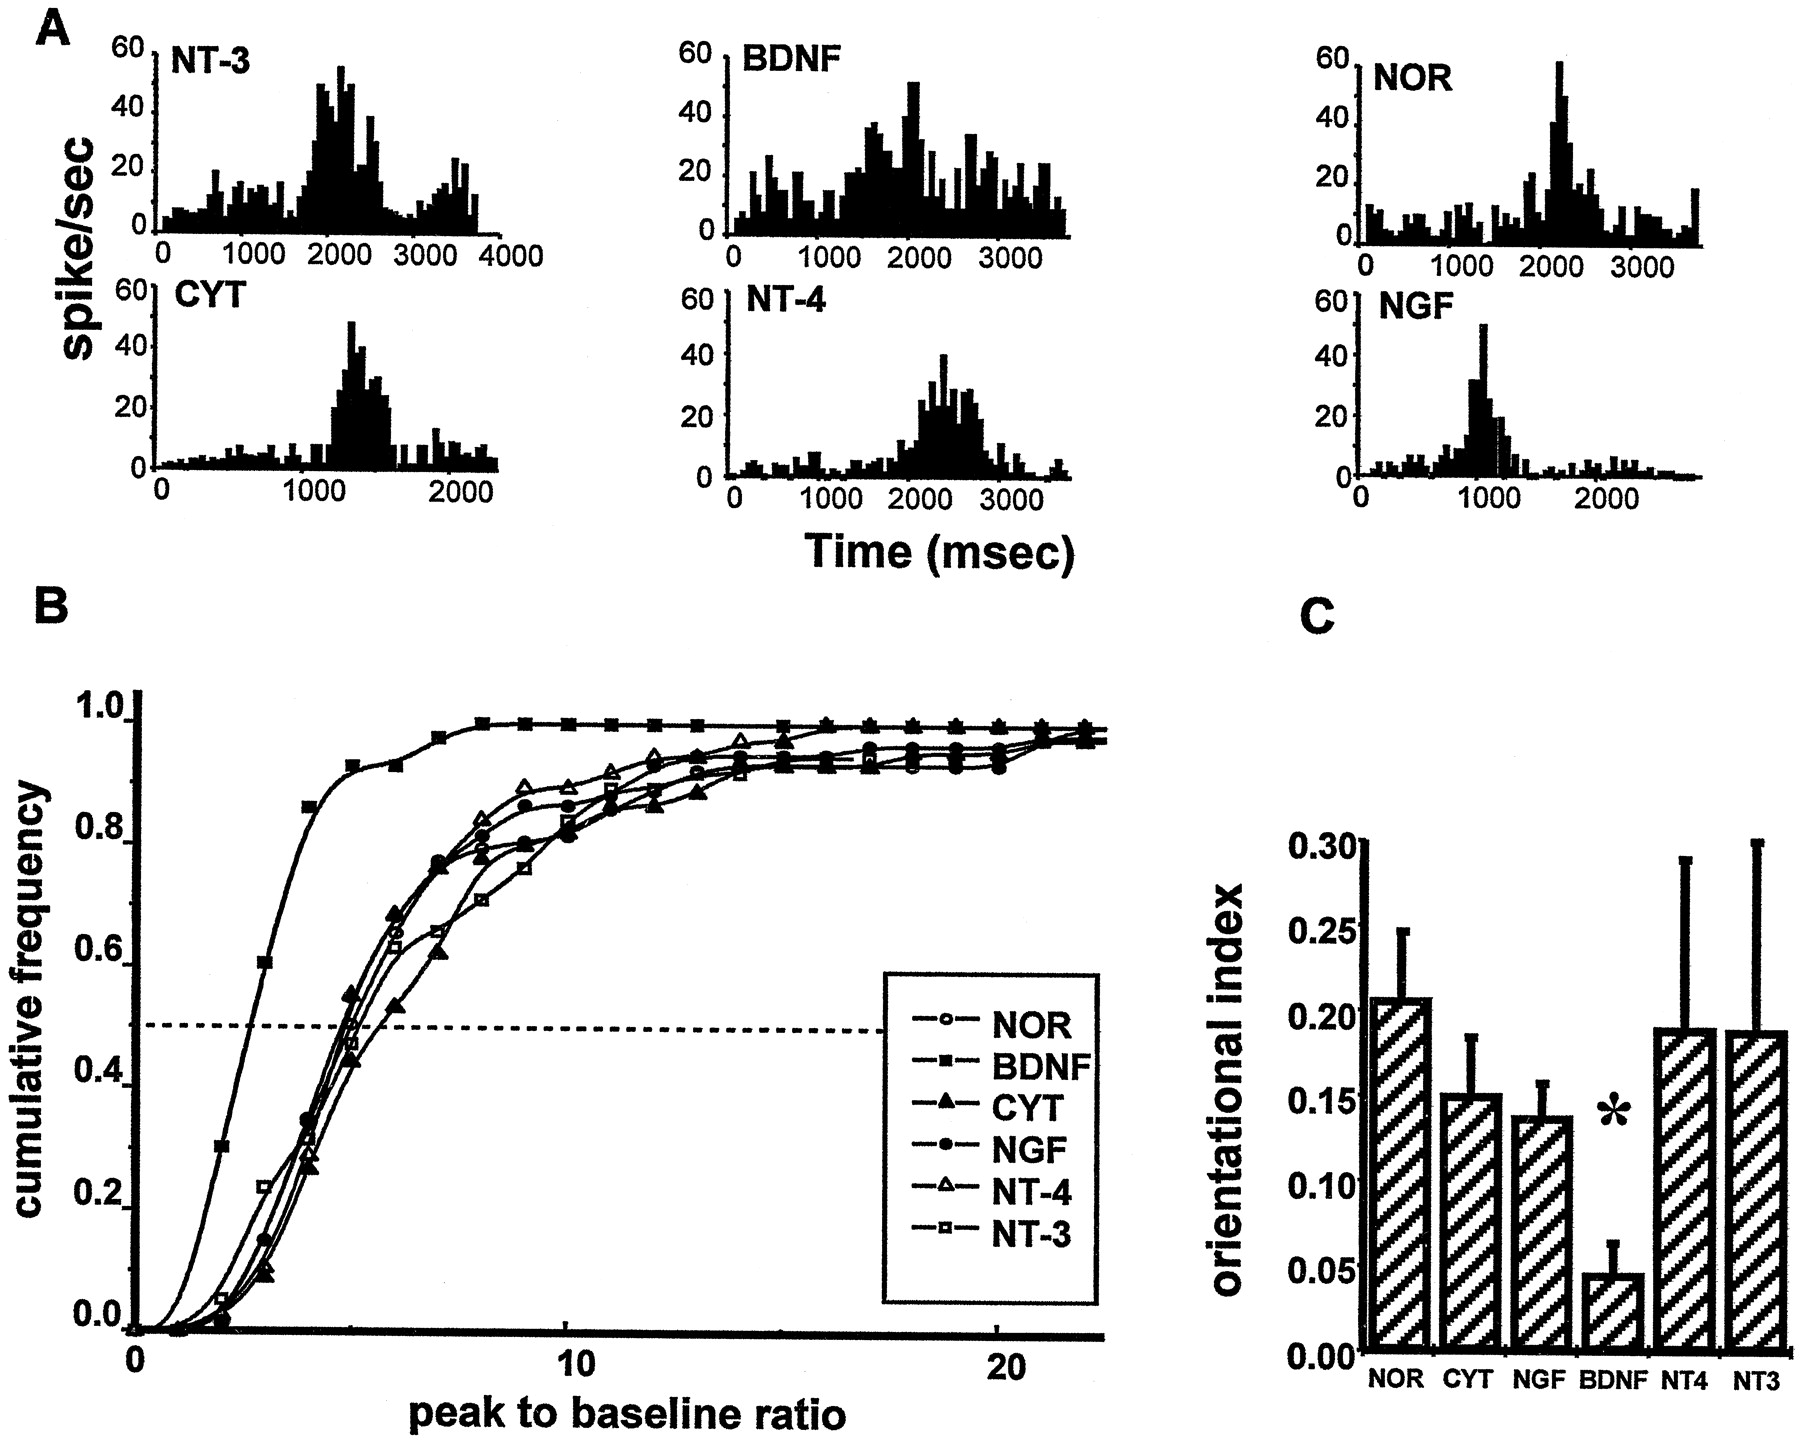
A, Examples of PSTHs for cells recorded in normal, BDNF (8.3 μg/μl)-, NT-3-, CytC-, NT-4-, and NGF-treated animals. Visual stimulus, light bar drifting at 28 or 46°/sec, period of the stimulation 3.8 or 2.23 sec, presented to the dominant eye; for each record, the cell discharge has been averaged over 20 stimulus periods. B, The cumulative fraction of the total number of neurons is plotted against the peak-to-baseline ratio values. The frequency values represent the fraction of cells with peak-to-baseline ratio less than or equal to a given peak-to-baseline ratio. Normal, 94 cells; NGF, 61 cells; NT-4, 62 cells; BDNF (8.3 μg/μl), 58 cells; NT-3, 57 cells; and CytC, 47 cells. BDNF curve is significantly shifted to the left with respect to the others (K–S test, p < 0.05). C, Orientation selectivity index of each group of animals (mean ± SD). Number of animals as in Figure 1 and 2. Only BDNF significantly differs from normal and Cyt C-treated animals (asterisk,p < 0.01).
Orientation selectivity
At this age orientation selectivity is not fully developed, and a good proportion of cells are still non-orientation-selective (Fagiolini et al., 1994; Pizzorusso et al., 1999). For each animal, orientation selectivity of recorded cells has been summarized by the orientation index (see Materials and Methods). Figure 6C shows that only BDNF treatment significantly lowers orientation selectivity.
Receptive field size
We have measured receptive field size from the PSTH for normal and treated animals. The observed values of receptive field size for normal animals (18 ± 9°; n = 80) are similar to those measured, at a corresponding age, by Fagiolini et al. (1994). None of the treatments significantly affected receptive field size (one-way ANOVA, mean values, Cyt C, 22 ± 10°; BDNF, 22 ± 9.7°; NT-4, 22 ± 7.5°; NT-3, 23 ± 8.5°; NGF, 19 ± 10°; n = 45 for each group).
Interestingly, in 29% of the cells of normal animals, we have noticed the presence of a depression in mean firing rate with respect to the spontaneous discharge on one or both sides of the excitatory response in the PSTH, which could signal the presence of an inhibitory component in the response. This feature is encountered significantly more often after BDNF treatment (55% of the cells; z-test;p = 0.048). No effect was observed with the other neurotrophins (NT-3, 36%; NGF, 23%; NT-4, 20%).
In summary, BDNF emerges from this analysis as the neurotrophin most active in modulating cell electrical activity in vivo. In particular, our data show a striking difference between the actions of the two trkB ligands as compared to the similarity between NGF and NT-4.
NT-4 and BDNF induce different effects on ocular dominance close to the infusion site
BDNF infusion in the visual cortex of monocularly deprived kittens causes a quite unexpected effect, in that the deprived eye becomes the dominant eye when recordings are made close (within 2–2.5 mm) to the infusion cannula (Galuske et al., 1996). Prompted by the differences between NT-4 and BDNF described in the previous sections, we investigated whether this paradoxical effect also occurred for the other trkB ligand, NT-4, and whether it was correlated with specific alterations in visual cortical cell functional properties. We found that BDNF induces a paradoxical shift in ocular dominance distribution close (1.5–2 mm) to the infusion cannula, whereas NT-4 does not. At this distance, however, both treatments strongly decrease cell responsiveness and orientation selectivity.
To be able to sample different distances from the cannula along the representation of the vertical meridian, we modified the implant of the cannula as depicted in the sketch in Figure7C. We have recorded from 1 to 4 mm from the cannula in steps of 250–300 μm in two BDNF, two NT-4, and two Cyt C-treated MD rats. We have found that in penetrations located between 3 and 4 mm from the cannula (data not shown) all results were identical to those obtained with the implant located 1 mm from the midline (Figs. 2, 3, 6).

A, Ocular dominance distributions for recordings close (1.5–2 mm) to the cannula. Ocular dominance distributions for MD + BDNF (8.3 μg/μl; N = 2;n = 74) significantly differ from those of NT-4 (0.56 μg/μl; N = 2; n= 87) and CytC (8.3 μg/μl; N = 2,n = 78); the latter two also differ significantly (χ2, 4 df, p < 0.001).B, Mean peak-to-baseline ratios as a function of the distance from the infusion site, for CytC-, NT-4-, and BDNF-treated animals (mean ± SEM). At distances from the cannula <1 mm, no visual-evoked responses could be recorded. A two-way ANOVA (distance × treatment, 2 × 3) has been performed to analyze the difference between the three treatments at two distances, 1.5–2 mm and 3–3.5 mm. The results show that the factor distance as well as the factor treatment is significant (p < 0.001). There is also a significant interaction between treatment and distance (p = 0.01). Values obtained at 1.5–2 mm differ from those obtained at 3–3.5 mm both for CytC and NT-4. At 1.5–2 mm, BDNF (n = 34) and NT-4 (n = 46) do not differ from each other, and both differ from CytC (n = 37). At 3–3.5 mm NT-4 and CytC do not differ from each other, and both differ from BDNF (Tukey test). C, Sketch of the implant and recording sites. Recordings were made at 1.5–2 mm or 3–3.5 mm from the cannula, along the representation of the vertical meridian. V.M, Vertical meridian;Inf site, infusion site; Rec sites,recording sites.
In penetrations located between 1.5 and 2 mm from the cannula we found that BDNF clearly produces a paradoxical ocular dominance distribution strongly dominated by the closed eye (52% of monocular cells in class 1; Fig. 7A, left), whereas NT-4 does not (Fig. 7A, center) and retains the preventive effect already documented in recordings further away from the cannula. Cyt C (8.3 μg/μl)-treated rats recorded at 1.5–2 mm from the cannula show the classical ocular dominance shift (Fig. 7A, right) of monocularly deprived animals. At this distance from the cannula, however, the electrical activity is profoundly altered. Cell responsiveness is now very poor both for BDNF and for NT-4 rats (median values for peak-to-baseline 2 and 1.9 for BDNF and NT-4, respectively) and significantly lower than for cells recorded further away from the infusion site, as shown in Figure 7B. The orientation selectivity is completely absent (all recorded cells were non-orientation-selective). Also in Cyt C-treated animals there is a significant decrease in cell responsiveness at this distance from the cannula, although CytC cell responsiveness is significantly higher than BDNF and NT-4 cells, and there is no change in orientation selectivity (orientational index, 0.148). This suggests the possibility of some aspecific effects for the infusion of high protein amounts in the cortex close to the infusion site.
In penetrations located ∼1 mm from the cannula we have found in all animals that cells were nearly devoid of spontaneous activity, and it was almost impossible to find responsive neurons (Fig. 7B), suggesting that at such close distance the infusion might have caused aspecific damage to the cortex (Kasamatsu et al., 1998).
The possibility of inducing a paradoxical dominance of the deprived eye seems to be present only for BDNF treatment and not for NT-4. On the contrary, the poor cell responsiveness and the lack of orientation selectivity are equal for both BDNF and NT-4 treatments. Thus, it is not possible to correlate the occurrence of the paradoxical shift with the alteration of a specific functional property of visual cortical cells. It seems to be a specific difference between the action of BDNF and NT-4 on the balance of ocular dominance distribution.
DISCUSSION
We compared the action of neurotrophins on visual cortical physiology and plasticity, probed with the paradigm of monocular deprivation. The main finding is that, with the exception of NT-3, all neurotrophins affect the outcome of monocular deprivation, although there are clear differences in their mechanisms of action.
The lack of effect of NT-3 is consistent with its inability to prevent the shrinkage of LGN neurons in monocularly deprived ferrets (Riddle et al., 1995) and to interfere with the formation of ocular dominance columns in kitten visual cortex (Cabelli et al., 1995, 1997). It is likely that the action of NT-3 on visual cortical cells occurs at more immature ages, as suggested by the developmental pattern of expression of NT-3 and its receptor trkC (Schoups et al., 1995; Das et al., 1998).
NGF and NT-4 are both able to counteract the effects of monocular deprivation; this action is not accompanied by any detectable alteration in cell responsiveness or selectivity. BDNF, at a dose comparable to that of NGF and NT-4 is ineffective on ocular dominance plasticity, probably because of poor diffusion; at higher doses it is less potent than NGF or NT-4 in counteracting the shift in ocular dominance distribution, in particular in maintaining a normal binocularity. BDNF has a peculiar characteristic: it is the only neurotrophin that alters visual cortical cell electrical activity, both spontaneous and evoked. Particularly interesting seems the similarity between the effects of NGF and NT-4, which bind to different receptors, especially if compared with the difference in action between the two trkB ligands, BDNF and NT-4. This difference becomes striking close to the infusion site, where BDNF, but not NT-4, induces a paradoxical dominance of the deprived eye.
The effect of BDNF on ocular dominance plasticity is accompanied by a strong alteration of electrical activity
The strong correlation between BDNF action on monocular deprivation and its effects on electrical activity raises the possibility that a causal link between these two actions might exist. BDNF modulation of cortical activity could explain all of the effects reported in this paper. The paradoxical shift of ocular dominance distribution in favor of the deprived eye close to the infusion cannula, where BDNF concentration is extremely high, could be directly related to a strong enhancement of inhibitory tone. Indeed, intracortical infusion of muscimol, a GABAAagonist, produces the same shift toward the deprived eye (Reiter and Stryker, 1988). The other peculiar effects of BDNF, namely the increase in spontaneous activity, the reduction in cell responsiveness, and the alteration in temporal patterning of spontaneous discharge, could be ascribed to an alteration of the balance between excitation and inhibition (Rutherford and et al., 1997, 1998; Turrigiano, 1999). Indeed, the cortical actions of BDNF are not limited to inhibitory circuitry, and a potentiation of excitatory synapses has also been reported (Akaneya et al., 1997; Carmignoto et al., 1997).
The disorganization of cortical activity and in particular the increase in spontaneous activity could explain the effect of BDNF on MD. In favor of this hypothesis is the finding that a disorganization of cortical activity induced by glutamate (Shaw and Cynader, 1984) attenuates the effects of monocular deprivation. The mild effects of BDNF on MD have been recently confirmed in transgenic mice overexpressing BDNF in the forebrain. These animals show normal effects of MD, although BDNF overexpression induces an early closure of the critical period (Hanover et al., 1999; Huang et al., 1999). Interestingly, the electrical activity of visual cortical cells of BDNF mice did not show gross pathological alterations (Hanover et al., 1999) possibly because of the different way used in this experiment to make more BDNF available to cortical neurons. For instance, the CaMKII promoter used by Huang et al. (1999) results in a gradual increase in BDNF levels in the visual cortex starting from P7 and stabilizing at P20 to a level (3–5 folds the endogenous level) much lower than that presumably reached with exogenous administration. In addition, it drives the BDNF transgene expression mainly to the cellular population expressing endogenous BDNF.
The multiple potential sites of action of BDNF in the visual cortex make it difficult to delineate a precise mechanism for the effects of BDNF. BDNF receptor trkB is present on basal forebrain afferents and cortical and geniculate neurons (Cabelli et al., 1996; Yan et al., 1997). Furthermore, BDNF increases both ACh and glutamate release from cortical synaptosomes (Sala et al., 1998) and modulates excitatory transmission and synaptic efficacy in the visual cortex (Akaneya et al., 1997; Carmignoto et al., 1997).
Recent results suggest that peculiar of BDNF is an important role in regulating the development and function of inhibitory circuitry. Indeed, trkB is present on inhibitory interneurons in rat visual cortex (Cellerino and Maffei, 1996); BDNF regulates the expression of neuropeptides characteristics of this cell type, such as NPY (our data and Nawa et al., 1993), and controls the activity dependent balance of excitation and inhibition in cultured cortical neurons (Rutherford et al., 1997, 1998; Turrigiano, 1999). BDNF, but not NGF, promotes GABA release from cortical synaptosomes (Sala et al., 1998). More recently, evidence for an accelerated development of intracortical inhibition has been reported in transgenic mice overexpressing BDNF (Huang et al., 1999).
It should not be forgotten that BDNF seems to modulate also serotonergic (5-HT) cortical afferents and increases 5-HT release (Mamounas et al., 1995; Celada et al., 1996; Lyons et al., 1999); serotonin is a potent modulator of visual cortical activity (Roerig and Katz, 1997), plasticity (Gu and Singer, 1995; Wang et al., 1997), and connectivity both in the visual and in the somatosensory systems (Cases et al., 1996). In mice with null mutation for monoamine oxidase 4, 5-HT levels are high, barrels are absent from the somatosensory cortex (Cases et al., 1996), and retinal axons fail to segregate normally (Upton et al., 1999).
NGF and NT-4 prevent the effect of monocular deprivation without perturbing cortical activity
NT-4 and NGF prevent the effects of monocular deprivation, but this is not accompanied by significant alterations of cortical electrical activity. The substantial difference between the effects of NT-4 and NGF and those of BDNF suggests that the mechanisms underlying their actions are different.
NGF
Although it is not known which receptors mediate the action of neurotrophins pharmacologically infused at high doses, our observation is in agreement with recent results showing that activation of NGF receptor trkA in the visual cortex is sufficient to prevent the effects of monocular deprivation (Pizzorusso et al., 1999). In the visual cortex, TrkA is most probably localized on afferents originating from basal forebrain cholinergic neurons and, possibly, on cortical neurons (Miranda et al., 1993; Sobreviela et al., 1994; Gibbs and Pfaff, 1998;Sala et al., 1998; Pizzorusso et al., 1999). These two neural populations are therefore likely sites of NGF action and could probably act synergistically. The cholinergic projections to the visual cortex play a permissive role in gating ocular dominance plasticity (Bear and Singer, 1986). Recent results suggest that also the action of NGF could be permissive; indeed the block of spontaneous activity of retinal ganglion cells causes a failure of NGF action in preventing MD effects (Caleo et al., 1999b), indicating that electrical activity in the visual afferent pathway is required for NGF effects on ocular dominance plasticity. NGF could modulate the level of activity in the cholinergic system (Rylett and Williams, 1994) and therefore indirectly regulate the modification of cortical synapses. This action could occur without obvious changes of spontaneous activity because it is known that cholinergic agonists can modulate plasticity of cortical cells without affecting spontaneous activity and decreasing stimulus selectivity (Sato et al., 1987; Sillito, 1993). On the other hand, NGF potentiates glutamate release from rat visual cortical synaptosomes (Sala et al., 1998), suggesting that a direct action of NGF mediated by cortical glutamatergic circuitry is also possible.
NT-4
The different actions of BDNF and NT4 on cortical activity are intriguing. Potentially, because BDNF and NT-4 share the same receptor, trkB, their action on visual cortical plasticity should be analogous. However, recent experiments indicate that the activation of the trkB receptor by different ligands can trigger different pathways of signal transduction, resulting in a diverse physiological action. For instance, transgenic mice with point mutation of trkB that affects the binding of adaptor protein shc show impaired responses to NT-4 but not to BDNF (Minichiello et al., 1998). An additional possibility is that different trkB isoforms could have distinct specificities for BDNF and NT-4 (Boeshore et al., 1999). In the visual system, several anatomical studies have shown that the physiological actions of NT-4 and BDNF are substantially different. Both neurotrophins regulate dendritic morphology of pyramidal cells, but each neurotrophin has a distinct pattern of layer specificity (McAllister et al., 1995). In addition,Riddle et al. (1995) showed that, whereas NT-4, locally delivered to thalamic afferents by means of microbeads, is effective in preventing the shrinkage of LGN neurons in monocularly deprived ferrets, BDNF is ineffective. Our electrophysiological study demonstrates that a substantial difference between the effects of BDNF and NT-4 is present also in vivo at functional level.
What could be the target of NT-4 action? NT-4 has a restricted pattern of expression in the visual cortex, being produced at high levels only in layers IV and V (Friedman et al., 1998; Bozzi and Borrelli, 1999). This localized pattern of expression together with its efficacy in preventing the shrinkage of the cell body of deprived geniculate neurons suggests that NT-4 could be active at the level of thalamic afferents without grossly interfering with cortical activity.
In conclusion, the simultaneous analysis of visual cortical cell discharge and ocular dominance plasticity suggests that BDNF, NGF, and NT-4 play their roles in visual cortical plasticity through different mechanisms, in particular through a different interplay with electrical activity. To what extent this is attributable to a difference in cellular targets of these neurotrophins or to a difference in intracellular signaling is a next open question.
Footnotes
This work was supported by EEC BIOMED contract BMH4-CT96–1604, Consiglio Nazionale delle Ricerche Targeted project Biotechnology SP 5, and Ministero dell'Universita e della Ricerca Scientifica e Tecnologica COFIN. We thank Dr. J. M. Conner for the kind gift of the anti-NGF antibody, Dr. Q. Yan for the kind gift of the anti-BDNF antibody, Dr. D. Mercanti for supplying NGF, and Regeneron for supplying human recombinant NT-4, NT-3, and BDNF. Dr. G. Tinivella helped with the autocorrelation.
C.L. and N.B. contributed equally to this paper.
Correspondence should be addressed to Dr. Claudia Lodovichi and Nicoletta Berardi, Istituto di Neurofisiologia del Consiglio Nazionale delle Ricerche, Via San Zeno 51, 56127 Pisa, Italy. E-mail:lodovica{at}in.pi.cnr.it; berardi@in.pi.cnr,it.


