

Abstract
Although mitochondria mediate the delayed failure of cytoplasmic Ca2+ homeostasis [delayed Ca2+deregulation (DCD)] in rat cerebellar granule cells resulting from chronic activation of NMDA receptors, their role in AMPA/KA-induced DCD remains to be established. The mitochondrial ATP synthase inhibitor oligomycin protected cells against KA- but not NMDA-evoked DCD. In contrast to NMDA-evoked DCD, no additional protection was afforded by the further addition of rotenone. The effects of KA on cytoplasmic Ca2+ homeostasis, including the protection afforded by oligomycin, could be reproduced by veratridine. KA exposure induced a partial mitochondrial depolarization that was enhanced by oligomycin, indicating ATP synthase reversal. The nonglycolytic substrates pyruvate and lactate were unable to maintain Ca2+ homeostasis in the presence of KA. In contrast to NMDA, KA exposure did not cause mitochondrial Ca2+ loading. The data indicate that Na+ entry via noninactivating AMPA/KA receptors or voltage-activated Na+ channels compromises mitochondrial function sufficiently to cause ATP synthase reversal. Oligomycin may protect by preventing the consequent mitochondrial drain of cytoplasmic ATP.
- calcium
- cerebellar granule cells
- kainate
- mitochondrial membrane potential
- NMDA
- glutamate excitotoxicity
- glutamate receptors
Glutamate excitotoxicity plays a major role in neuronal cell death in the mammalian CNS after ischemia (Greene and Greenamyre, 1996; Henneberry, 1997; Lee et al., 1999). Excessive neuronal Ca2+ and Na+ loading occurs as a consequence of the prolonged elevation of extracellular glutamate and activation of postsynaptic receptors (Choi, 1987). Although much research modeling excitotoxicity in cell culture has focused on a privileged role for the NMDA receptor (Tymianski et al., 1993; Peng and Greenamyre, 1998;Sattler et al., 1998), the nondesensitizing activation of AMPA receptors by KA (Hollmann and Heinemann, 1994) can also induce necrotic (Kato et al., 1991; Brorson et al., 1994; Rajdev and Reynolds, 1994;Carriedo et al., 1998; Kiedrowski, 1998; Leski et al., 1999), apoptotic (Cheung et al., 1998; Larm et al., 1998), or mixed (Cebers et al., 1997) modes of cell death in a variety of primary neuronal cultures.
KA-mediated excitotoxicity is most apparent in those neurons whose AMPA/KA receptors are Ca2+ permeable as a consequence of the relative absence of glutamate receptor 2 subunits (Hollmann and Heinemann, 1994). These include cerebellar granule cells cultured in elevated KCl (Holopainen et al., 1989, 1990;Puttfarcken et al., 1992; Condorelli et al., 1993; Hack and Balázs, 1995; Savidge and Bristow, 1997, 1998) and the GABAergic subpopulation of cortical neurons (Carriedo et al., 1998, 2000). KA is also toxic toward a variety of neurons in which the increase in cytoplasmic free Ca2+([Ca2+]c) is small compared with that with NMDA receptor activation (Hyrc et al., 1997;Stout and Reynolds, 1999). AMPA/KA receptor activation is associated with a large elevation in cytoplasmic free Na+ (Courtney et al., 1995; Itoh et al., 1998; Kiedrowski, 1998), and cell death has been proposed to be primarily related to Na+ entry and consequent cell swelling (Bindokas and Miller, 1995; Kiedrowski, 1998).
The role of mitochondria in KA-mediated excitotoxicity is unclear. Hoyt et al. (1998) observed no acute effect of KA on Δψm in cultured cortical neurons. Kiedrowski (1998) reported a reversible depolarization, although plasma membrane depolarization may have contributed to the signal (Ward et al., 2000). Mitochondrial Ca2+ accumulation in response to KA has been reported in striatal (Peng and Greenamyre, 1998), cortical (Hoyt et al., 1998), and spinal motor (Carriedo et al., 2000) neurons. In this paper we examine the role of mitochondria in the acute KA-induced failure of cytoplasmic Ca2+ homeostasis [delayed Ca2+ deregulation (DCD)] of cultured rat cerebellar granule cells. In contrast to NMDA receptor-mediated DCD, the cells do not load their mitochondria with Ca2+ but do undergo a rapid failure of oxidative phosphorylation and are protected against DCD by ATP synthase inhibition, which further depolarizes the mitochondria and decreases the generation of reactive oxygen species. The effects can be mimicked by inhibiting the inactivation of voltage-dependent Na+ channels with veratridine, emphasizing the role played by Na+ entry into the cell.
MATERIALS AND METHODS
Materials. Fura-2 AM was obtained from TEF Labs (Austin, TX). Tetramethylrhodamine methyl ester (TMRM+), rhodamine-123, and dihydroethidium (hydroethidine) were obtained from Molecular Probes (Leiden, The Netherlands). (5R,10S)-(+)-5-Methyl-10,11-dihydro[a,d]cyclohepten-5,10-imine hydrogen maleate (MK-801) and 2,3-dioxo-6-nitro-1,2,3,4-tetrahydrobenzo[f]quinoxaline-7-sulfonamide disodium (NBQX) were obtained from Research Biochemicals (SEMAT, St. Albans, Hertfordshire, UK). Mn(III) tetrakis(4-benzoic acid) porphyrin chloride (MnTBAP) was purchased from Calbiochem (Nottingham, UK); a stock solution of 25 mm MnTBAP was prepared in 75 mm NaOH to obtain a final pH of 7.0–7.4. Fetal calf serum and minimal essential medium (MEM) were from Life Technologies (Paisley, Strathclyde, UK). Oligomycin, rotenone, KA, NMDA, glycine, FCCP, lactate, 2-deoxyglucose, and other reagents were from Sigma (Poole, Dorset, UK).
Culture of cerebellar granule cells. Preparation of cerebellar granule cells from 6-d-old Wistar rats was performed as described by Courtney et al. (1990). Cells were plated on 1.5% poly-d-lysine-coated glass coverslips (13 mm circle for nonperfusion experiments and 22 mm square for the perfusion experiments) at a density of 2.10 × 10⁵cells/cm2. Cells were cultured in MEM containing Earle's salts plus 10% (v/v) fetal calf serum, 25 mm KCl, 30 mm glucose, 2 mmglutamine, 100 μg/ml streptomycin, and 100 U/ml penicillin. After 18–24 hr, the medium was changed, and 10 μmcytosine arabinoside was added to prevent non-neuronal cell proliferation. Cerebellar granule cells were maintained in a humidified atmosphere of 95% air and 5% CO2, at 37°C, and used after 7–8 d in vitro.
Incubation conditions. Unless otherwise stated, experiments were performed in incubation medium containing (in mm): 120 NaCl, 3.5 KCl, 1.3 CaCl2, 1.2 MgCl2, 0.4 KH2PO4, 20 TES buffer, 5 NaHCO3, 1.2 Na2SO4, and 15 glucose, pH 7.4 (adjusted with NaOH), at 37°C. Nifedipine (1 μm) was additionally present. In experiments in which NMDA receptor activation was investigated, incubations were performed in Mg2+-free incubation medium. In experiments in which the effect of nonglycolytic substrates was analyzed, the cells were incubated in the absence of glucose and in the presence of 2 mm 2-deoxyglucose and 10 mmlactate or 10 mm pyruvate.
Imaging of single-cell fluorescence. Single-cell imaging of fluorescent probes was performed in a MiraCal Imaging system (Life Science Resources, Cambridge, UK), using a Nikon Diaphot-TMD inverted epifluorescence microscope equipped with a 40× oil immersion objective and Sutter filter wheel. Experiments were performed in a nonperfused thermostated chamber (300 μl final volume).
Cytoplasmic free Ca2+ and mitochondrial membrane potential. Intracellular Ca2+ fluorescence was monitored after loading with 3 μm fura-2 AM, for 30 min at 37°C, in incubation medium containing 30 μg/ml bovine serum albumin. After rinsing, the fluorescence ratio was determined after excitation at 340 and 380 nm and emission at >505 nm. For combined TMRM+ and fura-2 cell-imaging fluorescence, the cells were equilibrated with 50 nmTMRM+ and 3 μm fura-2 AM for 30 min (37°C) in incubation medium containing 30 μg/ml bovine serum albumin. After rinsing, the cells were maintained in the presence of TMRM+ and excited at 340, 380 and/or 488 nm, with emission at >515 nm. Although peak TMRM+ absorption occurs at longer wavelengths (Haugland, 1996), 488 nm excitation has the advantage of limiting photodynamic damage to the cells at the concentrations of TMRM+ required to observe matrix quenching. Cells were loaded with rhodamine-123 by incubating in the presence of 1.3 μm probe for 10 min at room temperature (22°C), followed by 3 μm fura-2 AM plus rhodamine-123 for 30 min at 37°C. After washing, the cells were maintained in the presence of 1.3 μm rhodamine-123. Combined rhodamine-123 and fura-2 fluorescence was monitored at excitation at 340, 380, and/or 548 nm, and emission was determined via a Chroma technology (Brattleboro, VT) fura-2–rhodamine beam splitter.
Data analysis. Single-cell responses are representative of the indicated number of experiments from independent cell preparations. Ethidium fluorescence data are the means ± SEM of the indicated number of individual cell somata from six to eight independent experiments. Statistical analysis was performed by the unpaired two-tailed Student's t test.
Whole-cell fluorescence simulation. The fluorescence of granule cells loaded with TMRM+ or rhodamine-123 was simulated using an Excel program exactly as described previously (Ward et al., 2000). The mitochondrial volume was set to 1% of the soma; external probe concentration was 50 nm. For TMRM+ the quench limit was 15 μm and the plasma membrane rate constant was 0.005; for rhodamine-123 the quench limit was 50 μm and the rate constant was 0.0005.
RESULTS
Delayed Ca2+ deregulation evoked by activation of NMDA or AMPA/KA receptors
Granule cells have a sufficiently high glycolytic activity to maintain cytoplasmic Ca2+ homeostasis and viability in the presence of the ATP synthase inhibitor oligomycin (Budd and Nicholls, 1996a). Because the in situmitochondrial membrane potential Δψm is retained and even enhanced in the presence of the inhibitor (Scott and Nicholls, 1980; White and Reynolds, 1996; Ward et al., 2000), the organelles continue to accumulate Ca2+ and generate reactive oxygen species (ROS). The further addition of a respiratory chain inhibitor such as rotenone allows Δψm to decay, preventing the mitochondria from accumulating Ca2+, but without affecting glycolytic ATP production (Budd and Nicholls, 1996a). Previous experiments have shown that the combination of oligomycin plus rotenone, but not oligomycin alone, protects granule cells against the DCD induced by chronic glutamate plus glycine exposure (Budd and Nicholls, 1996b; Castilho et al., 1998).
To compare the role of NMDA versus non-NMDA receptors in inducing DCD, the cells were exposed continuously in a nonperfusing chamber to either 100 μm NMDA or 10 μm glycine in Mg2+-free medium in the presence of the non-NMDA receptor antagonist NBQX (Hack and Balázs, 1995) and the L-type Ca2+ channel inhibitor nifedipine. Alternatively, AMPA/KA receptors were selected for by repeating the experiment with 100 μm KA in the presence of 1.2 mm Mg2+, MK-801, and nifedipine. DCD was observed after activation of both NMDA and AMPA/KA receptors (Fig. 1A,D), although Ca2+ deregulation induced by KA only occurred after 60–75 min (Fig. 1D). KA exposure did not induce the leakage of fura-2 within the time course of our experiments (cf. Kiedrowski, 1998).

Effect of mitochondrial inhibitors on delayed Ca2+ deregulation induced by NMDA plus glycine or by KA. A–C, Cells loaded with fura-2 were incubated in Mg2+-free medium containing 10 μmNBQX. Where indicated, the cells were stimulated with 100 μm NMDA plus 10 μm glycine.D–F, Cells were incubated in medium containing Mg2+ and 2 μm MK-801 and were stimulated with 100 μm KA. Experiments were performed in the absence of mitochondrial inhibitors (A, D) or in the presence of 5 μg/ml oligomycin (B, E) or 5 μg/ml oligomycin plus 2 μm rotenone (C, F). The inhibitors were added 5 min before the addition of the receptor agonists. Each figure shows traces from 23 to 34 somata. The frequency histograms indicate the range of fluorescence ratios observed in somata at the end of each experiment (60 min for NMDA and glycine and 90 min for KA). Data shown in each histogram are from at least four independent experiments and the indicated number of cells. gly, Glycine;oligo, oligomycin; rot, rotenone.
Mitochondrial depolarization by rotenone plus oligomycin protected the cells against both NMDA plus glycine-induced and KA-induced DCD (Fig.1C,F). However, a clear distinction between the effects of the two receptor agonists was seen when oligomycin was present alone. Although no significant difference was observed in the time or extent of DCD induced by NMDA plus glycine (Fig. 1, compareA,B), oligomycin alone protected against KA-induced DCD (Fig. 1, compare D,E). As shown by the horizontal histograms, <15% of 273 cells examined showed a fura-2 ratio >0.8 after 90 min of continuous exposure to KA in the presence of oligomycin, compared with 90% in the absence of the inhibitor.
As in the case of glutamate plus glycine (Budd and Nicholls, 1996b), KA addition to cells inhibited by rotenone in the absence of oligomycin was followed by immediate Ca2+deregulation (data not shown). Cells incubated in the absence of agonist and in the presence of 2 μm MK-801 or 10 μm NBQX maintained a stable baseline [Ca2+]c for at least 120 min even when the mitochondria were inhibited by oligomycin ± rotenone (data not shown).
Stimulation of cerebellar granule cells with KA can activate both KA and AMPA receptors (Hack and Balázs, 1995). However, concanavalin A (10 μm), which preferentially inhibits KA receptor desensitization (Partin et al., 1993), did not significantly enhance the KA-induced initial Ca2+ transient or the extent and timing of DCD (data not shown). Furthermore, 10 μm NBQX, which preferentially inhibits AMPA receptors (Sheardown et al., 1990), completely prevented the acute elevation of Ca2+ induced by KA addition. The KA responses reported here are thus caused by AMPA receptor activation. NBQX prevented DCD when added after KA addition but before the secondary rise in cytoplasmic Ca2+(DCD). However it did not reverse KA-induced DCD when added after DCD had been initiated (data not shown).
Ca2+ entry across the plasma membrane has been shown to be primarily responsible for the subsequent failure of cytoplasmic Ca2+ homeostasis induced by NMDA receptor activation. Thus increasing external Ca2+ concentration greatly potentiates the extent of DCD induced by glutamate plus glycine (Tymianski et al., 1993; Castilho et al., 1998). In contrast, elevated external Ca2+ does not affect KA-induced Ca2+ homeostasis (Fig.2). In the presence of oligomycin or oligomycin plus rotenone, cytoplasmic Ca2+homeostasis was maintained even in the presence of elevated external Ca2+ (Fig.2D,F).

Elevated external Ca2+ does not affect KA-induced delayed Ca2+ deregulation. Cells were loaded with fura-2 and incubated in medium containing 1.2 mm Mg2+, 2 μm MK-801, and either 1.3 mm (A, C, E) or 2.6 mm (B, D, F) Ca2+. Experiments were performed in the absence of mitochondrial inhibitors (A, B) or in the presence of 5 μg/ml oligomycin (C, D) or oligomycin plus 2 μm rotenone (E, F). KA (100 μm) was added at least 5 min after addition of the mitochondrial inhibitors, and the frequency histograms show the 340/380 nm ratios for the indicated number of cell somata after a 90 min exposure to the agonist. Data shown in each histogram are from at least three independent experiments.
Delayed Ca2+ deregulation induced by veratridine
The contrast between the high-Ca2+dependency of NMDA-induced DCD (Castilho et al., 1998) and the relative insensitivity to elevated external Ca2+shown in Figure 2 is consistent with the proposal made by Kiedrowski (1998) that the effects of KA might be primarily related to entry of Na+ rather than Ca2+. To investigate this hypothesis, cells were exposed to 10 μm veratridine, an inhibitor of voltage-dependent Na+ channel desensitization, to induce an independent means of Na+ entry into the cells. Addition of veratridine to cells incubated in the presence of nifedipine plus antagonists for both NMDA and non-NMDA receptors induced a slight increase in cytoplasmic Ca2+ (Fig.3), most likely associated with the activation of non-L-type Ca2+ channels or reversal of the plasma membrane Na+/Ca2+exchanger. After ∼75 min, massive DCD occurred in the cell population. As in the case of KA, oligomycin was effective in protecting the cells against this veratridine-induced DCD (Fig.3B). These results demonstrate that Na+ entry was most likely responsible for the KA-induced DCD and that the protective effect of oligomycin was not dependent on the route of ion entry.

Veratridine induction of oligomycin-sensitive delayed Ca2+ deregulation. Cells were incubated in medium containing 2 μm MK-801 and 10 μmNBQX, in the absence (A) or in the presence (B) of 5 μg/ml oligomycin added 5 min before the addition of 10 μm veratridine. In parallel experiments, KA-induced DCD was apparent by 75 min, and no KA-induced Ca2+ deregulation was seen in oligomycin-treated cells after 105 min (data not shown). Data are representative of at least 20 somata from five independent experiments.
Mitochondrial membrane potential changes during KA- and veratridine-induced DCD
TMRM+ (Ehrenberg et al., 1988) and rhodamine-123 (Johnson et al., 1980) are lipophilic cationic fluorescent probes that distribute across both plasma and mitochondrial membranes in response to the respective membrane potentials. The much greater surface-to-volume ratio of the small, highly invaginated mitochondria compared with the whole cell results in a much faster equilibration of probe across the mitochondrial inner membrane compared with the plasma membrane (Nicholls and Ward, 2000; Ward et al., 2000). Above a critical loading concentration, the dyes undergo fluorescence quenching in the matrix, resulting in a biphasic whole-cell response to mitochondrial depolarization, namely, an increase in fluorescence as the probe is released from the quenched environment into the cytoplasm followed by a decrease in fluorescence as the excess dye exits from the cell to restore the Nernst equilibrium across the plasma membrane (for review, see Nicholls and Ward, 2000). Rhodamine-123 is less permeant than TMRM+ (Bunting, 1992). Accordingly the cytoplasm retains rhodamine-123 released from depolarizing mitochondria for longer periods (Nicholls and Ward, 2000). In the subsequent experiments, cells were equilibrated with fura-2 AM and either TMRM+ or rhodamine-123 to allow simultaneous monitoring of cytoplasmic free Ca2+ and Δψm.
To separate out effects of KA on Δψm and the plasma membrane potential Δψp, the in situ mitochondria were first depolarized by the combination of rotenone and oligomycin (Budd and Nicholls, 1996a) (Fig.4A). The slow mitochondrial depolarization produced by rotenone and oligomycin (Ward et al., 2000) results in an increase in whole-cell fluorescence as the probe is released from the quenched environment of the matrix to the cytoplasm. After the subsequent addition of KA, there is a slow but extensive loss of fluorescence consistent with the redistribution of TMRM+ out of the cell as a result of plasma membrane depolarization. The fura-2 signal detects the “spike” of free Ca2+ as the AMPA/KA receptors are activated and then partially desensitize. Note that the presence of oligomycin in this experiment protects the cells against DCD.

TMRM+ and rhodamine-123 fluorescence during KA and veratridine exposure. Cells were loaded with fura-2 and either 50 nm TMRM+(A–C) or 1.3 μm rhodamine-123 (D–F) in the presence of 2 μmMK-801. The veratridine experiment additionally contained 10 μm NBQX. Where indicated, 2 μm rotenone plus 5 μg/ml oligomycin, 100 μm KA, or 10 μm veratridine was added. Each pair oftraces is from a single cell soma representative of at least 20 cells, from four to six independent experiments. Dashed traces, fura-2; solid traces, TMRM+ or rhodamine-123 fluorescence. a.u., arbitrary units.
When this experiment is repeated in the absence of the mitochondrial inhibitors (Fig. 4B), an initial small increase in fluorescence is observed, similar to that identified previously as the slight mitochondrial depolarization accompanying acute addition of glutamate plus glycine and ascribed to an increased ATP demand on the mitochondrial proton circuit (Ward et al., 2000). The subsequent decrease in fluorescence differs from that seen in the presence of rotenone and oligomycin by being biphasic, with a second decrease associated with the onset of DCD. The interpretation of the TMRM+ trace in Figure 4Bis ambiguous, because the biphasic decrease could represent either a two-stage plasma membrane depolarization or a plasma membrane depolarization on which was superimposed a delayed collapse of mitochondrial potential that was too slow to produce a transient elevation of TMRM+ fluorescence in the cytoplasm (Ward et al., 2000).
To remove the ambiguity in the interpretation of the potentiometric probe, the KA exposure was repeated with cells equilibrated with the less permeant (Bunting, 1992) rhodamine-123 (Fig.4D–F). This probe allows a slow mitochondrial depolarization to be detected as an increase in whole-cell fluorescence as the probe is released from the quenched environment of the matrix and accumulates in the cytoplasm before its slow equilibration across the plasma membrane (Nicholls and Ward, 2000; Ward et al., 2000). If, in contrast, Figure 4B was reporting a continued plasma membrane depolarization, this would result in a further decrease in signal. Figure 4D–F shows the response of three typical cells to KA. The increase in whole-cell rhodamine-123 signal may be resolved into two phases; the first small response is synchronous with the recovery of the fura-2 trace from the spike after KA addition and is consistent with the partial mitochondrial depolarization seen after NMDA receptor activation (Ward et al., 2000). This is followed by a second phase of slowly developing mitochondrial depolarization. Importantly, in the majority of cells mitochondrial depolarization can be initiated well before the final increase in [Ca2+]c that is diagnostic of DCD can be detected (Fig. 4D,E).
The complex fluorescence signal produced in granule cells by the probes has been analyzed previously in detail by mathematical modeling (Ward et al., 2000). Figure 5, A andB, shows traces synthesized by the model for fast-responding (TMRM+-like) and slow-responding (rhodamine-123-like) probes. A good fit with the experimental traces is obtained if a step plasma membrane depolarization, because of AMPA/KA receptor activation, is combined with a biphasic mitochondrial depolarization. The first phase comprises a slight initial mitochondrial depolarization coincident with agonist addition and attributable to the increased ATP demand on the mitochondrion as a consequence of enhanced Ca2+ and/or Na+ transport during the spike of cytoplasmic Ca2+ elevation. The second phase is a slowly developing partial mitochondrial depolarization. The “best fit” for both probes is obtained with the model by inputting a depolarization to 100–110 mV over a period of 20–30 min (Fig.5A), although a more extensive depolarization cannot be excluded.

Mathematical simulation of changes in membrane potentials that reproduce the pattern of whole-cell fluorescence in the presence of KA. A, Synthetic membrane potential profile for a cell in which KA causes an immediate plasma membrane (Δψp) depolarization because of AMPA/KA receptor activation followed by an early, partial mitochondrial (Δψm) depolarization. B, Simulated traces for rhodamine-123 and TMRM+ in the depolarization protocol inA. Note the similarity between the TMRM+trace and the actual experiment in Figure 4B and between the rhodamine-123trace and the experimental traces in Figure 4D–F. C, Synthetic membrane potential profile for a cell in which oligomycin initiates a slow depolarization after KA and FCCP collapses Δψm.D, Simulated traces for rhodamine-123 and TMRM+ in the depolarization protocol inC. Note the similarity between the TMRM+trace and an actual experiment (see Fig. 6A) and between the rhodamine-123 trace and an experiment (see Fig.6B). Rh 123, Rhodamine-123.
Exposure of a TMRM+-equilibrated cell to veratridine (Fig. 4C) produces a Δψm response very similar to that seen with KA (Fig. 4B), including the initial dequenching attributable to enhanced ATP demand and the delayed secondary depolarization.
Oligomycin accelerates mitochondrial depolarization but protects cells against DCD
By inhibiting proton transport through the ATP synthase, oligomycin hyperpolarizes “healthy” mitochondria that were generating ATP but depolarizes compromised mitochondria whose suboptimal Δψm was being maintained by ATP synthase reversal and glycolytic ATP hydrolysis (Ward et al., 2000). This simple “null-point” assay can be used to assess the bioenergetic status of in situ mitochondria (Ward et al., 2000). When this test was applied to granule cells that had been exposed to KA for 20 min, sufficient for reequilibration of TMRM+ across the plasma membrane but before the induction of DCD in this cell preparation, 80–90% of cells showed a slow increase in TMRM+fluorescence in response to oligomycin (Fig.6A), consistent with a gradual mitochondrial depolarization (Ward et al., 2000). Oligomycin-induced depolarization is seen more clearly in the cells loaded with rhodamine-123 (Fig. 6B). The model can simulate this response to oligomycin with an increased rate of mitochondrial depolarization (Fig. 5C,D). This contrasts with the response to oligomycin after NMDA receptor activation (Fig.6C,D) in which fluorescence quenching, diagnostic of mitochondrial hyperpolarization, is seen in cells that have not yet initiated DCD (Ward et al., 2000). Cytoplasmic Ca2+ homeostasis in the presence of KA was retained after addition of oligomycin (Fig. 6A,B), consistent with the protection afforded by this inhibitor against DCD (Figs. 1, 2).

The use of oligomycin and FCCP to probe mitochondrial function in KA-exposed cells. Cells were loaded with fura-2 and equilibrated with 50 nm TMRM+(A, C, E) or 1.3 μm rhodamine-123 (B, D, F). The media for the KA experiments (A, B, E, F) contained additionally 2 μm MK-801, whereas C and Dcontained 10 μm NBQX. Where indicated, additions were made of 100 μm KA, 100 μm glutamate plus 10 μm glycine, 5 μg/ml oligomycin, and 2.5 μm FCCP. Note that oligomycin induced a slow depolarization of mitochondria in KA-exposed cells (A, B) but hyperpolarized mitochondria in NMDA-exposed cells (C, D) and that FCCP and oligomycin failed to release Ca2+ from mitochondria into the cytoplasm (E, F). Each pair of traces is from a single soma representative of at least 20 cells from four to six independent experiments.
The protonophore FCCP, added to KA-exposed cells 20 min after oligomycin, allows the effects of complete mitochondrial depolarization to be assessed. The mitochondria retain a significant Δψm until the protonophore is added, as shown by the spike and subsequent efflux of TMRM+ and rhodamine-123 (Fig.6A,B). Any Ca2+ that was sequestered within the mitochondrial matrix would be released by this treatment, creating a transient cytoplasmic fura-2 spike (Budd and Nicholls, 1996a; Ward et al., 2000). The absence of such a release in KA-exposed cells indicated that these mitochondria retain little Ca2+. Closely similar results were obtained with veratridine (data not shown). This lack of Ca2+ loading contrasts with the extensive loading seen with glutamate plus glycine exposure, which in these cells was sufficient to prevent the restoration of Ca2+ homeostasis after addition of protonophore (Fig. 6C,D). Note that this preparation of cells showed a partial Ca2+ deregulation in the presence of glutamate plus glycine after addition of oligomycin, probably as a consequence of ATP limitation (Budd and Nicholls, 1996a).
The spontaneous mitochondrial depolarization seen after exposure to KA (Fig. 4B,D–F) implies that the mitochondria will at some stage become thermodynamically incapable of generating ATP and will instead start to hydrolyze glycolytic ATP. Cerebellar granule cells maintained for 7 d in vitro have sufficient glycolytic capacity to maintain Ca2+homeostasis in the absence of net ATP synthesis, but not if ATP synthase reversal occurs (Budd and Nicholls, 1996a,b). The onset of DCD subsequent to the partial mitochondrial depolarization (Fig.4D–F) is consistent with such ATP depletion. By preventing ATP synthase reversal, oligomycin could thus prevent cytoplasmic ATP depletion and the consequent loss of cytoplasmic Ca2+ homeostasis.
The enhanced rate of mitochondrial depolarization after oligomycin (Fig. 6A,B) implies that mitochondrial function is already compromised by 20 min of KA exposure, and even before changes in membrane potential can be detected. In contrast, NMDA-exposed cells contain healthy ATP-synthesizing mitochondria, which hyperpolarize on addition of the inhibitor before DCD (Fig. 6C,D).
The implication is that glycolytic ATP is essential for the continued Ca2+ homeostasis of these KA-exposed cells. Cells maintained in glucose-free medium in the presence of 10 mml-lactate plus 2 mm2-deoxyglucose are entirely dependent on mitochondrial oxidative phosphorylation for ATP generation and would therefore be predicted to show cytoplasmic Ca2+ deregulation immediately after mitochondrial ATP synthase activity became compromised. Figure 7 shows that such failure occurs much sooner than in glucose-maintained cells and after a delay similar to that seen in cells supported by lactate or pyruvate in the absence of glycolytic substrate and the presence of oligomycin, i.e., lacking any obvious means of ATP generation. Again this contrasts with chronic NMDA receptor activation, in which mitochondria remain net generators of ATP until the onset of DCD, so that glucose- or lactate-maintained granule cells survive for comparable periods before DCD (Castilho et al., 1998).
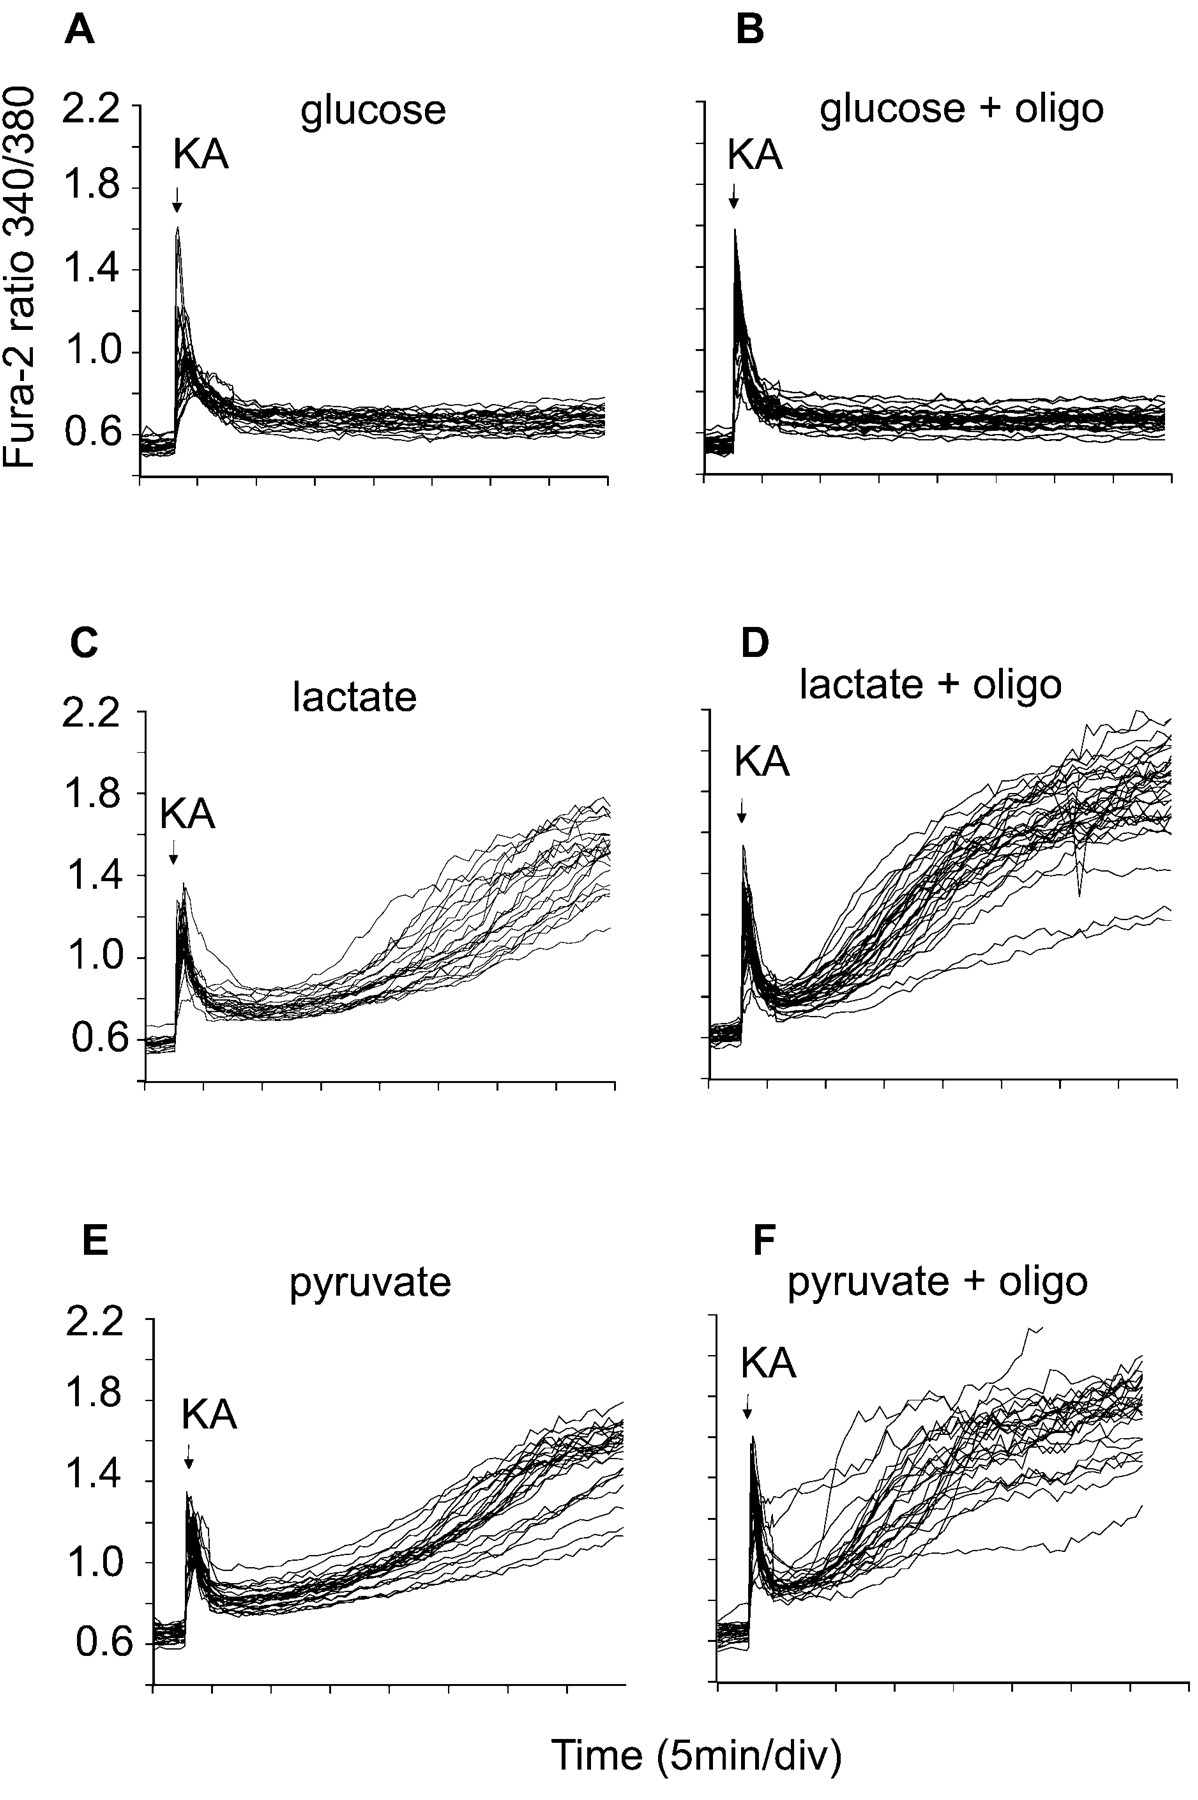
Cytoplasmic Ca2+ homeostasis in cells maintained by nonglycolytic substrates. The cells were loaded with fura-2 and incubated in the presence of 15 mm glucose (A, B) or in glucose-free medium containing 2 μm MK-801, 2 mm 2-deoxyglucose, and 10 mml-lactate or 10 mm pyruvate (C–F). KA (100 μm) was added where indicated. In tracesB, D, andF, 5 μg/ml oligomycin was present from the beginning of the experiment. Data are representative of at least 20 somata from four independent experiments.
DISCUSSION
Multiple mechanisms can account for cytoplasmic Ca2+ deregulation in neurons exposed to glutamate agonists, depending on the precise step whose activity becomes limiting. First, immediate Ca2+deregulation (ICD) is seen after NMDA receptor activation in granule cells in the presence of a respiratory chain inhibitor (Budd and Nicholls, 1996b; Castilho et al., 1998). ICD can be ascribed to an acute ATP deficit as glycolysis attempts to maintain housekeeping functions, extrude Na+ and Ca2+ entering through the receptor, and support Δψm by ATP synthase reversal as Ca2+ floods into the matrix. ICD is reversible by preventing mitochondrial depletion of ATP by oligomycin.
The second mechanism after 30–60 min of continuous NMDA receptor activation is characterized by a failure of Ca2+ extrusion from the cell that does not appear to be a consequence of ATP limitation and is partially protected against by antioxidants. This DCD cannot be reversed by NMDA receptor inhibition or addition of additional metabolic substrates. The only mechanism of Ca2+ extrusion from the cell in the presence of NMDA is the plasma membrane Ca2+-ATPase (PMCA), the Na+/Ca2+exchanger being thermodynamically incompetent because of the elevated cytoplasmic Na+. Because Ca2+ entry into the cell does not increase (Khodorov et al., 1996; Castilho et al., 1998), the conclusion is that the eventual failure of cytoplasmic Ca2+homeostasis is caused by an inhibition of extrusion caused by ROS generated by the Ca2+-loaded mitochondria.
The third mechanism becomes apparent during the DCD that follows 60–120 min after transient NMDA receptor activation. The precipitating event here is ATP depletion caused by mitochondrial depolarization, perhaps initiated by oxidative damage and the resulting ATP synthase reversal, because DCD is prevented by oligomycin (Ward et al., 2000). Presumably oxidative damage to the PMCA still occurs but does not become rate limiting because there is only a basal inward Ca2+ leak after receptor inhibition. KA-induced DCD has similarities with this third mechanism but can be initiated by pathological Na+ entry into the cell through AMPA/KA receptors or veratridine-opened Na+ channels.
Mitochondrial control of [Ca2+]cin KA-exposed granule cells
Mitochondrial Ca2+ loading is central to the mechanism by which NMDA receptor activation induces DCD (Budd and Nicholls, 1996b; Castilho et al., 1998, 1999). In contrast, the present study shows that exposure of 7–8 d in vitro cells to 100 μm KA does not cause significant mitochondrial Ca2+ loading, because there is no FCCP-releasable [Ca2+]c spike (Fig. 6), and KA-induced DCD is not facilitated by elevating external Ca2+ (Fig. 2). Thus [Ca2+]c can be maintained below the threshold “set point” at which mitochondria become net accumulators of Ca2+ (Nicholls, 1978; Zoccarato and Nicholls, 1982). This is suggested also by the lower fura-2 responses to KA relative to those to NMDA (Figs. 1, 6). However, Peng and Greenamyre (1998) observed a KA-induced increase in free-matrix Ca2+ monitored by rhod-2 in striatal neurons, whereas KA caused mitochondrial Ca2+ loading of rat forebrain neurons (Hoyt et al., 1998). The relative importance of Ca2+ and Na+entry in KA-induced excitotoxicity may thus vary from cell to cell. Certainly a chronically elevated [Ca2+]c that leads to bulk mitochondrial Ca2+ accumulation would be expected to be excitotoxic; however the present study and others (Kiedrowski et al., 1994a,b; Kiedrowski, 1998) focus on the role of Na+, and it is particularly striking that veratridine, which induces a continuous Na+ influx that depolarizes cells, collapses the Na+-electrochemical gradient across the plasma membrane, releases cytoplasmic and vesicular glutamate (McMahon et al., 1990), causes extensive swelling (Churchwell et al., 1996), and initiates an energy-dissipating cycle between the Na+ channel and the Na+/K+-ATPase (Nicholls and Scott, 1980), is able to mimic the acute excitotoxicity of KA so precisely.
NMDA receptor-mediated DCD in granule cells is unaffected by oligomycin (Budd and Nicholls, 1996b) and thus cannot be ascribed simply to a failure of mitochondrial ATP synthesis. In contrast, both KA- and veratridine-induced DCD are virtually abolished by oligomycin within the time course of the experiment (Figs. 1E,3B).These results confirm that Na+ entry is central to KA toxicity (Kiedrowski, 1998) and demonstrate that ATP synthase inhibition protects cells against the subsequent effects of the ion.
KA and Δψm
Interpretation of changes in whole-cell fluorescence of neurons loaded with cationic probes is complex, particularly if Δψp and Δψm both change (Nicholls and Ward, 2000). Three phases can be resolved (Fig.5). The first is an immediate slight depolarization of the mitochondria as they transiently accumulate Ca2+ and/or respond to an increased cellular ATP demand after receptor activation. Modeling this change mathematically (Ward et al., 2000) suggests that this may only amount to 5 mV.
The second phase, a slow decrease in signal, occurs even if Δψm is initially collapsed by rotenone and oligomycin (Fig. 4A) and is caused by plasma membrane depolarization. The third phase monitors the delayed change in Δψm associated with DCD. With continuous NMDA receptor activation the mitochondria remain sufficiently polarized to generate ATP (Ward et al., 2000) until the onset of DCD (see also Fig.6). In contrast, transient NMDA receptor activation terminated by MK-801 results in a delayed decay of Δψm that precedes DCD, particularly if oligomycin is present to prevent cytoplasmic ATP depletion (Ward et al., 2000).
Mitochondrial depolarization is most clearly visualized with rhodamine-123, because the increase in whole-cell fluorescence is dependent on a temporary accumulation of “excess” probe in the cytoplasm before reequilibration across the plasma membrane (Fig.4D–F). KA-induced depolarization can most closely be modeled by a slowly developing drop in Δψm of ∼40 mV (Fig, 5A,B), because a rapid depolarization would produce a spike detectable with either probe (e.g., Fig. 6E,F). The presence of a residual mitochondrial membrane potential after KA-induced DCD is indicated by a small dequenching seen on addition of FCCP at the termination of the experiment (data not shown).
The experiments shown in Figure 4D–F allow the relationships between cytoplasmic free Ca2+ and Δψm to be addressed. A slow increase in [Ca2+]c, monitored by the fura-2 340/380 nm ratio, can be detected in cells before the final precipitate increase associated with DCD (Figs.1D, 4B,D,E). Because this slow increase accompanies mitochondrial depolarization (Fig.4D,E) the most likely explanation is that ATP generation is becoming limiting in these cells as a consequence of impaired oxidative phosphorylation. However DCD itself occurs after the mitochondrial depolarization is well advanced (Fig.4D–F). The high-Ca2+ uniporter activity of brain mitochondria (Nicholls and Scott, 1980) means that they will be automatically depolarized by elevated Ca2+, and this may be the explanation for the mitochondrial depolarization that occurs synchronously with DCD during continuous NMDA receptor activation (Ward et al., 2000). However, the temporal relationship between DCD and Δψm seen here in the presence of KA means that the agonist induces mitochondrial depolarization by a mechanism other than a cytoplasmic Ca2+increase.
KA causes a rapid failure of mitochondrial ATP synthesis
Cells in the absence of glucose can use exogenous pyruvate or lactate to generate ATP by oxidative phosphorylation. Under these conditions, a failure of mitochondrial ATP synthesis cannot be compensated for by glycolysis, and a rapid loss of cytoplasmic Ca2+ homeostasis occurs. Pyruvate- or lactate-maintained granule cells exposed to glutamate plus glycine undergo DCD after the same delay as cells maintained on glucose, confirming that mitochondria continue generating ATP under these conditions until a late stage (Castilho et al., 1998). In contrast, KA-exposed cells start to lose cytoplasmic Ca2+ homeostasis after only 10 min (Fig.7C,E). Indeed the traces closely resemble those in which oligomycin is additionally present, inhibiting all ATP synthesis (Fig.7D,F).
In the absence of Ca2+ loading and in the presence of oligomycin there are a limited number of ways in which a decay in Δψm can occur. Either the mitochondria become increasingly proton permeable, or electron transport and/or substrate supply become limiting. The rhodamine-123 traces (Fig. 4D–F) and the incompetence of nonglycolytic substrates (Fig. 7C,E) both indicate that mitochondrial function is being compromised early on in KA excitotoxicity. A further test is to determine whether the addition of oligomycin after KA results in hyperpolarization (indicating that the mitochondria were generating ATP) or depolarization (indicating that Δψm was in part maintained by ATP synthase reversal and hydrolysis of glycolytic ATP). It is apparent from Figures5 and 6 that the mitochondria within the large majority of KA-exposed cells start slowly to depolarize after oligomycin. The slow rate and incomplete extent of this depolarization indicate that the mitochondrial inner membrane is still primarily proton impermeable; i.e., no “permeability transition” (Zoratti and Szabo, 1995) has occurred. Indeed, subsequent FCCP addition is required to show the dequenching spike and decay characteristic of a rapid collapse of Δψm. On the other hand we are aware of no studies in the literature that show respiratory inhibition in the presence of KA. Indeed, chronic in vivo KA accelerates the respiration of subsequently isolated hippocampal slices (Desagher et al., 1999; Kunz et al., 1999; Martinou et al., 1999). Further studies will be required to determine the mechanism underlying the mitochondrial depolarization.
Footnotes
This research was supported by Wellcome Trust Grant 054633/Z/98 and by Grant FMRX-CT98-0236 from the Biomed program of the European Union. M.W.W. was supported by a Medical Research Council studentship.
Correspondence should be addressed to Dr. David Nicholls, Buck Institute for Age Research, 8001 Redwood Boulevard, Novato, CA 94945-1400. E-mail: dnicholls{at}buckinstitute.org.
Dr. Rego's present address: Laboratory of Biochemistry, Faculty of Medicine and Center for Neurosciences of Coimbra, University of Coimbra, 3004-504, Coimbra, Portugal.
Dr. Ward's present address: Department of Pharmacology and Neuroscience, University of Dundee, Dundee, DD1 9SY United Kingdom.


