

Abstract
Sensory signals must be interpreted in the context of goals and tasks. To detect a target in an image, the brain compares input signals and goals to elicit the correct behavior. We examined how target detection modulates visual recognition signals by recording intracranial field potential responses from 776 electrodes in 10 epileptic human subjects. We observed reliable differences in the physiological responses to stimuli when a cued target was present versus absent. Goal-related modulation was particularly strong in the inferior temporal and fusiform gyri, two areas important for object recognition. Target modulation started after 250 ms post stimulus, considerably after the onset of visual recognition signals. While broadband signals exhibited increased or decreased power, gamma frequency power showed predominantly increases during target presence. These observations support models where task goals interact with sensory inputs via top-down signals that influence the highest echelons of visual processing after the onset of selective responses.
- attentional modulation
- cognitive neuroscience
- extrastriate cortex
- human neurophysiology
- target detection
- visual recognition
Introduction
The transformation of visual information into behaviorally relevant motor output relies on task-dependent modulation and interactions between goals and incoming sensory input. Consider the task of detecting the presence of a car before crossing a street: visual information needs to be compared with the sought target (car) before making a decision.
Significant progress has been made toward characterizing the processes that lead to visual recognition and the signals that orchestrate motor output. Less is known about the circuits that implement the task-dependent transformations between sensory signals and motor output. Convergent evidence from lesion studies (Dean, 1976; Humphreys and Riddoch, 1993), neurophysiological recordings (Gross et al., 1972; Tanaka, 1996; McCarthy et al., 1999; Liu et al., 2009) and neuroimaging studies (Tsao et al., 2003; Grill-Spector and Malach, 2004) point to the important role of inferior temporal cortex (ITC) in visual recognition. The rapid responses in ITC have been described using largely bottom-up and task-independent signals throughout the ventral visual stream (Wallis and Rolls, 1997; Riesenhuber and Poggio, 2000; VanRullen and Thorpe, 2002). Task-dependent influences on visual responses have been demonstrated in the context of attention (Desimone and Duncan, 1995; Kastner and Ungerleider, 2000; Reynolds and Chelazzi, 2004), categorization (Thorpe et al., 1996; Sigala and Logothetis, 2002; Molholm et al., 2004; Meyers et al., 2008; Peelen et al., 2009), and visual search (Chelazzi et al., 1998; Leonards et al., 2000; Shulman et al., 2003; Egner et al., 2008). Several computational models have introduced top-down signals capable of implementing task modulatory effects, particularly in the context of attentional modulation (Olshausen et al., 1993; Rao et al., 2002; Lee and Mumford, 2003; Deco and Rolls, 2004).
How rapid visual signals are processed in a task-dependent manner for explicit recognition and action remains unclear. Visual signals during the first ∼150 ms after image onset could be directly used to interpret the image (Thorpe et al., 1996; Keysers et al., 2001; Hung et al., 2005) and guide task-specific responses (Potter and Levy, 1969; Fabre-Thorpe et al., 1998; Kirchner and Thorpe, 2006) even without attention (Li et al., 2002). Yet, other studies have noted that scalp electroencephalographic signals after 150 ms are better indicators of behavior and explicit recognition (Johnson and Olshausen, 2003), and that task demands are instantiated by delayed interactions between frontal cortex and visual areas (Soltani and Knight, 2000; Miller and Cohen, 2001; Polich, 2007).
To investigate how task requirements modulate visual responses, we recorded intracranial field potentials from epileptic subjects while they performed a target detection task indicating whether a cued category was present or absent. Target presence exerted a strong modulation on the physiological responses, particularly in areas important for object recognition within ITC. Target modulation was observed in broadband and gamma frequency band signals, and was robust to different visual inputs and target identities even on single trials. The onset of target modulation was significantly later than the onset of visually selective signals. These results provide spatial and dynamical constraints to understand how bottom-up sensory signals interact with top-down goals during visual recognition.
Materials and Methods
Subjects
Subjects were 10 patients (7 females, 8 right-handed, 10.3–46.5 years old) with pharmacologically intractable epilepsy. The subjects were admitted to Children's Hospital Boston or Brigham and Women's Hospital to localize their seizure foci for potential surgical resection. All the experiments described here were approved by the Institutional Review Boards at each hospital and were performed with each subject's informed consent. The properties of the visual responses during the first 300 ms after stimulus onset for 9 of these 10 subjects were discussed in previous work (Agam et al., 2010).
Intracranial field potential recordings
The recording procedures were as described previously (Liu et al., 2009; Agam et al., 2010). Briefly, subjects were implanted with intracranial electrodes (Ad-Tech; 2.3 mm diameter, 1 cm separation between electrode centers, impedance < 1 kOhm) to localize the seizure foci. The total number of recording sites per subject ranged from 64 to 104 (77.6 ± 11.9, mean ± SD). The signal from each electrode was amplified (×2500) and sampled at 256 Hz or 500 Hz (XLTEK; Bio-Logic). A notch filter was applied at 60 Hz, along with a bandpass filter from 0.1 to 100 Hz. Throughout the text we refer to the recorded signal as “intracranial field potential” (IFP). Electrode localization was performed by aligning each subject's magnetic resonance imaging (MRI) into Talairach space, coregistering CT and MR images, and assigning each electrode to one of 75 different regions in FreeSurfer software based on the 2009 atlas (Destrieux et al., 2010). To avoid potential artifacts, trials where the amplitude of the IFP response (max(IFP) − min(IFP)) was greater than 4× the SD over the entire experiment were treated as outliers. Excluding these trials did not change the identity of the target-modulated electrodes.
We obtained reliable eye-tracking information for two subjects using a noninvasive system (ISCAN DTL-300) that provided a spatial resolution of ∼1 degree of visual angle and had a temporal sampling frequency of 60 Hz. The eye-tracking data for one of these two subjects are shown in Figure 10. Even though the subjects were not previously trained to fixate and could move their heads freely within our clinical setting, they maintained fixation within a 2° window in the majority of trials, particularly during the initial 400 ms.
Stimulus presentation and task
A scheme of the task is shown in Figure 1A. A target category (Face, Car, Chair, Animal, or House) was displayed on the screen at the beginning of each block of 50 trials. In each trial, subjects were presented with a 100 ms image flash containing one or two objects (Agam et al., 2010) and subjects performed a target detection task indicating whether the target category was present or not. The order of objects presented in each trial was randomized with the target present probability being ∼1/3. There were 1134.8 ± 430.3 (mean ± SD) trials per subject, with 358.8 ± 139.9 target present trials, and 776.0 ± 291.5 target absent trials. The first three subjects had 1.0 s to press a button to indicate the presence of a target, but did not press a button in target absent trials (go/no-go). The remaining seven subjects used the index and middle fingers of their dominant hand to indicate the presence or absence of the target in a two-alternative forced choice manner by pressing, respectively, the left or right buttons on a computer mouse. There was a 500 ms intertrial interval for these seven subjects. In the text, we describe 78 electrodes in non-motor areas that showed response modulation depending on whether the target was present or not. Target modulation was observed in both versions of the task. Thirty-two of these electrodes were in the first three subjects (out of 240 electrodes, 13%) and 46 electrodes were in the remaining seven subjects (out of 504 electrodes, 9%). The results suggest a higher degree of target modulation in the first three subjects. Yet, it should be noted that comparisons across subjects are difficult because the electrode locations vary from one to another subject.
The total number of blocks ranged from 5 to 35 and depended on clinical constraints and subject fatigue (Fig. 1B). The mean behavioral performance was 92 ± 7% and was significantly above chance for all 10 subjects (Fig. 1B). Because of the high behavioral performance in this relatively simple task, all analyses were restricted to correct trials. There was no pressure to respond rapidly. No feedback was provided. Trials with reaction time >200 ms were used for all analyses. The mean reaction time was 775 ± 299 ms (Fig. 1C).
Data analyses
All data were analyzed off-line using MATLAB (MathWorks).
Target modulation.
Unless otherwise indicated, we aligned the responses to visual stimulus onset and we focused on the window from 0 to 600 ms. An electrode was considered to be target modulated if it satisfied the following two conditions: (1) The IFP response for target present trials was significantly different from the IFP response for target absent trials (two-tailed t test, p < 0.01) for at least 70 consecutive milliseconds. The difference had to be in the same direction during those 70 ms (e.g., response in target present trials larger than response in target absent trials). The 70 ms parameter was estimated from shuffled data to achieve a false discovery rate (FDR) of <1%. The FDR was computed as the minimum number of consecutive milliseconds required to yield <1% of the electrodes as target modulated when the target present/target absent labels were shuffled. (2) Using just the above criteria includes electrodes with small amplitude fluctuations. To focus on the electrodes yielding the strongest responses, we estimated a minimum noise level of 28.8 μV computed as twice the average of the SEM of the IFP signal across all electrodes for all time points, separated by target present versus target absent and by stimulus category. We required a minimum peak difference in mean broadband IFP response between target present versus target absent trials of at least 28.8 μV. Removing this second condition would not change the conclusions but would increase the total number of target modulated electrodes.
For each electrode, we reanalyzed the data using a bipolar montage whereby the responses from the adjacent electrode were subtracted (Figs. 2C, 3B). Additionally, we separated trials based on the stimulus category (Figs. 2D, 3C), based on whether there was one or two objects on the screen (e.g., Figs. 2E, 3D) and based on whether the target was present in the top position or bottom position (Figs. 2F, 3E).
There were more target absent trials (on average, 776.0 ± 291.5) than target present trials (on average, 358.8 ± 139.9). We reanalyzed the data using the same two criteria above after equalizing the number of target present and target absent trials by randomly subsampling the number of target absent trials (n = 1000 iterations). The total number of target-modulated electrodes in non-motor areas was 73.6 ± 3.9, whereas in the main text we report 78 electrodes without equalizing the number of trials. Hence, the effect of target modulation cannot be ascribed to the different number of trials.
Frequency domain analyses.
Target modulation was also evaluated in different frequency bands of the IFP response. A 3-pole Butterworth filter was used for each of the following frequency bands: 0.1–100 (broadband), 0.1–4, 4–8, 8–12, 12–35, 35–50, and 70–100 Hz. For each trial, we report the envelope of the band-limited signal, computed as the absolute value of the analytic signal.
The plots in Figure 5 show the mean of the envelope of the gamma (70–100 Hz) band-limited signal for three example electrodes for target present versus target absent trials. Following the procedure above (see above, Target modulation), for the gamma band analyses, target modulation required a minimum peak difference of 0.62 μV (for noise-level control) between mean target present and target absent envelopes, and a minimum of 26 ms consecutive significant bins (for FDR < 0.01). Figure 6 shows the root-mean squared power of the bandpass filtered signals normalized by the maximum power for target present and target absent trials during the interval [200, 550] ms after stimulus onset. The corresponding minimum peak difference thresholds (for noise-level control) and number of consecutive bins computed (for FDR < 0.01) for the other frequency bands were the following: 0.10–4 (22.29 μV, 78 ms), 4–8 (9.36 μV, 38 ms), 8–12 (5.36 μV, 78 ms), 12–35 (5.33 μV, 30 ms), and 35–50 Hz (1.00 μV, 46 ms). The thresholds were distinct across frequency bands to ensure a constant FDR of 1% and the same signal-to-noise ratio given the power decay with increasing frequencies.
Latency analysis.
The latency of the target modulation effects in Figure 8 was defined as the first time point when the IFP power in the corresponding frequency band was significantly different between target present and target absent trials for at least 70 consecutive ms for the broadband signals, and for at least 26 consecutive ms for the gamma band signals. The parameters 70 ms versus 26 ms are different because the FDR analysis is applied separately for the broadband and gamma band signals as noted above (see above, Frequency domain analyses).
Single trial decoding analysis.
A decoding analysis was performed to evaluate the degree of target modulation in single trials and the time course of target information across different regions. Note that the “Target modulation” analyses described previously were independent from the analysis described here. The decoding analysis was not restricted to the target-modulated electrodes defined above. Each iteration of the decoding analysis consisted of two steps (n = 1000 iterations). In Step 1, the top 20 electrodes (best-case approach, Fig. 9,A,B), or a random subset of 20 electrodes (average-case approach; Fig. 9C,D) for each region were selected among all electrodes across all subjects using only training data. We only considered regions with at least 20 electrodes across subjects for this analysis. The average-case approach was included to reduce the effect of bias in the best-case approach due to unequal sampling of electrodes in different regions, i.e., a greater number of electrodes makes it more likely that we sample from the extremum of the distribution of individual electrode decoding performance. In Step 2, the subset of electrodes (referred to as pseudo-population) chosen in Step 1 was used to evaluate the time course of decoding performance. All the decoding analyses are based on pseudo-populations across subjects. We adopted the above steps to use the same number of electrodes (n = 20) when comparing different regions (and hence the same number of dimensions for the classifiers). One subject had only 66 target present trials and was excluded from the decoding analyses.
Step 1: For each trial and each electrode from each region across subjects, we extracted the broadband waveform (or the envelope of the band-limited signal for gamma band decoding) between −50 and t ms (in steps of 25 ms, beginning with t = 0 ms) after image presentation. Half of the data was used for this step (subsampled to the minimum number of trials across 9 subjects = 50% of 402). We followed a cross-validation procedure in which the classifier was trained on 70% of the data and the decoding performance results were evaluated using the remaining 30% of the data as test data (i.e., 70% of half of the dataset and 30% of half of the dataset). Data were randomly assigned to the training set or the test set. There was no overlap between the training data and the test data to avoid overfitting. We used a binary linear discriminant analysis classifier where chance performance was 0.5 (we randomly subsampled to ensure that the proportion of target present and target absent trials was the same). All electrodes within a region were ranked in descending order based on their decoding performance. The top 20 electrodes were chosen to evaluate decoding performance in Step 2 for the best-case approach (Fig. 9A,B). For the average-case approach (Fig. 9C,D), a random subset of 20 electrodes was chosen for each cross-validation iteration.
Step 2: We considered the remaining 50% of the data for this step. A classifier was built using the 20 electrodes across subjects found in Step 1, using a cross-validation procedure similar to the one described in Step 1. The decoding performance for each region was reported as the mean and 3× SEM of the decoding performance at the end of Step 2, across 1000 iterations.
To determine whether the decoding performance values were significantly different from chance levels, we performed the same procedure described above after having randomly shuffled the labels (target present/target absent) for Step 2. We computed the distribution of mean decoding performance values after shuffling using 100 shuffle iterations for each of the 10 regions that had at least 20 electrodes across nine patients. Then, we pooled together these 1000 mean decoding performance values (100 shuffle iterations × 10 regions) to create the shuffle distribution. If the empirical probability of observing a mean decoding performance was >0.5 + 3* (max (shuffle distribution) − 0.5) by at least 3× the SE of the observed values, then the region was determined to have significant decoding performance, for each [−50,t] ms classifier (p < 0.001). The mean and SD of the decoding performance values with the shuffled labels were 0.500 and 0.0037 (1000 × 25 bins = 25,000 shuffle iterations), respectively. The latency of target information for each region was defined as the first time point when the decoding curve became significant.
Results
We recorded IFP responses from 776 electrodes implanted in 10 subjects. Subjects viewed a display consisting of one or two grayscale objects presented for 100 ms, and had to report whether a previously cued target category was present or not (Fig. 1A; see Materials and Methods). The presentation order was pseudorandomized. All subjects performed above chance levels (Fig. 1B; percentage correct: 92 ± 7% (mean ± SD), range 74.5–99.7%). The average reaction time was 775 ± 299 ms after stimulus onset (range 529 ms to 1021 ms; Fig. 1C).

Experiment description and behavioral performance. A, Each block of 50 trials started with a screen indicating one of five target categories (Animal, Car, Chair, Face, or House). Each trial consisted of image presentation for 100 ms followed by subject response. The image contained one or two objects presented above and/or below the fixation spot (see top left inset). There were 25 possible objects, 5 per category. In 1/3 of the trials the target category for that block was present. Subjects had 1000 ms (subjects 1–3) or unlimited time (subjects 4–10) to respond. The response was either a button press only when target was present (subjects 1–3), or two distinct buttons for target present versus target absent (subjects 4–10). Trial order within a block and target categories across blocks were randomized. B, Behavioral performance (percentage correct) for each subject for target present (black) versus target absent (gray) trials. Error bars indicate 1 SD. The black dashed line indicates the mean percentage correct across all subjects (mean ± SD = 92 ± 7%). Numbers on top report the number of blocks for each subject. If subjects randomly reported target present or target absent with equal probability, performance would be 50% (middle dashed line). If subjects randomly reported target present with 1/3 probability and target absent with 2/3 probability then the percentage correct would be 67% in target absent trials and 33% in target present trials (top and bottom dotted lines, respectively). C, Mean reaction time for each subject (for all trials where the reaction time was <2.0 s and >0.2 s; see Materials and Methods) for target present (black) versus target absent (gray) trials. Error bars indicate 1 SD. The dashed line plots the mean RT across all subjects (mean ± SD = 775 ± 299 ms). Subjects 1–3 did not press a button for target absent trials.
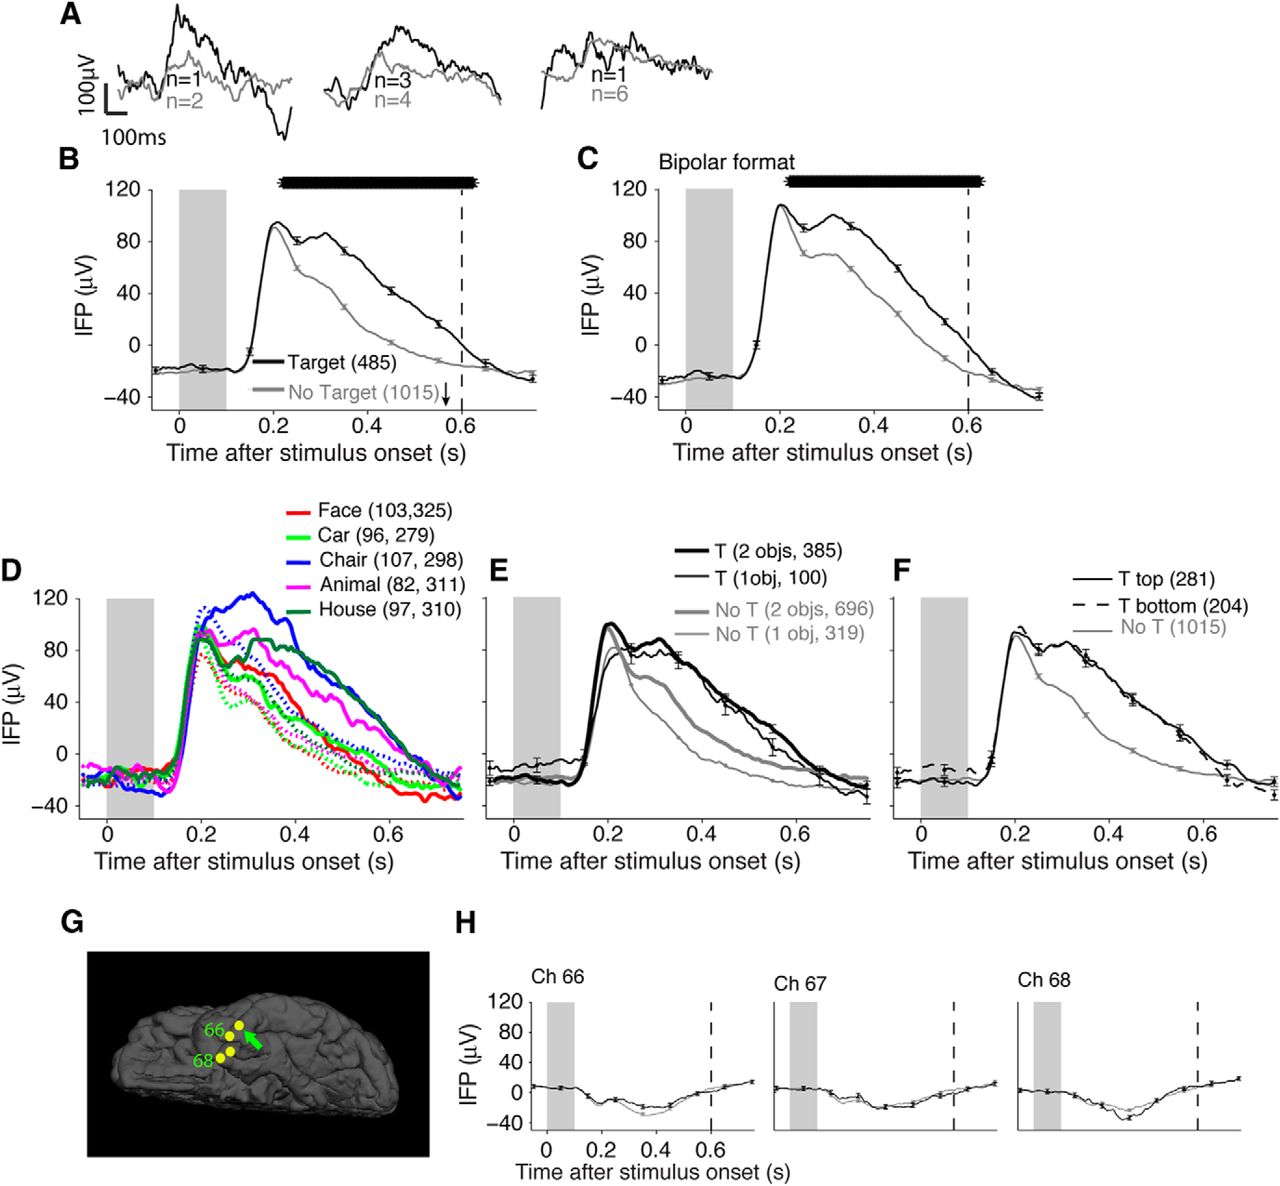
We evaluated the physiological responses elicited by each image and asked whether those responses were modulated depending on whether the image contained a target object or not. The responses of an example electrode located in the left inferior temporal gyrus are shown in Figure 2. As described previously (Agam et al., 2010), there was a large change in the IFP signal triggered by the visual stimulus (Fig. 2A,B). After this visually evoked response, starting at 212 ms poststimulus onset the IFP was larger in target present trials than in target absent trials (Fig. 2B). The mean IFP amplitude in the 0–600 ms window was significantly larger in target present trials (p < 10−14, two-sided t test). The modulation by target presence was also evident in a bipolar montage where activity in the adjacent electrode was subtracted (Fig. 2C). This modulation was statistically significant for four of the five different object categories presented during the experiment (Fig. 2D) suggesting that the differences between target present and target absent trials were largely independent of the identity of the cued target category (modulation was also evident for “Cars” (green) but the peak difference was 26.9 μV, which was slightly below the significance threshold 28.8 μV; see Materials and Methods). The responses during target present trials were larger both in images containing one object and images containing two objects (Fig. 2E) irrespectively of whether the target was in the top or bottom position (Fig. 2F). To evaluate the degree of specificity of the physiological responses with respect to electrode location, we compared the responses during target present and target absent trials in nearby electrodes in the same strip as the example electrode (Fig. 2G). Nearby electrodes did not show the same visually evoked response or target presence modulation (Fig. 2H). The lack of responses in nearby electrodes argues against an explanation of the results based on volume conduction of IFP signals over distances >1–2 cm. In another example electrode, located in the fusiform gyrus (Fig. 3), the mean IFP amplitude during target present trials was significantly more negative than during target absent trials (p < 10−14, two-sided t test). A significant difference between target present versus target absent trials was observed for all five categories (Fig. 3C), in trials containing one or two objects (Fig. 3D), in trials where the target was in the top or bottom position (Fig. 3E), and there was no modulation by target presence in nearby electrodes (Fig. 3F,G).

Example electrode showing differential responses between target present and target absent trials. A, Example IFP responses from an electrode located in the inferior temporal gyrus (Talairach coordinates = [−46.2,−3.8,−39.1], see G) to three individual images containing object pairs eliciting strong, moderate, or weak modulation (black, target present; gray, target absent). B, Average responses from the same electrode in the presence (black, n = 485 trials) or absence (gray, n = 1015 trials) of the target. The curves show the mean IFP response averaged across all images, aligned to image onset, for correct trials only. Error bars indicate ± 1 SEM (shown only every 100 ms for clarity). The gray rectangle indicates the stimulus presentation time. The arrow indicates the mean RT. The vertical dashed line indicates the upper limit for the main analyses throughout the manuscript (600 ms). The thick, horizontal black bar indicates time points with a significantly different IFP between target present and target absent trials (two-sided t test, p < 0.01). C, The same responses are shown in a bipolar montage (subtracting the responses in the adjacent electrode). D, The same responses are plotted separately for each of the five categories depending on whether each category was the target (solid) or the target was absent (dashed) during the trial. Each color shows a separate stimulus category. The numbers indicate the numbers of target present and target absent trials for each curve. Note that for the target absent trials (dashed lines), the target category during the block could be any of the four other categories. Error bars are omitted in this plot for clarity; the trial-to-trial variability can be assessed from B and did not depend on the object category (Agam et al., 2010). E, Responses separated based on whether the image contained one object (thin lines) or two objects (thick lines). F, Responses separated based on whether the target was in the top (solid) or bottom (dashed) position. The target absent trace is the same as that in B and is reproduced here for comparison purposes. G, Electrode location (arrow) and location of three other electrodes on the same strip. H, Responses from the other three electrodes on the same strip (format as in B).

Second example electrode. Responses from a second example electrode located in the left fusiform gyrus (Talairach coordinates = [−29.8,−43.1 −17.3]). The format and conventions are as in Figure 2. A, Average responses from the same electrode in the presence (black, n = 303 trials) or absence (gray, n = 697 trials) of the target. B, The same responses are shown in a bipolar montage. C, The same responses are plotted separately for each of the five categories. D, Responses separated based on whether the image contained one object (thin lines) or two objects (thick lines). E, Responses separated based on whether the target was in the top (solid line) or bottom (dashed line) position. F, Electrode location (arrow) and location of seven other electrodes on the same strip. G, Responses from the other seven electrodes on the same strip (format as in A).
We evaluated the degree of modulation by the presence of the target in all the electrodes (Fig. 4). The responses of an electrode were defined to be target modulated if there was a statistically significant difference between target present and target absent trials between 0 and 600 ms after stimulus onset with an FDR of 1% (p < 0.01 for >70 consecutive ms, two-tailed t test, and peak difference ≥ 28.8 μV; see Materials and Methods). Of the 776 electrodes, 744 (95.9%) were assigned reliable location information; 32/776 (4.1%) electrodes were not assigned a location because they were far from a cortical surface (for example, depth electrodes in white matter). Ninety-four of these 744 electrodes (12.6%) showed target modulation. Of these 94 target-modulated electrodes, 78 were located in non-motor areas and 16 were located in motor areas (see Materials and Methods; Table 1). Response modulation by target presence was observed in 61/78 electrodes when considering a bipolar montage, as illustrated in Figures 2C and 3B. All 78 electrodes showed response modulation when the target was present in trials containing one and two objects, as illustrated in the examples in Figures 2E and 3D. All 78 electrodes showed response modulation regardless of whether the target was in the top or bottom position, as illustrated in the examples in Figures 2F and 3E. Across all electrodes, target modulation was observed for 3.3 ± 1.4 (mean ± SD) out of the five categories (this analysis had less power than the one pooling across all trials because there were approximately one-fifth of the trials). As illustrated for the examples in Figures 2, G and H, and 3, F and G, all 78 electrodes had nearby electrodes, which did not show target modulation (mean ± SD of distance to nearest non-modulated electrode = 1.33 ± 0.97 cm). In summary, the presence of an object belonging to the target category modulated the broadband physiological responses in a spatially restricted manner, in images containing one or two objects, in trials where the target was above or below the fixation point, and this modulation generalized across object categories.

Responses of all target-modulated electrodes. Mean (±SEM) IFP responses, normalized by dividing by the maximum voltage, for target present (black) versus target absent (gray) trials for all the non-motor electrodes that showed target modulation in correct trials. The baseline IFP response (mean IFP between −50 and 0 ms before stimulus onset) was subtracted from each electrode's mean IFP response. Negative voltage responses (e.g., Fig. 3B) were reflected with respect to the y-axis before normalization to avoid directly averaging responses such as those in Figures 2 and 3. A, Electrodes above the diagonal in Figure 6A (n = 56, where power in target present trials > power in target absent trials). B, Electrodes below the diagonal in Figure 6A (n = 22, where power in target present trials < power in target absent trials). The number of trials varied across subjects (range of target present trials: 243–547; range of target absent trials: 555–1203).
Location of electrodes that showed modulation in target present versus target absent trials based on broadband IFP response and gamma band response (see Materials and Methods for definitions and electrode localization, see Table 2 for analyses in different frequency bands)
Target modulation was not restricted to the broadband responses, but was also observed in multiple frequency bands (Figs. 5, 6, Tables 1, 2). In particular, several studies have suggested that there is a correlation between neuronal spiking activity and responses in the gamma frequency band recorded from different types of electrodes (Nir et al., 2007; Rasch et al., 2008; Whittingstall and Logothetis, 2009; Ray and Maunsell, 2011). We therefore examined the responses in the gamma frequency band (70–100 Hz) following the same approach used with the broadband signals. The example electrodes in Figure 5 show response modulation between target present and target absent trials in the gamma frequency band signals. In all, 76 of 744 electrodes (10.2%) had significantly different responses between target present and target absent trials. Of these 76 electrodes, 70 were located in non-motor regions. When comparing target presence versus target absence for each stimulus category, target modulation in the gamma frequency band was observed for 2.8 ± 1.0 (mean ± SD) out of the five categories. This number was significantly lower than the one reported above for the broadband responses (3.3 ± 1.4, p = 2.1 × 10⁻⁴, two-sided t test). All 76 electrodes had nearby electrodes that did not show target modulation (mean ± SD of distance to nearest non-modulated electrode = 1.14 ± 0.66 cm; there were no significant differences in these distances when compared with the broadband responses, p = 0.37, Wilcoxon rank-sum test).

Example electrodes showing differential responses between target present and target absent trials in the gamma frequency band. Three example electrodes located in the inferior temporal gyrus (A, Talairach coordinates = [−57.4 8.5 10.9]), inferior occipital gyrus (B, [−49, −84.5, −1.4]), and fusiform gyrus (C, [−48.6, 32.6, −9.2]) showing responses in the gamma frequency band during target present (black) and target absent (gray) trials. The format and conventions follow those in Figure 2B except that here the y-axis represents the envelope of the IFP signal in the 70–100 Hz frequency band (see Materials and Methods). The mean reaction time (arrow) in A and C was after 800 ms.

Comparison of responses for target present versus target absent trials in seven frequency bands. Normalized root-mean squared power (average response from 200 to 550 ms after stimulus onset, normalized by the maximum value) for broadband signals (A) and six different frequency bands (B–G) in target present trials (y-axis) versus target absent trials (x-axis). Each circle denotes a separate electrode that showed target modulation. Error bars indicate 1 SEM. The diagonal line represents equal response for target present and target absent trials. A two-sided sign test determined significant asymmetry in the distribution of the points across the diagonal for the 4–8, 8–12, 35–50, and 70–100 Hz bands. The points marked with “x” represent the mean normalized power when target present and target absent trial identities were shuffled for each electrode (20 iterations); they provide an estimate of the deviations from the diagonal that can be expected by chance. The example electrodes from Figures 2, 3, and 5 are marked by arrows in A and G.
Number of electrodes that showed modulation in target present versus target absent trials in five frequency bands (see Materials and Methods)
Modulation by target presence was also observed in all other frequency bands between 0.1 and 100 Hz (Fig. 6). Yet, there were several differences in target modulation among different frequency bands. First, there were more electrodes that showed target modulation in broadband signals (94) and in the high gamma signals (76) compared with the intermediate frequency bands (Fig. 6, Table 2; 0.1–4 Hz: 45, 4–8 Hz: 63, 8–12 Hz: 48, 12–35 Hz: 48, 35–50 Hz: 58; note that only electrodes outside motor areas are shown in Fig. 6). Second, in the broadband signals (Fig. 6A) as well as in the low-frequency bands (Fig. 6B), different electrodes showed either an increase or a decrease in the response amplitude (electrodes above or below the diagonal). In contrast, most of the electrodes (76%) were above the diagonal when considering the 70–100 Hz frequency band (two-sided sign test, p = 1.9 × 10⁻⁵, Fig. 6G).
The locations with the highest fractions of target-modulated electrodes in the broadband signals were the fusiform gyrus, supramarginal gyrus, parahippocampal gyrus, inferior temporal gyrus, and middle frontal gyrus (Table 1, Fig. 7). The locations with the highest fractions of target-modulated electrodes in the gamma frequency band were inferior occipital gyrus, fusiform gyrus, superior parietal gyrus, middle frontal gyrus, and supramarginal gyrus (Table 1, Fig. 7). Although the overall fraction of electrodes that showed target modulation was similar in the broadband and gamma band signals, these two sets of electrodes showed only partial overlap: of the 76 electrodes that showed target modulation in the gamma band, 27 (35.5%) overlapped with the 94 electrodes that showed target modulation in the broadband signals. This degree of overlap is significantly above the one expected by chance (permutation test, p < 10−6) but suggests that broadband signals capture different aspects of the physiological responses compared with gamma band signals as suggested in other studies (Whittingstall and Logothetis, 2009; Privman et al., 2011; Buzsáki et al., 2012; see Discussion). Increases in the number of electrodes showing target modulation in the gamma band compared with the broadband signals were seen in the superior parietal gyrus (5 electrodes, 27.8% vs 0 electrodes) and inferior occipital gyrus (8 electrodes, 44.4% vs 2 electrodes, 11.1%). There was a decrease in the fraction of selective electrodes in the inferior temporal gyrus in the gamma band (10 electrodes, 9.9% vs 18 electrodes, 17.8%). As observed for the gamma band signals, there was a small but significant overlap in the identity of the electrodes that showed target modulation in different frequency bands compared with those in the broadband signals (Table 2). As expected given the 1/f nature of the IFP power spectrum, the 0.1–4 Hz frequency band showed the largest overlap with the broadband signals.

Electrode locations. Lateral view showing the location of sampled electrodes (black), electrodes in regions that showed modulation by target presence in both broadband and gamma band signals (yellow), electrodes in regions that showed modulation by target presence predominantly in broadband signals (blue), and electrodes in regions that showed modulation by target presence predominantly in gamma band signals (red). Only regions with >5 electrodes showing target modulation are shown in this figure (Table 1). All electrodes were mapped onto one subject's brain (subject 10) and reflected onto the left hemisphere for this illustration.
The onset of the target modulation effects typically occurred well after the onset of visually evoked responses as illustrated in Figures 2⇑⇑–5. To quantify the dynamics of target-modulation effects, we defined the target-modulation latency for each electrode as the first time point when target presence or absence could be inferred from the physiological signals (see Materials and Methods). The mean target-modulation latency was 377.0 ± 11.6 ms for the broadband responses (mean ± SEM; Fig. 8A) and 383.7 ± 13.8 ms for the gamma band (Fig. 8B). Although there was variation in the target-modulation latencies across different regions (Fig. 8C,D), these differences were not statistically significant (broadband: p = 0.17, gamma band: p = 0.18, one-way ANOVA, df = 5), perhaps due to the small number of target-modulated electrodes in each region. Modulation by target presence occurred well after the visually triggered responses that we and others have characterized in these same regions (Thorpe et al., 1996; Liu et al., 2009) and well before the behavioral responses (Figs. 1C⇑–3, 5).

Differentiation between target present and target absent responses started after 250 ms poststimulus onset. For each electrode that showed a differential response between target present and target absent trials, we defined the target modulation latency as the first time point when a two-tailed t test between target present and target absent trials yielded p < 0.01 for at least 70 consecutive ms (FDR < 0.01; see Materials and Methods). The plots show the distribution of latencies using the broadband power (A, n = 78 electrodes) or the gamma power (B, n = 70 electrodes). The inverted triangles indicate the mean. The arrowheads indicate the examples from Figures 2, 3, and 5. Bin size = 50 ms. C, D, Mean (±SEM) target modulation latency in each region that had at least five target-modulated electrodes for the broadband responses (C), or the gamma frequency band responses (D). The numbers of target-modulated electrodes for each region are indicated on top of each bar.
We asked whether we could discriminate the presence or absence of the target in single trials from the IFP responses. An illustration of the differences between target presence and absence averaged over very few trials and even in single trials is shown in Figure 2A where we observed target modulation but also variability across stimuli. We used a best-case and an average-case decoding analysis to quantify whether we could discriminate target presence or absence in single trials (see Materials and Methods). These single-trial decoding analyses were independent of the ones in Figures 2⇑⇑⇑⇑⇑–8. We considered each region with at least 20 sampled electrodes and built a classifier that was trained to discriminate target presence versus absence from the pseudo-population response. The performance of the classifier was evaluated on cross-validated data; a performance of 50% indicates chance levels and a performance of 100% would indicate perfect discrimination. The performance of the classifiers for each region using broadband activity from the 20 channels with the best individual decoding performance is shown in Figure 9A. The inferior temporal gyrus exhibited the earliest significant decoding performance (at ∼275 ms) and strongest performance (77.4% mean decoding performance at 600 ms), followed by fusiform gyrus (∼350 ms, 69.7%) and supramarginal gyrus (400 ms, 71.3%). Significant single-trial decoding performance was also observed using the physiological response in the gamma frequency band (Fig. 9B). In the gamma band, the fusiform gyrus exhibited the earliest and strongest decoding performance (∼350 ms, 69.8%), followed by inferior temporal gyrus (∼400 ms, 63.2%) and parahippocampal gyrus (∼425 ms, 60.8%). We also performed decoding using a random input selection approach to reduce the bias due to unequal total numbers of sampled electrodes in different areas (Fig. 9C,D). While overall performance was lower in the average approach compared with the best-case approach, the top three regions were similar across the two approaches (cf. Fig. 9A vs C, B vs D).

Single-trial discrimination between target present and target absent trials. Decoding performance using the best 20 electrodes (A, B) or 20 random electrodes (C, D) in each of 10 regions with at least 20 sampled electrodes across nine subjects (see Materials and Methods). A linear discriminant analysis classifier was used to decode whether the target was present or absent in any given trial. At each time point t on the x-axis, the broadband (A, C), or gamma band (B, D) signals in the interval [−50,t] ms were used for classification. The classification performance reported on the y-axis is obtained from cross-validated test data. Error bars indicate ± 3 SEM. The 20 best electrodes were selected using only training data. The gray shaded region indicates chance levels between 0.5 − 3* (0.5 − min (shuffle distribution)) and 0.5 + 3* (max (shuffle distribution) − 0.5) as determined by a shuffling procedure (1000 iterations; see Materials and Methods).
To minimize potential effects of eye movements, the stimuli and distances were relatively small (Fig. 1A), target presence and target position were randomized across trials, and image presentation times were quite short (100 ms). Eye movements elicited by the target's presence would have to occur while viewing a blank screen. We were able to obtain reliable eye-tracking data during the physiological recordings for two subjects (data for one of these subjects is shown in Fig. 10). For these two subjects, we considered the X- and Y- eye coordinates at 7 time points from 0 to 600 ms after stimulus onset (Fig. 10). We separately compared the X and Y eye positions in target present and target absent trials. None of the comparisons yielded statistically significant differences (Wilcoxon rank-sum test, p > 0.05) for any of the time points and subjects.

Eye position was similar in target present and target absent trials. Eye position as a function of time from stimulus onset for subject 10. Each small circle denotes the eye positions (horizontal in x-axis and vertical in y-axis) during each trial in 100 ms intervals from the time of stimulus onset (first column) to 600 ms after stimulus onset (seventh column). The top four rows represent target present trials. The top two rows represent trials where only one object was presented (dark gray squares represent target location) above (row 1) or below (row 2) the fixation point. Rows 3 and 4 represent trials where two objects were presented (dark and light gray squares) with the target above (row 3) or below (row 4) the fixation point. Rows 5–7 represent target absent trials. Rows 5–6 represent trials where only one nontarget object was presented (light gray square) above (fifth row) or below (sixth row) the fixation point. Row 7 represents trials where two nontarget objects were presented (two light gray squares). The large circle represents a fixation window with a radius of 2 degrees (not present on the screen). Each subplot shows the percentage of trials where the subject fixated within that window (top number) and the percentage of trials where the subject's eye position was outside the [−8:8] degree square region plotted here (bottom number). Fixations and any subsequent eye movements were similar across target present and target absent trials.
Correct performance in the task involves motor preparation and execution to report the presence or absence of the target. Because subjects were using the same two fingers to indicate their responses throughout the task (in subjects 4–10), it is conceivable that the differences between target present and target absent trials could be related to motor preparation/execution rather than target detection per se. While we cannot completely rule out this interpretation, several observations cast doubt on a purely motor description of our findings. (1) We reported the responses from electrodes in non-motor regions that satisfied the criteria for target modulation (Fig. 4A,B). An interpretation based on finger-specific motor preparation/execution would be surprising given that some of the strongest modulatory effects were observed in visual areas (Table 1, Figs. 7, 8). (2) The spatial specificity of the results (Figs. 2G,H, 3F,G) suggests that the signals that we are studying are local (within 1–2 cm; Vidal et al., 2012). The absence of long-distance spreading argues against an interpretation of the findings based on finger-specific movement signals from motor cortex (or elsewhere) that are passively spread throughout large spans of cortex. (3) Whereas all the motor electrodes that showed target modulation were contralateral to the hand executing the movement, we observed many non-motor target-modulated electrodes in the ipsilateral hemisphere. Furthermore, one subject implanted with bilateral electrodes (subject #10) showed target modulation in three electrodes that were ipsilateral and six that were contralateral to the fingers executing the responses. (4) To further examine the possibility of a motor explanation, we evaluated whether the IFP responses were better aligned to the onset of the image or to the button press. We separately considered “short” reaction time (RT) trials (when responses occurred between 450 and 600 ms after stimulus onset) and “long” RT trials (responses between 600 and 750 ms) and aligned the responses to stimulus onset or motor output. Fifty-eight electrodes had similar responses to target presentation during short and long RT trials when responses were aligned to the visual onset. In contrast, only 6 of the remaining 20 target-modulated electrodes had similar responses during short and long RT trials when aligned to the button press. Thus, the responses were better aligned to visual onset rather than to the button press. Together, based on (1)–(4) we argue that the most parsimonious description of our findings ascribes the physiological differences reported here to the cognitive and decision processes related to target detection rather than the motor report.
Discussion
We examined IFP responses while subjects performed a target detection task. Target presence had a modulatory effect on the responses to flashes of visual stimuli (Figs. 2⇑⇑–5). Target-dependent modulation was observed for different numbers, position, and identity of visual stimuli (Figs. 2, 3), and in broadband (Figs. 2⇑–4) and band-limited (Figs. 5, 6) signals, starting at least 250 ms poststimulus onset (Figs. 8, 9). These initial steps to characterize the transformation of recognition signals into behavioral output provide spatiotemporal constraints to understand task-dependent modulation of visual responses during target detection.
The task examined here requires recognizing the stimuli, determining whether the target's presence and implementing a behavioral response. Visual information for recognition is available in ITC within 100–150 ms after stimulus onset in monkeys (Richmond et al., 1990; Rolls, 1991; Logothetis and Sheinberg, 1996; Hung et al., 2005) and humans (Allison et al., 1994; Liu et al., 2009; Agam et al., 2010). The modulatory signals occurred well after these visual recognition signals: different converging analyses indicate a latency of target modulation of 250 ms (Figs. 8, 9).
A potential interpretation of the target modulation effects could arise from differential patterns of eye movements between target present and target absent trials. However, target presence and position was randomized and image presentation times were short (100 ms); therefore, eye movements elicited by the target's presence would have to occur while viewing a blank screen. Furthermore, in two subjects with reliable eye-tracking data, we did not observe differences in eye movements between target present and target absent trials (Fig. 10). Although intracranial recordings are thought to be relatively immune to eye muscle movements, a recent study has elegantly demonstrated a significant intracranial saccadic spike potential (Kovach et al., 2011). This saccade-related potential spans tens of milliseconds, increases with large saccade magnitudes, depends on the saccade direction, is particularly (but not exclusively) apparent in the vicinity of the temporal pole, and is significantly reduced when examining data in a bipolar montage. In contrast, in our study target occurrence and position were randomized, target modulation typically lasted >100 ms (Fig. 2B), most of the target-modulated electrodes were outside the temporal pole (Table 1, Fig. 7), the distance between object centers was 3.8 degrees, and target modulation was observed regardless of the target position (Fig. 2F) and was present in a bipolar montage (Fig. 2C).
The responses described here resemble the modulatory effects described in macaque area V4 and ITC during search tasks (Chelazzi et al., 1993, 1998, 2001). Whether a neuron's preferred stimulus is a target or not exerts a strong modulation on the responses at 160–200 ms after search onset. These latencies are shorter than the ones reported here but a direct comparison is complicated by differences between species, areas, tasks, and electrodes. Restricting the comparisons to ones that may be easier to interpret, in macaque V4 and ITC there is a delay of ∼100 ms between visually selective evoked signals and target modulation (within the same monkey, area, electrode, stimuli, and task). Similarly, we observe a difference of 100–150 ms between visually selective evoked signals and target modulation in our data (within the same subject, area, electrode, stimuli, and task). The target modulation latencies reported here are earlier than those observed in scalp electroencephalographic recordings, but the latency differences are comparable in magnitude and reminiscent of the delays observed between sensory-evoked responses and task-related modulation in noninvasive measurements (Soltani and Knight, 2000; Polich, 2007).
These modulatory effects may arise as a consequence of top-down modulation from other areas such as prefrontal cortex (Miller and Cohen, 2001; Rigotti et al., 2010; Pagan et al., 2013). Our sampling of different locations is far from exhaustive. Therefore, our data do not necessarily point to the earliest origin of target-modulatory effects. We observe target modulation earlier (and stronger) in the fusiform gyrus and inferior temporal gyrus and later (and weaker) in inferior frontal gyrus (Figs. 8, 9). The dynamics of target modulation in different regions (Fig. 9) may suggest a hierarchy of process underlying target detection but further research is needed to elucidate how signals propagate and are transformed from one area to another to instantiate target detection.
In go/no-go tasks similar to the one we used in the first three subjects, scalp electroencephalographic recordings have revealed fast visual signals that correlate with the presence or absence of an animal in a natural scene or the presence of a face (Thorpe et al., 1996; Kirchner and Thorpe, 2006). Variations of these tasks involving two motor responses (similar to the task used in seven subjects here) suggest a dissociation between two distinct processes: a bottom-up early signal that discriminates image features (Thorpe et al., 1996; Li et al., 2002) and a later top-down signal that involves target detection (Johnson and Olshausen, 2003, 2005; Rousselet et al., 2007). This interpretation is consistent with putative bottom-up visually selective signals described previously (Allison et al., 1994; Liu et al., 2009; Agam et al., 2010) and the type of target modulation described here.
Target detection may require or engage attentional resources directed toward features belonging to the target category. The areas studied here are strongly modulated by spatial and feature-based attention (Desimone and Duncan, 1995; Kastner and Ungerleider, 2000; Reynolds and Chelazzi, 2004; Maunsell and Treue, 2006; Davidesco et al., 2013). Our task would not engage spatial attention before the onset of each trial (the target could be randomly present in one of two locations). Spatial attention could be directed to the target (and/or to the single object location) after image onset but the image disappeared after 100 ms, arguably before any attentional shifts dictated by the visual content. It seems likely that the task engages feature-based attention dictated by specific aspects of the sought category. Indeed, areas within frontal cortex and object-selective cortex show selective activation patterns predictive of behavioral performance, even before stimulus onset, in a search task where subjects had to detect target categories in objects embedded in natural scenes (Peelen and Kastner, 2011). Hence, the modulation of physiological responses by target presence reported here could be driven by feature-based attention.
Target-modulated responses were observed across the spectrum of frequency bands (Tables 1, 2). There were differences in the extent of target modulation among frequencies: (1) the overlap between broadband and band-limited signals was higher than chance but rather low (Tables 1, 2); (2) target presence led to power increase in the gamma frequency band (Figs. 5, 6); and (3) there were small but significant regional differences across frequencies (Figs. 6, 7, Tables 1, 2). A small overlap between broadband and gamma band signals has been observed in visual and motor studies (Ray et al., 2008; Vidal et al., 2010; Privman et al., 2011). Additionally, coherence measures from microwire recorded LFPs have revealed stronger attentional modulation in the gamma band than in broadband and low-frequency signals (Fries et al., 2001; Womelsdorf et al., 2007). The origin of local field potentials (LFPs; high-impedance microwires) or IFPs (low-impedance electrodes) is not clearly understood. Computational models typically describe field potential signals as weighted sums of temporally correlated excitatory and inhibitory postsynaptic potentials near the electrode (Mitzdorf, 1985; Nunez and Srinivasan, 2006; Ray et al., 2008; Miller et al., 2009; Anastassiou et al., 2011; Lindén et al., 2011; Buzsáki et al., 2012). Several investigators have shown a correlation between LFPs and spikes in broadband/low-frequency signals (Helmchen et al., 1999; Katzner et al., 2009; Manning et al., 2009; Rasch et al., 2009; Whittingstall and Logothetis, 2009; Xing et al., 2009; Bansal et al., 2011; Kajikawa and Schroeder, 2011) and/or in gamma band signals (Nir et al., 2007; Rasch et al., 2008; Katzner et al., 2009; Whittingstall and Logothetis, 2009; Kajikawa and Schroeder, 2011; Ray and Maunsell, 2011). Several (but not all) studies show that LFP signals in high-frequency bands have a stronger correlation with firing rates (Kreiman et al., 2006; Nir et al., 2007; Whittingstall and Logothetis, 2009; Ray and Maunsell, 2011), and may be more local (Logothetis, 2002; Maier et al., 2010; Buzsáki et al., 2012; but see Kajikawa and Schroeder, 2011), further documenting differences among distinct frequency components of LFPs. We speculate that the differences between broadband signals and other frequency bands may reveal distinct sources providing task-dependent signals: broadband signals might reflect combinations of input postsynaptic potentials from a larger number of neurons and gamma band signals might reflect local computations. However, further research is needed to explain the biophysical mechanisms that contribute to different frequency components of field potential signals.
We generally understand sensory signals (e.g., visual inputs) and motor signals (e.g., finger/eye movements) better than the task-dependent transformations between inputs and outputs. The high-level visual cortical areas examined here are ideally suited to match incoming inputs with internal representations according to goals and have strong connections to frontal and motor areas to influence behavioral outputs. The current observations highlight the notion that human inferior temporal cortex does not merely contain a passive transformation–tolerant representation of visual objects, but instead is actively modulated by task demands.
Footnotes
Funding was provided by the National Institutes of Health and the National Science Foundation. We thank the patients for their cooperation. We also thank Hesheng Liu and Calin Buia for data collection, Jed Singer for electrode localization and comments on this manuscript, Laura Groomes for electrode localization, and Sheryl Manganaro and Paul Dionne for technical assistance.
- Correspondence should be addressed to Gabriel Kreiman, Children's Hospital, Harvard Medical School, Boston, MA 02115. Gabriel.kreiman{at}tch.harvard.edu


