

Abstract
The primary function of the superior colliculus (SC) is to orient the visual system toward behaviorally relevant stimuli defined by features such as color. However, a longstanding view has held that visual activity in the SC arises exclusively from achromatic pathways. Recently, we reported evidence that the primate SC is highly sensitive to signals originating from chromatic pathways, but these signals are delayed relative to luminance signals (White et al., 2009). Here, we describe a functional consequence of this difference in visual arrival time on the processes leading to target selection and saccade initiation. Two rhesus monkeys performed a simple color-singleton selection task in which stimuli carried a chromatic component only (target and distractors were isoluminant with the background, but differed in chromaticity) or a combined chromatic–achromatic component (36% luminance contrast added equally to all stimuli). Although visual responses were delayed in the chromatic-only relative to the combined chromatic–achromatic condition, SC neurons discriminated the target from distractors at approximately the same time provided stimulus chromaticity was held constant. However, saccades were triggered sooner, and with more errors, with the chromatic–achromatic condition, suggesting that luminance signals associated with these stimuli increased the probability of triggering a saccade before the target color was adequately discriminated. These results suggest that separate mechanisms may independently influence the saccadic command in the SC, one linked to the arrival time of pertinent visual signals, and another linked to the output of the visual selection process.
Introduction
The primate superior colliculus (SC) has long been associated with the transformation of visual signals into saccadic eye movement commands (Sparks, 1986; Sparks and Hartwich-Young, 1989), but more recently it has been assigned an important role in visual target selection involving features such as color (McPeek and Keller, 2002, 2004; Shen and Paré, 2007; Kim and Basso, 2008). However, a longstanding view has held that visual activity in the SC arises exclusively from achromatic pathways (Schiller and Malpeli, 1977; Schiller et al., 1979). Recently, we reported evidence that the SC also receives a significant contribution from chromatic pathways (White et al., 2009). This was supported by two major findings: (1) The most prevalent color-related responses were found in the intermediate SC layers and not the superficial SC layers, which are known to receive different sets of visual projections (Fries, 1984; Lock et al., 2003). (2) Visual response latency was significantly delayed for isoluminant color stimuli relative to high contrast luminance-defined stimuli, even when the magnitude of the color-related response was greater. We interpreted this as evidence that these signals traverse different pathways before their arrival in the SC. Here, we describe an important functional consequence of this on the processes underlying target selection and saccade initiation in the SC.
During the selection of a color singleton (an odd-colored target among a homogeneous set of distractors), neurons in brain areas that are actively involved in target selection [e.g., lateral intraparietal area (LIP) (Ipata et al., 2006; Thomas and Paré, 2007), frontal eye field (FEF) (Schall and Thompson, 1999; Schall, 2001), and the SC (McPeek and Keller, 2002, 2004; Shen and Paré, 2007)] initially respond indiscriminately to a target or distractor; that is, the appearance of an array of visual stimuli generates an initial volley of visual activity that is typically not feature selective. Selection then evolves as distractor-related activity is suppressed while target-related activity is enhanced. However, studies investigating neural selection with color have typically used stimuli that are not equiluminant with the background, such that they carry both chromatic and achromatic components. Psychophysical studies suggest that the signals generated by these components retain a certain level of independence for detection and selection mechanisms (Mullen and Losada, 1994; Nagy, 1999).
If signals generated by the chromatic component arrive later than those generated by the achromatic component, how does the SC integrate these potentially asynchronous signals to generate the appropriate saccadic command? Presumably a saccade is triggered when some function of SC activity exceeds a certain threshold (Krauzlis et al., 2004). Consequently, earlier visual signals should be transformed into a motor command before later signals. Because oculomotor substrates including the SC receive visual projections from many visual areas (Fries, 1984; Lock et al., 2003) with different visual onset latencies (Schmolesky et al., 1998), signals arriving from short achromatic pathways (e.g., retinotectal path) (Cowey and Perry, 1980) may be uncoupled from the output of the visual selection process which should require cortical pathways selective for color. The results of the current study support this hypothesis.
Materials and Methods
Data were collected from two male rhesus monkeys (Macaca mulatta; monkey Q, 11 kg; monkey Y, 12 kg). The surgical procedures and extracellular recording techniques were described previously (Marino et al., 2008) and were approved by the Queen's University Animal Care Committee in accordance with the guidelines of the Canadian Council on Animal Care.
Stimuli and equipment.
Stimuli were presented on a cathode ray tube monitor at a screen resolution of 1024 × 768 pixels (75 Hz noninterlaced, eight-bit per channel intensity resolution), with a viewing angle of 54° horizontally and 44° vertically. Stimulus presentation was controlled by a UNIX-based real-time data acquisition system (Hays et al., 1982). The voltage-to-luminance relationship for each of the monitor's phosphors was linearized using the UDT Instruments S471 optometer with a model 265 photopic filter placed directly on the monitor surface. The spectral radiance of each of the monitor's phosphors was measured using the PR-655 (Photoresearch), and a correction was made for the Judd–Vos modified luminosity function (Judd, 1951; Vos, 1978). The Judd–Vos corrected Commission Internationale de l′ Eclairage (CIE) xyY values of the phosphors were r = (0.63, 0.34, 10), G = (0.29, 0.60, 31), B = (0.15, 0.07, 5.7). The new CIE xyY values were used to convert between red-green-blue and DKL (Derrington, Krauskopf, and Lennie) (Krauskopf et al., 1982; Derrington et al., 1984) color space using the Smith and Pokorny (1975) cone fundamentals.
Stimuli were circular disks (0.5 to 2° diameter moderately scaled for eccentricity) whose color properties were derived from the DKL color space (Krauskopf et al., 1982) (see Fig. 1A). This color space corresponds closely to the type of segregation that exists along the geniculostriate pathway in early vision (Derrington et al., 1984). One pathway sums the inputs of the long- and middle-wavelength cones (L + M), producing a luminance channel that is mostly sensitive to stimuli varying along the “black–white” dimension in the DKL space. A second pathway computes the difference between the inputs of the L and M cones (L − M) and is mostly sensitive to stimuli varying along the “red–green” dimension in the DKL space. A third pathway computes the difference between the inputs of the short-wavelength cones (S cones) with the sum of the L and M cones [S − (L + M)] and is mostly sensitive to stimuli varying along the “blue–yellow” dimension in the DKL space. These three channels form the primary visual-cortical inputs via the magnocellular, parvocellular, and koniocellular layers of the LGN, respectively.
Procedure.
Monkeys were seated in a primate chair (Crist Instrument) with their head restrained and facing the video monitor. Eye position was recorded using the magnetic search coil technique (Robinson, 1963). After an SC neuron was isolated, its visual response field was mapped using a rapid visual stimulation procedure described previously (White et al., 2009). Monkeys then performed a simple color-singleton selection task during a luminance versus color manipulation (see Fig. 1A–C). Each trial started with fixation of a central black fixation spot for 500–800 ms followed by its removal and the simultaneous onset of one of the color-singleton search arrays shown in Figure 1. All stimulus conditions were randomly interleaved on a trial-by-trial basis. Monkeys were required to look to the target for a juice reward.
Simultaneously, we recorded extracellular single-unit activity from neurons in the intermediate SC layers because these neurons respond to isoluminant color stimuli (White et al., 2009), project directly to the brainstem premotor circuitry (Rodgers et al., 2006), and are involved in visual target selection (McPeek and Keller, 2002). Stimuli were derived from a color space that allowed us to manipulate chromatic and achromatic information independently (Krauskopf et al., 1982; Derrington et al., 1984). Briefly, in a luminance-easy (Lum-easy) condition (see Fig. 1A), the target was easily discriminable from distractors, and stimuli carried both a task-relevant chromatic component (e.g., “pink” target among “yellow” distractors) and a task-irrelevant achromatic component (stimuli had −36% luminance contrast relative to a neutral gray background). In an isoluminant-easy (Iso-easy) condition (see Fig. 1B), everything was identical except the achromatic component was removed, making stimuli isoluminant with the background at 20.5 cd/m2 while holding target-distractor chromaticity constant. In an isoluminant-difficult (Iso-diff) condition (see Fig. 1C), stimuli were isoluminant with the background as in the Iso-easy condition, but distractor chromaticity was shifted closer to the target chromaticity. For the Lum-easy and Iso-easy conditions, the target color was chosen from 330° on the azimuth of the DKL color plane (“pink,” CIE x = 0.33, y = 0.25) and was easily discriminable from the distractor color at 45° on the azimuth of the DKL color plane (“yellow,” CIE x = 0.40, y = 0.39). For the Iso-diff condition, distractor chromaticity was shifted closer to the target chromaticity. It was moderately different for each animal (5 and 0° on the azimuth of the DKL color plane for monkeys Y and Q, respectively) and was fixed once we observed a significant increase in saccadic reaction time (SRT) while keeping saccadic direction error rates below chance level. Chromatic contrast for the target and distractors was fixed at 100% across conditions. The additional luminance contrast associated with the Lum-easy condition did not exceed the limits of the monitor gamut for the chosen stimulus colors. Stimulus conditions were randomly interleaved on a trial-by-trial basis. After several weeks of data collection, stimulus colors were swapped such that the target was “yellow” and distractors “pink.” Once monkeys learned the new configuration, data collection recommenced.
Analyses and neuron classification.
Spike waveforms were sampled at 40 kHz, and individual spikes, eye position data, and event data were sampled at 1 kHz, all of which were recorded in a multichannel data acquisition system (Plexon). Spikes were sorted off-line to remove artifacts and verify single units. Spike density functions were created by convolving individual spikes with a Gaussian kernel (σ = 5 ms).
A delayed saccade task was used to classify each neuron. Briefly, monkeys fixated a central fixation stimulus followed by the appearance of a bright stimulus (6.5 cd/m2 against a black background) in the response field of the neuron. The monkey was required to maintain fixation for an additional delay period of 500–800 ms, after which the fixation was removed signifying to the monkey to launch a saccade to the peripheral stimulus. Several types of neurons were sampled and classified under a scheme described previously (White et al., 2009). Briefly, neuron classification was based on whether they had a transient or sustained visual response during the delay period, and whether or not they had motor-related activity. A similar classification scheme has been used by others (McPeek and Keller, 2002; Li and Basso, 2008). Specifically, a neuron was defined as visual if its firing rate within 150 ms of target onset exceeded 3 SDs above a baseline (−70 to +30 ms relative to target stimulus onset) and remained so for ≥40ms. A neuron was defined as having a motor component if the average firing rate around the time of saccade onset (−25 to +25 ms) exceeded 3 SDs above a presaccadic epoch (defined as the average firing rate from −150 to −50 ms before saccade onset).
Only visuomotor neurons with a sustained response during the delay period were analyzed because (1) they were associated with visual target selection in the SC (McPeek and Keller, 2002), and (2) they project directly to the brainstem premotor circuitry (Rodgers et al., 2006). A total of N = 44 sustained-visuomotor neurons were sampled >44 independent sessions (monkey Q, N = 21; monkey Y, N = 23). Supplemental Fig. S1 (available at www.jneurosci.org as supplemental material) shows other sampled neuron types. Pure transient-visual neurons were typically difficult to isolate and were not sampled because they did not show target selection (McPeek and Keller, 2002) and they did not respond significantly to isoluminant color stimuli (White et al., 2009). The sample of sustained-visual neurons (N = 17) did show significant color-related responses, but these neurons poorly discriminated the target from distractors (supplemental Fig. S1A–C, available at www.jneurosci.org as supplemental material), and did so too late to play an important role in target selection. A small sample of transient-visuomotor neurons (N = 7) showed unreliable visual responses to isoluminant color stimuli (supplemental Fig. S1D–F, available at www.jneurosci.org as supplemental material), and were therefore excluded from the main manuscript. Motor-only neurons (N = 17) lacked visual activity altogether and were excluded for that reason (supplemental Fig. S1G–I, available at www.jneurosci.org as supplemental material).
A saccade was defined by a velocity criterion ≥35°/s. SRT was the time from target onset to saccade onset. Only the first saccade was analyzed, and a postsaccade reward was issued if the saccade endpoint fell within an invisible computer controlled window (usually 3 by 3° around the target) and remained there for ≥200 ms. A direction error was defined as a saccade whose endpoint was closer to either of the distractors than to the target. Direction errors were not rewarded. We aimed for a minimum of at least 20 correct trials per condition for a given saccade direction such that each spike density function consisted of 20 counts in most cases (median, 21; mode, 19.1). Only saccades with an SRT >60 and <500 were included, which resulted in <0.1% of trials removed across the entire 44 sessions.
Visual response onset latency (ROL) was the time from target onset to the point at which neural activity (derived from spike density functions) first exceeded 3 SDs above a baseline and remained so for ≥40 ms. Baseline firing rate was defined as the average activity from −70 to +30 ms relative to target stimulus onset. Visual response magnitude was defined as the average response over a short epoch from visual onset latency for 30 ms for a given neuron. Using an average proved to be more reliable than trying to determine peak visual responses because there was not always a clear initial visual burst.
Neural discrimination time (DT) was determined statistically. For each neuron, a rank sum test (Mann–Whitney U) compared the target- versus distractor-related spike count and was calculated at each millisecond in 10 ms bins starting from target onset (a sliding 10 ms window). DT was specifically defined as the earliest point in which the target-related response statistically exceeded the distractor-related response (p < 0.05) and remained so for at least 10 ms of the subsequent 15 ms. This method was previously used to determine precise discrimination times within neurons (Thomas and Paré, 2007), and we found it effective for statistically confirming differences observed early in the neuronal response. A subsequent analysis was calculated across the entire population of neurons using a t test to compare the average target- versus distractor-related firing rates (derived from spike density functions) at each millisecond (no bins; α = p < 0.001). This test was very robust and served to verify the discrimination results derived within neurons. The signal detection approach with ROC analysis yielded similar results with the criteria defined by Sato et al. (2001) and McPeek and Keller (2002).
For each behavioral (SRT, direction errors) and neural (ROL, DT, etc.) dependent variable, a repeated-measures ANOVA was performed to test for significant differences between stimulus conditions. For brevity, only post hoc t statistics for simple effects were reported in the main manuscript. F statistics for significant main effects were significant at p < 0.05 or better (Greenhouse–Geisser). Alpha levels for t tests were adjusted for multiple comparisons using the Bonferroni correction. A nonparametric test (Wilcoxon signed rank) was used to statistically compare the median slopes of the relationships between the ROL, DT, and SRT.
Results
Monkeys performed a color-singleton selection task with stimuli derived from a color space where chromatic and achromatic information were manipulated independently (Krauskopf et al., 1982; Derrington et al., 1984). Figure 1 illustrates the stimuli and predictions (for details, see Materials and Methods). In a Lum-easy condition (Fig. 1A), the target was easily discriminable from distractors, and stimuli carried both a chromatic and achromatic component. In an Iso-easy condition (Fig. 1B), everything was identical, except the achromatic component was removed, making stimuli isoluminant with the background while holding target-distractor chromaticity constant. In an Iso-diff condition (Fig. 1C), stimuli remained isoluminant with the background, but distractor chromaticity was shifted closer to the target chromaticity making discrimination more difficult. These stimuli allowed us to formulate specific predictions based on three critical temporal parameters (Fig. 1D–G): the visual ROL, neural DT, and SRT. Specifically, we measured the relative independence of each neural measure (ROL and DT) on the initiation of a saccadic response (SRT). First, we predicted that both the luminance manipulation (Lum-easy to Iso-easy) and the color manipulation (Iso-easy to Iso-diff) would produce a delay in SRT (Fig. 1D, E), but for different reasons. Based on our previous study (White et al., 2009), we predicted a positive relationship between ROL and SRT for the luminance manipulation (Fig. 1F, left), but not the color manipulation (Fig. 1G, left), because all stimuli were equiluminant in the latter. In contrast, we predicted a positive relationship between the DT and SRT for the color manipulation (Fig. 1G, right), because increasing target-distractor similarity should delay the DT by prolonging the integration time required for neurons to discriminate the target (Sato et al., 2001, 2003). However, the precise outcome of the luminance manipulation on the DT is unclear (Fig. 1D, arrow), but there are at least two predictions (Fig. 1F, right): (1) DT will be delayed with respect to the delay in ROL. (2) DT will not be delayed with respect to ROL, but may remain constant because chromaticity was held constant, and selection mechanisms may use chromatic signals independent of luminance to discriminate the target (Mullen and Losada, 1994; Nagy, 1999). If prediction 2 is correct, it would support the hypothesis that signals from separate visual pathways to the SC may independently influence the initiation of a saccadic response.

Stimuli and predictions. A–C, Schematic of stimulus conditions and color space used to derive stimuli (see Materials and Methods). Background color was chosen from the center of the isoluminant plane (neutral gray at 20.5 cd/m2). For the Luminance-easy condition (A), target and distractors had combined chromatic–achromatic component. For the Isoluminance-easy condition (B), the achromatic component was removed making items equiluminant with the background. For the Isoluminance-difficult condition (C), distractor chromaticity was shifted closer to target chromaticity. D, E, Hypothetical selection process illustrating predictions (gray arrows) for each stimulus manipulation. White arrow in D illustrates a critical unknown. F, G, Summary of predictions. Dotted lines in F (right) represent unknowns, with two labeled predictions, 1 and 2. T, Target; D, distractors; BG, background.
Figure 2 summarizes the behavioral results across 44 independent sessions. Figure 2A shows the cumulative SRT distributions for the Lum-easy condition (black), the Iso-easy condition (red), and the Iso-diff condition (blue). As predicted, average SRTs for correctly directed saccades (Fig. 2B) were significantly delayed in the Iso-easy condition relative to the Lum-easy condition (luminance manipulation, t(43) = 14.27; p < 0.00001), and for the Iso-diff condition relative to the Iso-easy condition (color manipulation, t(43) = 7.74; p < 0.00001). In addition, the proportion of saccade direction errors was significantly greater in the Lum-easy condition (t(43) = 5.59; p < 0.00001) and the Iso-diff condition (t(43) = 11.16; p < 0.00001) relative to the Iso-easy condition (Fig. 2C). The elevated error rate for the Iso-diff condition is in agreement with less efficient search (Sato et al., 2001), but the elevated error rate in the Lum-easy condition is not, because this condition was accompanied by shorter SRTs relative to the Iso-easy condition. Furthermore, this apparent speed–accuracy trade-off for the Lum-easy condition was not attributable to a change in the response criterion for triggering a saccade because the conditions were randomly interleaved on a trial-by-trial basis.

SRT and saccade errors across conditions. A, Cumulative SRT distributions for correctly directed saccades. B, Mean SRT. C, Mean proportion of saccade direction errors. The x symbols in C represent proportion of errors for each session. Error bars indicate ±1 SEM. *p < 0.00001; Bonferroni corrected.
We also observed subtle but important differences in the saccade metrics between conditions (Fig. 3A–C). There was slightly greater peak saccade velocity coupled with shorter saccade duration for the Lum-easy condition relative to the Iso-easy condition (velocity, t43 = 10.4, p < 0.001; duration, t43 = 5.7, p < 0.001) and the Iso-diff condition (velocity, t43 = 6.8; duration, p < 0.001; t43 = 5.9, p < 0.001). There were no significant differences in saccade amplitude across the three conditions (p > 0.3).

Saccade metrics across conditions. A, Mean peak saccade velocity. B, Mean saccade duration. C, Mean saccade amplitude. Error bars indicate ±1 SEM. *p < 0.001; Bonferroni corrected.
Figure 4 shows rasters and spike density functions for an example visuomotor SC neuron recorded in the three different conditions. For many of our neurons, we observed a distinct early visual volley followed by a later volley leading up to and including the motor response. The neuron in Figure 4 is a good example of this. For the luminance manipulation, the target-related response (Fig. 4A) showed a visible shift in ROL (55 vs 69 ms for the Lum-easy vs Iso-easy condition, respectively), but overall the response profiles looked the same. The target-related peak visual responses were 300 and 305 spikes per second for the Lum-easy and Iso-easy conditions, respectively. This shift in ROL coupled with equal response magnitude is consistent with the involvement of different pathways (White et al., 2009).

Response of a single visuomotor SC neuron across conditions aligned on target onset. A, B, Rasters and spike density functions when the target appeared in the response field of the neuron. C, D, Rasters and spike density functions when a distractor appeared in the response field of the neuron. Horizontal shaded regions under the x-axes indicate points where target-related response statistically exceeded distractor-related response; p < 0.05 (rank sum test) (see Materials and Methods). The response field (RF) is illustrated by the circle around the search item, with the arrow representing the correct saccade direction. T in, Target in response field; D in, distractor in response field.
For the distractor-related response (Fig. 4C), although there was an equally visible shift in ROL (51 vs 66 ms, respectively), the distractor-related peak visual response was attenuated in the Iso-easy condition (237 vs 310 spikes per second). After the initial visual response, distractor-related activity showed approximately the same level of suppression in both conditions. The average firing rate from 100 to 180 ms after target onset was 44 versus 41 spikes per second for the Lum-easy versus Iso-easy condition, respectively (p > 0.25 for target vs distractor spike count across the epoch; rank sum test).
In terms of neuronal discrimination, the horizontal shaded bars under the x-axis between the top and bottom panels in Figure 4 indicate the period where the target-related response was significantly greater than distractor-related response (p < 0.05; rank sum test) (see Materials and Methods). For the Lum-easy condition, there was a clear point where the neuron first began to statistically discriminate the target from distractors (85 ms). For the Iso-easy condition, there were two relatively discrete epochs where the neuron significantly discriminated the target from distractors, one associated with the initial visual response (beginning at 82 ms) and a later one leading up to and including the motor response (beginning at 114 ms). The timing of the latter is consistent with prediction 1 (Fig. 1F), in that DT shifted with the shift in ROL as a result of the luminance manipulation. However, this is only partly true. The earlier discrimination represents a crucial part of the visual processing that should play an important role in the visuomotor transformation because it implies a difference in the relative competition between target and distractors (Trappenberg et al., 2001; Dorris et al., 2007). This attenuated distractor-related gain in the Iso-easy condition should in fact act to reduce target-directed SRTs by reducing the competitive interaction on the SC map. In this case, the neuron first began to statistically discriminate the target from distractors at approximately the same time in the Lum-easy (85 ms) and Iso-easy (82 ms) conditions, which supports prediction 2 (Fig. 1F).
In contrast, for the color manipulation (Fig. 4, right), the ROL was approximately the same between conditions (69 vs 67 ms for the Iso-easy vs Iso-diff condition, respectively). However, although the target-related peak visual response was similar between conditions (305 vs 316 spikes per second, respectively), the distractor-related peak visual response was greater in the Iso-diff condition (267 vs 237 spikes per second). After the initial visual response, distractor-related activity was greater in the Iso-diff condition. The average firing rate from 100 to 180 ms after target onset was 91 versus 41 spikes per second for the Iso-diff versus Iso-easy condition, respectively (p < 0.00001 for target vs distractor spike count across the epoch; rank sum test). As a result, this neuron showed evidence of poorer target discrimination in the Iso-diff condition and did not reliably do so until a later period (108 ms).
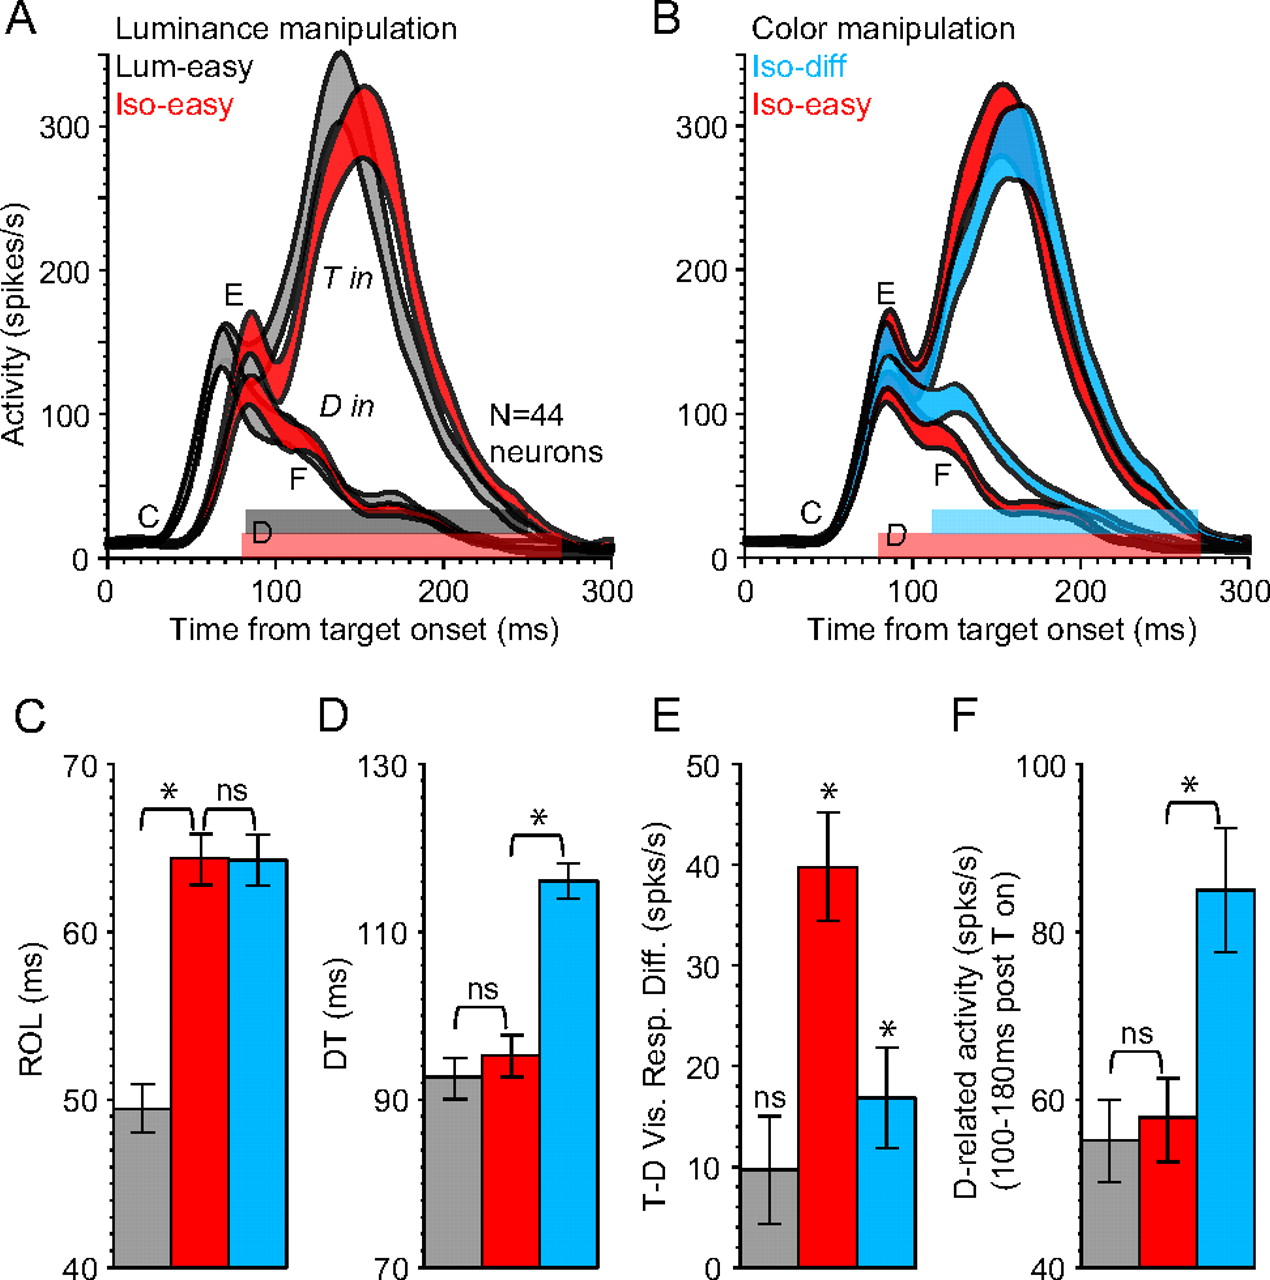
The single-neuron example was accurately reflected in the population (Fig. 5). Figure 5, A and B, compares the population-average response aligned on target onset across the 44 visuomotor SC neurons. For the main neuronal factors (ROL and DT), the results were not significantly different between monkeys in either stimulus configuration, and were therefore collapsed (p > 0.19 across all interactions; Greenhouse–Geisser) (individual results are presented in supplemental Figs. S2–S4, available at www.jneurosci.org as supplemental material).

A, B, Population-averaged spike density functions aligned on target onset (N = 44 visuomotor SC neurons; line width represents between-neuron SEM). Horizontal shaded regions above the x-axes show the period where target-related activity was statistically greater than distractor-related activity (p < 0.001). C–F, Summary of results associated with the labels denoting different aspects of neuronal response in A and B. C, Mean visual ROL. D, Mean DT. E, Mean target-minus-distractor visual response difference. F, Mean distractor-related activity from 100 to 180 ms after target onset (T on). *p < 0.01; Bonferroni corrected.
Figure 5C–F, summarizes the results associated with the labels denoting different aspects of neuronal response in A and B. On average, there was a robust delay in ROL (Fig. 5C) for the Iso-easy condition relative to the Lum-easy condition (t(43) = 14.6; p < 0.00001), but no difference in ROL between isoluminant conditions (p = 0.87). In contrast, there was no significant difference in the earliest reliable DTs derived within neurons (Fig. 5D) between the Lum-easy and Iso-easy conditions (t(43) = 1.56; p = 0.38), but there was a large difference in DT between the Iso-easy and Iso-diff condition (t(43) = 6.8; p < 0.00001). We obtained the same discrimination results from a between-neuron statistical comparison (see Materials and Methods). The horizontal shaded bars above the x-axes in Figure 5, A and B, represent the period where target-related activity was significantly greater than distractor-related activity (p < 0.001), verifying the DT results obtained within neurons. Furthermore, there was a significant difference early in the target- versus distractor-related visual response (Fig. 5E) for the Iso-easy condition (t(43) = 7.4; p < 0.00001), which was not statistically significant in the Lum-easy condition (p = 0.21), and which was much weaker in the Iso-diff condition (t(43) = 3.4; p < 0.01). After the initial visual volley, distractor-related activity showed the same level of suppression across the population between the Lum-easy and Iso-easy conditions (Fig. 5F). The average firing rate from 100 to 180 ms after target onset was not significantly different (t(43) = 1.3; p = 0.51). In contrast, distractor-related activity was on average significantly greater and remained elevated over a longer period in the Iso-diff relative to the Iso-easy condition (t(43) = 7.2; p < 0.00001).
Also, the two factors in Figure 5, E and F (target/distractor visual response magnitude and the postvisual distractor-related activity) were significantly negatively correlated with DT in the Iso-easy condition (r = −46, p = 0.002 and r = −28, p = 0.03, respectively), but not in the Lum-easy condition (r = −0.20, p = 0.1 and r = −0.08, p = 0.29, respectively). For the Iso-diff condition, there was also a moderately significant correlation between target/distractor visual response magnitude and DT (r = −0.25; p = 0.048), but not between postvisual distractor-related activity and DT (r = −0.09; p = 0.27). Thus, the early DTs observed in the Iso-easy condition were mostly driven by differences occurring early in the visual response.
There were also subtle differences between conditions in saccade-aligned responses (Fig. 6), which were consistent with the differences in saccade metrics described previously (Fig. 4). Specifically, there was a slightly greater peak saccade-related burst in the Lum-easy condition relative to the isoluminant conditions (Iso-easy, t(43) = 2.55, p < 0.05; Iso-diff, t(43) = 2.26, p < 0.05), but no difference between isoluminant conditions (p = 0.4). In addition, there was a subtle but significant difference in the rate of rise of target-related activity leading up to saccade initiation (i.e., the slope of the best-fitting line to the neuronal response from −40 ms to saccade onset). On average, the Iso-diff condition showed a shallower slope than both the Lum-easy condition (t(43) = 4.44; p < 0.0001) and the Iso-easy condition (t(43) = 2.40; p < 0.05), which is consistent with prolonged integration time required for the Iso-diff condition (Sato et al., 2001, 2003).

A, Population-averaged spike density functions aligned on saccade onset (N = 44 visuomotor SC neurons). B, Mean peak saccade-related burst. C, Mean slope of the best-fitting line to the neuronal response from −40 ms to saccade onset. Error bars represent the between-neuron SEM. *p < 0.05; Bonferroni corrected.
To test directly the predictions laid out in Figure 1, we compared ROL and DT obtained from each of the 44 neurons in each stimulus condition with the average SRT obtained from each of the 44 sessions. Figure 7 shows the results. Figure 7A–D plot the relationship between ROL, DT, and SRT, and E and F show histograms of the slopes, expressed in degrees of angle. For the luminance manipulation (Fig. 7A,C), there was a strong positive relationship between ROL and SRT that was not observed between DT and SRT. The median slope of the lines for the SRT/ROL relationship (43°) (Fig. 7A) was not statistically different from 45°, representing a perfect relationship (p = 0.44, Wilcoxon signed rank test for 45° median), but was highly different from 90° (p < 0.00001). The median slope of the lines for the SRT/DT relationship (75°) (Fig. 7C) was statistically different from 45° (p < 0.0001), but not statistically different 90° (p = 0.12); that is, ROL was a better predictor of the change in SRT than DT. In contrast, for the color manipulation (Fig. 7B,D), DT was a better predictor of SRT than ROL. Here, the median slope of the lines for the SRT/ROL relationship (88°) (Fig. 7B) was statistically different from 45° (p < 0.01), but not statistically different from 90° (p = 0.19). In contrast, the median slope of the lines for the SRT/DT relationship (21°) (Fig. 7D) was significantly less than 45° (p = 0.02), but it was also significantly greater than 0° (p < 0.00001), making DT a better predictor than ROL in this case. Also, DTs were never greater than SRTs for this sample of neurons (Fig. 7C,D, gray), which would otherwise indicate that the selection process could not contribute to behavior. Together, these results support prediction 2 (Fig. 1F); DT was not exclusively coupled with ROL.

Relationship between ROL, DT, and SRT. A, B, SRT/ROL relationship for the luminance (A) and color manipulation (B). C, D, SRT/DT relationship for the luminance (C) and color manipulation (D). Each point represents the mean for a given neuron/session in each stimulus condition (shaded regions in C and D denote regions where DT is greater than SRT). E, F, Histograms of the slopes (degrees), with gray denoting the slopes of the SRT/ROL relationship and white denoting the SRT/DT relationship. Arrows on the x-axes indicate the median slope for each histogram.
Discussion
Our results provide strong support for a dissociation between mechanisms associated with the initiation of a saccadic response in the SC: for the luminance manipulation, the change in SRT was associated with a equal change in ROL, relatively independent of DT, whereas for the color manipulation, the change in SRT was associated with a change in DT, independent of ROL. This suggests that different mechanisms may independently influence the initiation of a saccadic response; one linked to the arrival time of pertinent visual signals and another other linked to the output of the selection process.
Specifically, if the selection process in the SC was initiated at the moment signals first arrived, we would expect DT to be delayed with the corresponding delay in ROL generated by isoluminant stimuli. Instead, DT was remarkably similar between the Lum-easy and Iso-easy conditions, suggesting that selection mechanisms may use primarily chromatic signals to discriminate the color target (Mullen and Losada, 1994; Nagy, 1999). However, saccades were triggered earlier in the Lum-easy condition. This might suggest that discrimination was more efficient in the Lum-easy condition than the Iso-easy condition, but error rates suggest otherwise; there were significantly more saccade direction errors in the Lum-easy condition (Fig. 2C). This apparent speed–accuracy trade-off cannot be adequately explained by a change in the response criterion for triggering a saccade because all conditions were randomly interleaved within the same blocks, and the monkeys had no prior knowledge of which condition would appear on a given trial. Thus, the delay in SRT for the Iso-easy condition cannot be attributable to reduced search efficiency (Sato et al., 2001, 2003). A more parsimonious explanation is that the earlier accumulation of SC neuronal activity in the Lum-easy condition increased the probability of triggering a saccade before the target color was completely discriminated, thereby increasing error rate. This would be possible if the SC had relatively independent access to achromatic and chromatic signals (White et al., 2009).
Furthermore, the result of the luminance manipulation was very different from what one would expect from an explicit change in search efficiency (Sato et al., 2001, 2003). We included the color manipulation explicitly for this reason. Sato et al. (2001, 2003) showed that increasing target-distractor similarity reduced search efficiency by prolonging the integration time required for FEF neurons to discriminate the target. This was mostly because distractor-related activity was greater and more prolonged when distractors resembled the target. This was clearly different from the luminance manipulation, which had an even more profound impact on SRT (Fig. 2), but no significant difference in the rate of suppression of distractor-related activity was observed (Fig. 5F).
An important question that arises is, what is driving the results of the luminance manipulation, and what are the implications for the mechanisms underlying the sensorimotor transformation? Except for the robust shift in the ROL, the target-related response profile was virtually identical between the Lum-easy and Iso-easy conditions (Figs. 4, 5). The target-related visual response magnitude between these conditions was not different (p > 0.7), but the distractor-related visual response was significantly attenuated in the Iso-easy condition (∼40 spikes per second) (Fig. 5E), which was also correlated with DT. This was generally true whether the target was “pink” and distractors “yellow” or visa versa (supplemental Fig. S4E, available at www.jneurosci.org as supplemental material). Therefore, the discrimination process was mainly attributable to modulation of the distractor-related response. Crucially, attenuated distractor-related gain should act to reduce, not increase, target-directed SRTs by reducing the competitive interaction between target and distractors (Trappenberg et al., 2001; Dorris et al., 2007). Instead, SRTs were prolonged in the Iso-easy condition relative to the Lum-easy condition because they were most closely tied to signal arrival time.
Our results also illustrate that although neurons across the oculomotor network do not typically show preference for specific colors (Schall and Thompson, 1999; Schall, 2001; McPeek and Keller, 2002; Ipata et al., 2006; Thomas and Paré, 2007; White et al., 2009), when a color becomes behaviorally relevant, we began to observe a form of feature-selectivity that was particularly enhanced when achromatic signals were minimized (Iso-easy condition) (Figs. 4, 5). This early selectivity might reflect the sort of experience-dependent feature-selectivity described by Bichot et al. (1996). These authors showed that although FEF neurons do not typically exhibit feature selectivity, exclusive training with targets of one color produced dramatic feature-selective responses early within the initial volley of visual activity. Bichot et al. (1996) proposed that this early selectivity reflects a form of experience-dependent plasticity mediated by a reduction in synaptic efficacy of neurons representing the distractor color. Whether this might take place in visual oculomotor areas (e.g., FEF, LIP, SC) and/or visual cortex, where neurons show chromatic tuning properties (Gegenfurtner, 2003), is unknown. In the current study, stimulus conditions were randomly interleaved, so differences between conditions cannot be attributable to differences in experience, but effects within conditions may, because color configurations were blocked (see Materials and Methods). We observed robust feature-selective responses that were significantly enhanced when achromatic signals were minimized (Iso-easy condition) (Fig. 5E). This suggests that the experience-dependent plasticity proposed by Bichot et al. (1996) may be mediated by some pathways (chromatic) and less so by others (achromatic), possibly because chromatic pathways carry the relevant feature in this case. Consequently, we would expect it to be less pronounced when distractors resemble the target (Iso-diff condition) or when stimuli are contaminated by visual signals arising from achromatic mechanisms (Lum-easy condition).
We do not know exactly why chromatic signals are delayed in reaching the SC, but we may speculate. There are differences in visual latency as early as the magnocellular and parvocellular geniculostriate pathways (Schmolesky et al., 1998; Maunsell et al., 1999), and at least part of the difference in the ROL observed in the SC may be attributable to this. Anatomically, the SC is known to receive direct projections from many visual areas [e.g., retina (Cowey and Perry, 1980), V1 (Lia and Olavarria, 1996), V2 (Abel et al., 1997), middle temporal area (Ungerleider et al., 1984), and V4 (Lock et al., 2003)], with different visual onset latencies (Schmolesky et al., 1998). Visual signals may also reach the SC indirectly via other oculomotor areas that receive direct input from visual cortex such as FEF (Schall et al., 1995) and/or the LIP (Baizer et al., 1991). It is reasonable to presume that these projections do not carry identical visual signals to the SC. Indeed, there is evidence of different pathways carrying chromatic and achromatic signals to the SC because the retinotectal projection is achromatic (Schiller and Malpeli, 1977). Consistent with this, we found little color-related activity in the superficial SC layers, and the most prevalent color-related responses in the intermediate SC layers (White et al., 2009). The earliest visual corticotectal projections arise from the “interblobs” of V1 (Lia and Olavarria, 1996) and the “thick stripes” of V2 (Abel et al., 1997), both of which are not the regions typically associated with a high degree of color-selective neurons (Ts'o and Gilbert, 1988; Gegenfurtner, 2003). Thus, color-related responses in the SC might arise from pathways downstream of V2. Color-sensitive area V4 has direct projections to the SC (Fries, 1984; Lock et al., 2003), and FEF (Schall et al., 1995), and signals arriving directly or indirectly (via FEF) from this area likely reach the SC later than achromatic retinotectal signals. In sum, there may be several means through which signals arriving from achromatic pathways are uncoupled from the output of the selection process involving color.
There is also reason to suspect that our results would be observed elsewhere in the oculomotor network. Both the FEF and LIP are strongly associated with target selection (Schall and Thompson, 1999; Schall, 2001; Ipata et al., 2006; Thomas and Paré, 2007). Previous studies have demonstrated a significant degree of independence between visual selection and saccade initiation in the FEF (Thompson et al., 1997; Woodman et al., 2008; Murthy et al., 2009). These authors conclude that variability in SRT is correlated with postvisual/postperceptual processes in the FEF, except when visual processes are taxed by increased target-distractor similarity (Sato et al., 2001, 2003). Our results are in agreement with this. However, it remains to be seen whether FEF or LIP neurons respond to isoluminant color stimuli. The LIP is located within the dorsal processing stream (Baizer et al., 1991), which is not traditionally associated with color processes, but a thorough examination of the chromatic properties of LIP neurons has not been done. The same is true for FEF, which does, however, receive direct projections from color-sensitive area V4 (Schall et al., 1995).
The SC is highly preserved phylogenetically (Dean et al., 1989), and it has been central for guiding and coordinating visual orienting in species with a far simpler visual system than primates (Ingle, 1983). The short latency transient visual response associated with evolutionarily older achromatic pathways (e.g., retinotectal path) provides a rich spatial signal for reflexive orienting (Boehnke and Munoz, 2008). Primate color vision, however, is evolutionarily recent (Jacobs and Nathans, 2009). Rather than replace early achromatic tectal projections, cortical circuitry associated with primate color vision may have been integrated into the existing circuitry of the SC via a higher visuocortical loop. In this way, chromatic and achromatic signals may retain a certain level of independence for the flexible control of orienting behavior.
Footnotes
-
This project was funded by Canadian Institutes of Health Research Grant MOP-77734. D.P.M. was supported by the Canada Research Chair Program. We thank Ann Lablans, Donald Brien, Sean Hickman, and Mike Lewis for outstanding technical assistance, as well as Kelly Shen and members of the Munoz lab for comments on an earlier version.
- Correspondence should be addressed to Brian J. White at the above address. brianw{at}biomed.queensu.ca


