

Abstract
The goal of the present study was to elucidate the corticocortical afferent connections of area V6Av, the ventral subregion of area V6A, using retrograde neuronal tracers combined with physiological and cytoarchitectonic analyses in the macaque monkey. The results revealed that V6Av receives many of its afferents from extrastriate area V6, and from regions of areas V2, V3, and V4 subserving peripheral vision. Additional extrastriate visual projections originate in dorsal stream areas MT and MST. Area V6Av does not receive projections directly from V1; such connections were only observed when the injection sites crossed into area V6. The strongest parietal lobe afferents originate in fields V6Ad, PGm, MIP (medial intraparaietal), and PG, with frontal lobe afferents originating from the frontal eye field, caudal area 46, and the rostral subdivision of the dorsal premotor area (F7). A comparison of their respective connections supports the view that V6Av is functionally distinct from adjacent areas (V6 and V6Ad). The strong afferents from V6 and other extrastriate areas are consistent with physiological data that suggest that V6Av is primarily a visual area, supporting the notion that V6Av is part of a dorsomedial cortical network performing fast form and motion analyses needed for the visual guidance of action.
Introduction
The superior parietal lobule of macaque monkeys encompasses several areas, including V6 and V6A in the anterior bank of the parieto-occipital sulcus (Galletti et al., 1996) (Fig. 1), which collectively operate as an important network in the integration of visual and somatic spatial information. Although V6 and V6A overlap, to some extent, with the “parieto-occipital area” (PO) defined by Colby et al. (1988), they have more recently been shown to be both cytoarchitectonically and functionally distinct (Galletti et al., 2005).

Posterolateral view of a macaque brain [modified from the study by Galletti et al. (1996)]. In the right hemisphere, the occipital pole and the inferior parietal lobule have been partially dissected to expose the areas located in the anterior bank of the parieto-occipital sulcus and in the medial wall of the intraparietal sulcus. The dashed line on the right hemisphere indicates the crown of the intraparietal sulcus. Cortical areas on the precuneate gyrus are represented on a medial view of the left hemisphere. The dashed line on the mesial surface of the left hemisphere represents the border of a partially unfolded cingulate sulcus. Abbreviations: as, Arcuate sulcus; cal, calcarine sulcus; cin, cingulate sulcus; cs, central sulcus; ios, inferior occipital sulcus; lat, lateral fissure; ots, occipito-temporal sulcus; pos, parieto-occipital sulcus; ps, principal sulcus; sts, superior temporal sulcus.
V6 is an extrastriate area that is likely to exist in the brains of most, if not all, primates (Galletti et al., 1999b; Pitzalis et al., 2006; Rosa et al., 2009). Neurons in V6 form a topographically organized representation of the contralateral hemifield, characterized by relative emphasis on peripheral vision. In contrast, cells in V6A display a less regular topographic organization, predominantly representing the lower visual field. Unlike V6, area V6A contains a significant number of neurons with reaching, grasping, and oculomotor-related activity (Galletti et al., 1995; Fattori et al., 2001, 2005, 2009, 2010; Kutz et al., 2003), and units that are strongly modulated by attention (Galletti et al., 1996; Breveglieri et al., 2009). These characteristics indicate that V6A is best described as a visuomotor integration area (Galletti et al., 2003). Although functionally defined area V6 coincides precisely with a cytoarchitectonic field, V6A encompasses distinct dorsal and ventral subfields, named V6Ad and V6Av (Luppino et al., 2005) (Fig. 1). In addition, physiological studies in alert monkeys have hinted at different response properties of neurons in the dorsal and ventral parts of V6A (Fattori et al., 1999; Galletti et al., 1999a). For example, ventral V6A contains a larger proportion of neurons with clear visual responses, whereas cells with somatomotor properties (in particular, those responding to movement of the upper limbs) predominate in V6Ad (Fattori et al., 2001, 2004; Breveglieri et al., 2002).
To further understand the functional organization of the caudal superior parietal lobule, it is necessary to elucidate the pattern of anatomical connections of the different areas that form this region. It has been established that the connections of V6 are dominated by visual inputs, including direct projections from V1, V2, and most dorsal stream areas (Galletti et al., 2001), thus reflecting the physiological properties of this area. In contrast, a recent study reporting on the afferent projections to V6Ad demonstrated a very different pattern of cortical inputs, with emphasis on parietal and frontal areas involved in sensorimotor coordination (Gamberini et al., 2009). To further understand the pathways relaying visual information to the parietal lobe (in particular, the superior and medial parietal areas), we investigated the cortical connections of V6Av. These results provide strong evidence for the functional uniqueness of V6Av, while at the same time suggesting that this area forms one of the main visual input nodes of the parietal sensorimotor integration cortex.
Materials and Methods
Experimental protocols were approved by the Bioethical Committee of the University of Bologna and by the Monash University Animal Experimentation Ethics Committee. All procedures followed the guidelines of European Directive 86/609/EEC on the care and use of laboratory animals and the Australian Code of Practice for the Care and Use of Animals for Scientific Purposes. The findings of the present study are based on the analysis of six retrograde tracer injections, performed in five male macaque monkeys (Macaca fascicularis; 3–7 kg). Fluorescent tracers were injected in liquid form, or applied as crystals, in cortex that was later found to correspond to the cytoarchitectonically and functionally defined area V6Av, based on postmortem reconstruction. Table 1 summarizes the tracers used and the locations of the injections in each case.
Summary of experimental cases, retrograde tracers, and amounts
Injections by direct visualization of V6A.
In five cases (A4a, A4b, MF1, MF2, and MF3), the injection sites were selected by direct visualization of the anterior bank of the parieto-occipital sulcus or mesial surface, after surgical exposure and gentle retraction. The injection sites were placed with reference to previous reconstructions of the location of V6A relative to sulcal landmarks (Galletti et al., 1999a, 2005). Animal A4 was pretreated with injections of atropine (0.04 mg/kg, i.m.) and ketamine hydrochloride (15 mg/kg, i.m.) and, after 30 min, anesthetized with sodium thiopental (8 mg/kg, i.v.). Cases MF1–MF3 were premedicated with intramuscular injections of diazepam (3.0 mg/kg) and atropine (0.2 mg/kg). Anesthesia in these cases was induced 30 min later with alfaxalone (10 mg/kg, i.m.), with supplemental doses (5 mg/kg) administered intravenously during surgery as required. To avoid edema, mannitol was also administered intravenously (1 g/kg). Heart rate, blood pressure, respiratory depth, and body temperature were constantly monitored. Surgical procedures took place in standard aseptic conditions.
The animals were placed in a stereotaxic frame and a craniotomy was performed over the medial posterior parietal cortex. The dura mater was cut and retracted, and when required the hemispheres were separated or the parieto-occipital sulcus was gently opened to expose the anterior bank. The tracers fluorescein-conjugated dextran [Fluoroemerald (FE); Invitrogen; 10% in saline], cholera toxin B subunit conjugated with Alexa Fluor 488 (CTB green, 1% in PBS) or Alexa Fluor 594 (CTB red, 1% in PBS) was injected using a microsyringe that had a glass micropipette attached to its needle. In cases MF1 and MF2, the retrograde fluorescent tracer Fast Blue (FB) was directly applied into the cortex as a crystal (∼200 μm in diameter), with the aid of blunt tungsten wires (Rosa et al., 2005). After tracer injection/application, the cortex was covered with gelfilm, the bone flap was fixed back in place with dental acrylic, and the wound was sutured in anatomical layers. On recovery from anesthesia, the animals were returned to their home cages and closely monitored. Analgesics (ketorolac, 1 mg/kg, i.m., or carprofen, 5 mg/kg, s.c., for 2 consecutive days), and antibiotics (erythromycin, 0.1–0.15 ml/kg, or Norocillin, 0.1 ml) were provided postoperatively.
Injection directed by electrophysiological recordings.
In one case (M21), the areas of the anterior wall of the parieto-occipital sulcus were functionally identified by electrophysiological recordings before the tracer injection. The protocol for electrophysiological recordings has previously been described in detail (Galletti et al., 1995, 1999b, 2001, 2005). During recording sessions, the animals sat in a primate chair facing a large (80 × 80°) tangent screen. They performed a fixation task, with the head restrained, while glass-coated Elgiloy microelectrodes (Suzuki and Azuma, 1976) were advanced through the intact dura mater using a remote-controlled microdrive, which was fitted daily on a recording chamber fixed to the skull. Eye positions were recorded by an infrared oculometer (Bach et al., 1983). The sample rate for action potentials was 100 kHz and that for eye position was 500 Hz. Visual stimuli of different form, color, size, orientation, direction, and speed of movement were used for testing the visual responsiveness of the recorded cells, and for mapping their visual receptive fields. After several weeks of recording sessions, the fluorescent tracer FB (3% in distilled water; EMS-Polyloy and Polysciences) was injected into physiologically identified V6Av using a 1 μl Hamilton syringe with a metal microelectrode attached to the needle. The needle was advanced through the intact dura by the same remote-controlled microdrive. A reconstruction of the penetration of the recording needle of the syringe is shown in Figure 2. It traversed areas V1 and V2 before reaching the anterior bank of the parieto-occipital sulcus, where area V6A can be functionally recognized on the basis of the criteria previously described by Galletti et al. (1999b). For example, several V6A cells encountered along this penetration were activated by relatively complex visual stimuli (including light/dark gratings and corners of different orientation, stimuli moving at specific directions and/or speeds, and visual stimuli that needed to be changed frequently, to avoid rapid adaptation of the visually evoked response). Other cells appeared to be insensitive to visual stimulation. Moreover, as shown in Figure 2, the receptive fields of V6A neurons were much larger than those of visually responsive cells recorded from the occipital lobe and showed a large scatter, as typically observed in area V6A (Galletti et al., 1999a). The tip of the attached micropipette was lowered 1.5 mm into the cortex of the anterior bank, and 0.02 μl of tracer was slowly released at that depth. The micropipette was then slowly withdrawn in steps of 100–200 μm, with small amounts of tracer being released at each location, over ∼30–40 min. As described by Galletti et al. (2001), the leakage of tracer along the needle track was minimized by first filling the syringe with 0.3 μl of paraffin oil, followed by the exact amount of tracer to be injected and, finally, 0.10 μl of paraffin oil. In this way, there was no tracer near the tip of the needle while the syringe was being moved toward the injection site, or withdrawn from it.

Left, Parasagittal section of the brain containing the reconstruction of the penetration of the needle of the recording syringe (pen) in case M21. The “halo” and “core” zones of the injection site are shown on the section as white and black areas, respectively. The recording sites in area V6Av are represented in the magnified view shown on the right. The black circles indicate non-visually responsive (NV) cells, and the white circles represent visually responsive cells. Visual cells recorded from the anterior bank of parieto-occipital sulcus are numbered from 1 to 8. Right, Receptive fields mapped at different recording sites in areas V1, V2, and V6Av. ipsi, Ipsilateral visual field; contra, contralateral visual field. Other abbreviations are as in Figure 1.
Perfusion and histology.
After a survival period of 14 d, each animal was anesthetized with ketamine hydrochloride (15 mg/kg, i.m.), followed by a lethal intravenous injection of sodium thiopental. It was then perfused through the left cardiac ventricle with several liters of saline, followed by 4% paraformaldehyde in 0.1 m phosphate buffer at pH 7.4. Cases A4 and M21 were subsequently perfused with 4 L of 5% glycerol in the same buffer. The brains were then removed from the skull and photographed from several vantage points to obtain a representation of brain morphology and sulcal landmarks, before being cryoprotected by immersion into buffered solutions containing 10 and 20% glycerol (A4, M21) or sucrose (10–30%; MF1–MF3) until they sank (4–5 d in total). The brains were then snap-frozen, and serial sections (50 or 60 μm) were cut on a freezing microtome, in the parasagittal (most cases) or coronal (MF3) planes. One section in five was mounted on a gelatinized slide, air-dried, and coverslipped for fluorescence microscopy after brief dehydration in 100% ethanol and clearing with xylene. Alternate sections were stained for Nissl substance, myelin (Gallyas, 1979), and cytochrome oxidase (Wong-Riley, 1979) to allow the reconstruction of cytoarchitectural, myeloarchitectural, and chemoarchitectural borders, respectively.
Data analysis.
The unstained sections were scanned using a Zeiss Axioscope equipped with 10 and 20× objectives. For all sections examined, the outer and inner cortical borders, the outlines of the injection sites, and the location of labeled cells were charted using software tools that read the input of X/Y transducers mounted on the microscope stage. Photomicrographs of injection sites and labeled cells were obtained through a digital camera connected to a Zeiss Axioscope 2 Plus microscope (Axiovision software, version 4.4; Carl Zeiss). Figure 3 illustrates an injection site in V6Av, and examples of FB-labeled cells.

A, Parasagittal section tangential to the mesial surface, showing the location at which a FB crystal was injected into area V6Av of case MF1. B, Low-power photomicrograph of the injection site. C, Higher magnification (20×) of FB-labeled cells. pom, Parieto-occipital medial sulcus. Other abbreviations are as in Figure 1.
Two- and three-dimensional reconstructions of cortex were produced with CARET software (http://www.nitrc.org/projects/caret/) (Van Essen et al., 2001), from midthickness section contours, according to previously described procedures (Galletti et al., 2005). The same software was used to prepare the density maps of labeled neurons (see Figs. 6, 8) by projecting the location of each neuron to the nearest midthickness contour. For each map, the number of labeled neurons was calculated in area units of 600 × 600 μm superimposed on the flattened reconstruction. The area unit that contained the highest number of labeled cells was used as a reference, and the density of projection cells was expressed as a percentage of this maximum unit value (Rosa et al., 2009). Regions immediately adjacent to the injection sites, where both neurons and glial cells were brightly labeled in a nonspecific manner, were not charted and are represented in the figures as a “halo.”
Identification of V6Av.
The borders of V6Av were defined primarily following the cytoarchitectonic criteria described by Luppino et al. (2005) and corresponding myeloarchitectonic transitions. Figure 4 shows the typical cytoarchitecture of area V6Av, together with that of the nearby areas V6 and V6Ad. Area V6 shows a typical occipital cytoarchitectural pattern, with a thick homogeneous layer IV, a light layer V populated by small pyramidal cells, and a layer VI clearly subdivided into a very dense layer VIb sharply delimited with respect to layer VIa and the white matter. In contrast, both V6Ad and V6Av show a parietal pattern, with a well developed layer III, a relatively dense layer IV in which the upper part appears to be less dense than the lower part, and a layer VI with a blurred border against the white matter. Area V6Ad shows homogeneous layers III and V populated by large numbers of medium-sized pyramidal cells, among which isolated groups stand out. Area V6Av is further characterized by a dense layer III with relatively larger pyramidal neurons in its lower part, and a layer V populated by relatively large pyramidal cells.

Cytoarchitectonic characteristics of areas V6, V6Av, and V6Ad. Left, Drawing of a parasagittal section centered on the anterior wall of the parieto-occipital sulcus. The gray boxes indicated the location of the three high-magnification views shown in the right panels. Scale bars, 5 mm. Right, High-magnification views from Nissl-stained parasagittal sections through the anterior bank of the parieto-occipital sulcus. Scale bars, 200 μm.
Identification of other areas.
Whenever possible, we identified cortical areas that sent projections to V6Av based on cytoarchitectonic and myeloarchitectonic descriptions available in the existing literature. When this was not possible, primarily because of a nonfavorable plane of sectioning, the assignment was based on location relative to sulcal landmarks.
In the depth of the parieto-occipital sulcus, labeled cells were assigned to areas V6 or V6A according to the criteria described above, and to areas V2 and V3, when they occupied the posterior bank of the sulcus and were not contained within the limits of area V6 (Galletti et al., 1999a). Physiological maps (Gattass et al., 1981, 1988) were used to confirm this assignment. Because we found it difficult to distinguish between these fields near the midline cortex, label in this region is referred to as being located in the V2/V3 region.
In the posterior parietal cortex, the superior parietal lobule was subdivided into areas caudal PE (PEc), PE, and medial PG (PGm), whereas the inferior parietal lobule was subdivided into Opt, PG, PFG, and PF (Pandya and Seltzer, 1982; Gregoriou et al., 2006). Labeled cells found in the lateral bank of the intraparietal sulcus were assigned to the lateral intraparietal area (LIP) according to Blatt et al. (1990). Labeling located in the caudal half of the medial bank of the intraparietal sulcus was assigned to the medial intraparietal area (MIP) (Colby et al., 1988), and cells in the rostral half of this bank to intraparietal PE (PEip), according to Matelli et al. (1998). Neurons located along the fundus of the intraparietal sulcus were attributed to the ventral intraparietal area (VIP) (Colby and Duhamel, 1991). Labeled cells located in the superior temporal sulcus were assigned to the transitional V4 (V4T), middle temporal (MT), medial superior temporal (MST), and fundus of the superior temporal (FST) areas on the basis of location within the sulcus, in combination with myeloarchitectonic patterns (Gattass et al., 1988; Komatsu and Wurtz, 1988; Boussaoud et al., 1990). Labeling within and around the cingulate sulcus was assigned either to the cingulate subdivision of field PE (PEci) or to area 23, in agreement with earlier studies (Morecraft et al., 2004; Vogt et al., 2005). The premotor and prefrontal cortices were subdivided following criteria defined by Matelli et al. (1991) and Preuss and Goldman-Rakic (1991), respectively.
Quantitative analyses.
Because the number of labeled neurons depends on the type, volume, and concentration of tracer injected, the distribution of label in each area was expressed as a fraction of the total number of recovered neurons (Galletti et al., 2001; Palmer and Rosa, 2006; Gamberini et al., 2009). The laminar distribution within the cortex was estimated by calculating the percentage of labeled cells in the supragranular layers with respect to the total number of labeled cells in each area (%SNL) (Barone et al., 2000). To calculate the distribution of labeled cells in different laminae, fluorescently labeled sections were superimposed with the adjacent Nissl-stained section using camera lucida.
Results
Here, we describe data obtained after six retrograde tracer injections into macaque area V6Av, which were placed in five animals (Table 1). Figure 5 shows the location and extent of the injection sites plotted on a two-dimensional map, which was prepared based on a template macaque brain (http://www.nitrc.org/projects/caret/) (Van Essen et al., 2001). As indicated in this figure, cytoarchitectonic and myeloarchitectonic analyses of sections around the injection sites showed that three of the injections were completely confined within area V6Av (cases A4a, A4b, and M21). Three additional injection sites included V6Av but crossed into adjacent areas, V6 (cases MF1 and MF3) and V6Ad (case MF2). We will initially describe the cortical connections of area V6Av based on analysis of the three cases in which the injection sites were completely contained in this area, and then will consider the three supporting cases in terms of common findings and differences.

Summary of injection site locations. Injection sites in six cases are illustrated on a two-dimensional reconstruction of the caudal superior parietal lobe of the left hemisphere of a reference monkey brain shown on the left. The dashed contours represent the average cytoarchitectonic borders of V6Ad, V6Av, and V6, respectively. Other abbreviations are as in Figures 1 and 3.
Injections confined to V6Av
In case M21, an injection of FB was placed in the portion of V6Av located in the rostral bank of the parieto-occipital sulcus, under electrophysiological guidance. Even though this was a relatively small injection (Fig. 6, section A), resulting in a comparatively small number of labeled cells outside area V6Av (n = 2156), histological reconstruction indicated that it involved all cortical layers. The distribution of labeled cells in this case is illustrated in a series of parasagittal sections (Fig. 6, top) and in a computer-generated “flat” map (Fig. 6, bottom). The percentages of labeled cells revealed in different areas by this injection are summarized in Figure 7.

Location of the FB injection site in case M21, as well as the cortical distribution of retrogradely labeled cells. Top, Sagittal sections of the brain were taken at the levels indicated on the brain silhouette shown on the left. Each black dot represents a labeled cell. Bottom, Two-dimensional reconstruction illustrating the distribution of labeled cells after injections of FB in V6Av with a recording syringe. Color scale indicates the relative density of labeled cells, counted within 600 × 600 μm units, as a percentage of the maximum unit value. Other details and abbreviations are as in Figures 1⇑–3 and 5.

Main cortical connections of area V6Av. The average percentage of labeled cells in different cortical areas after tracer injections in area V6Av. A, Cases with injection within the cytoarchitectonic limits of area V6Av. Percentages <1% are reported only if in comparison with other cases. B, Cases with injection sites that crossed into adjacent areas.
As shown in Figure 6 (see also Fig. 7A for a quantitative summary), the main afferents of V6Av originate from visual areas, including substantial projections from caudal areas V2 and V3, and from V6. Together, projections from these areas accounted for nearly 40% of the retrogradely labeled cells found in the ipsilateral hemisphere. In addition, smaller contingents of labeled neurons were found in the peripheral representations of areas V4 (6%, with possible inclusion of the dorsal prelunate cortex DP), V4T (2%), and MST (6%). In the medial parietal lobe, many labeled cells were seen in areas V6Ad (17%), PGm (7%), and MIP (3%). A much weaker projection consisting of a few scattered neurons also originated in the lateral parietal field PG. Frontal lobe projections were sparse (together accounting for only 1% of the labeled cells), and quite specific, originating primarily from the rostral bank of the arcuate sulcus and the caudal portion of the principal sulcus (frontal eye field and caudal area 46).
With relatively minor differences, this pattern was replicated in the other two cases (A4a, A4b) in which the injection was restricted to V6Av (Fig. 5). The number of labeled cells observed in these cases was higher than in M21 (A4a, n = 11,579; A4b, n = 5196). Our results are summarized in the flat maps shown in Figure 8, with the percentage of labeled cells found in different areas being shown in Figure 7A. As in M21, densely packed labeled cells were found in the caudal medial occipital lobe (areas V2 and V3; A4a, 10%; A4b, 11%) and in the ventral part of the anterior bank of the parieto-occipital sulcus (area V6; A4a, 24%; A4b, 25%). Likewise, other projections were observed to originate in areas MT (A4b, 1%), MST (A4a, 3%; A4b, 4%), and in peripheral V4/DP (A4a, 6%; A4b, 10%). With regards to visual areas, the only minor difference relative to case M21 was the lack of label in area V4T in cases A4a and A4b. The main parietal projections originated in V6Ad (A4a, 17%; A4b, 8%), PGm (A4a, 9%; A4b, 11%), MIP (A4a, 7%; A4b, 6%), and PG (A4a, 3%; A4b, 1%), although projections from the latter two areas were more marked than in M21. Finally, in the frontal lobe, these two cases also revealed small numbers of labeled cells in the rostral portion of the dorsal premotor area (F7; A4a, 1%; A4b, 2%), as well as the frontal eye field (FEF) and area 46. In addition to these projections, very small numbers of labeled cells (Fig. 8) were observed inconsistently in regions such as area 23 and the ventral temporal cortex (probably corresponding to parahippocampal field TF). Together, these projections accounted for <1% of all labeled afferent connections.
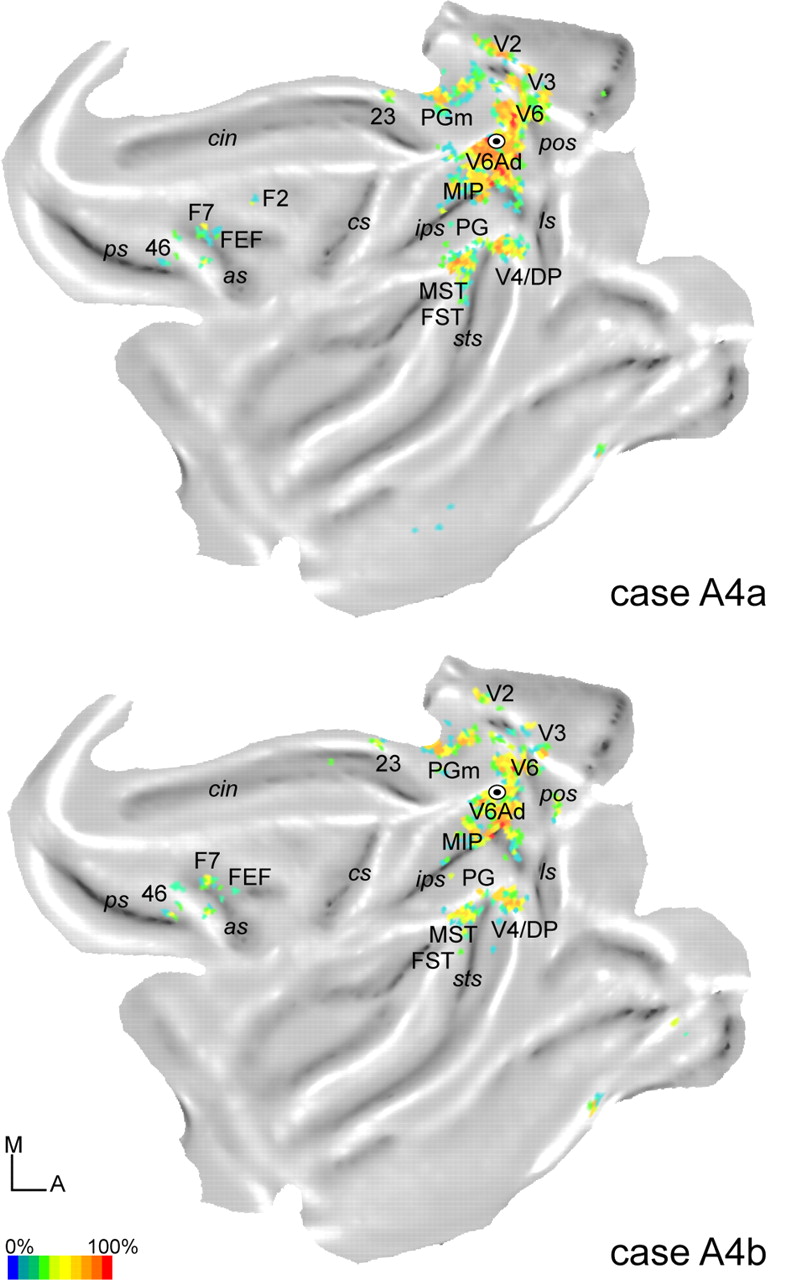
Two-dimensional reconstruction illustrating the distribution of labeled cells after injections in V6Av in cases A4a (top) and A4b (bottom). The color scale indicates the relative density of labeled cells, counted within regions measuring 600 × 600 μm, expressed as a percentage of the maximum value obtained throughout the cortex. Abbreviations are as in Figures 1 and 3.
Injections invading areas adjoining V6Av
Cases in which the injection sites included V6Av, but also encroached into adjacent areas (V6 or V6Ad), revealed many similarities with respect to the pattern describe above. However, they also demonstrated important differences, which illuminate the issue of the distinction between V6Av and adjacent fields.
In case MF1, a crystal of FB was placed (Table 1) in the mesial part of V6Av, but the caudal part of the injection halo invaded V6 near the posterior bank of the parieto-occipital sulcus. The largest proportion of labeled cells was observed in area V6 (Figs. 7B, 9), but in this case many of the labeled cells may represent connections intrinsic to area V6, rather than projections to area V6Av. Most tellingly, many labeled cells in this case were found in area V1, as expected from the invasion of V6 (Galletti et al., 2001). In extrastriate areas, the majority of labeled cells were found in occipital visual areas V2 and V3 (Fig. 7B), as was the case with injections restricted to V6Av. However, in case MF1, patches of labeled cells also included the ventral (upper quadrant representation) parts of these areas (Fig. 9, sections D–F), again as expected from the invasion of mesial V6 (Galletti et al., 2001). As with injections restricted to V6Av, there was also label in peripheral V4/DP, MT, and MST, and a small projection was observed to originate in V3A (section D).

Location of the injection site in case MF1 (V6Av/V6 injection), together with the cortical distribution of retrogradely labeled cells. The three-dimensional reconstruction on the bottom left shows the location of the injection site in a posterolateral view of the ATLAS brain by CARET. Sagittal sections of the brain were taken at the levels indicated on the brain silhouette shown on the bottom left. The center of the injection site is at the level of sections A and B. Each black dot represents a labeled cell. The hatched areas around the injection site in sections A and B indicate the regions not taken into account in quantitative analysis because they are considered as “intrinsic” connections. sas, Superior ramus of the arcuate sulcus; ias, inferior ramus of the arcuate sulcus. Other abbreviations are as in Figures 1 and 3.
In the parietal cortex, dense patches of labeled cells were found in V6Ad and MIP, reflecting the observations after injections restricted to V6Av. Sparse frontal lobe connections to the rostral premotor cortex, FEF, and caudal area 46, were also observed (Fig. 9). However, in case MF1, patches of labeled cells were also found in other areas of the intraparietal sulcus, such as VIP and LIP (each <5% of the total extrinsic label; see section E), and fewer labeled neurons were found in PGm or PG, in comparison with the cases in which the injections were restricted to V6Av (Fig. 7A,B).
In case MF3, a small injection of Fluoroemerald was placed in the mesial cortex, which involved V6Av but also penetrated into adjacent V6 (Fig. 10, section A). Different from all other cases presented here, the injection site in MF3 was mostly restricted to the supragranular layers (with possible minor involvement of the upper part of layer 4). The involvement of V6 was confirmed by the presence of a small number of labeled neurons in V1, near the representation of the upper quadrant vertical meridian, in the calcarine sulcus (Fig. 10, section C) (see also Fig. 7B). Despite the much more restricted injection site, the pattern of label in this case resembled in many respects that described above for MF1 (Fig. 9), including a large proportion of labeled cells in areas V2, V3, and MST, smaller numbers of cells in V4 and MT, and patches involving several parietal areas, and the periarcuate cortex. However, in this case, label in extrastriate cortex was located exclusively in upper quadrant representations (Fig. 10, sections B–H). This observation indicates that, despite its large receptive fields, V6Av has a topographic organization, in which upper visual fields are represented in a relatively small region restricted to the midline cortex, probably forming a congruent border with the upper visual field representation in V6. The main quantitative differences relative to case MF1, which had a larger injection site that encompassed all cortical layers, involved in the lack of labeled neurons in areas MIP and V6Ad, suggesting that these connections may terminate preferentially in the infragranular layers.

Location of the injection site in case MF3 (V6Av/V6 injection), together with the cortical distribution of retrogradely labeled cells. The diagram at bottom right is based on a photograph of the brain where the point of penetration of the injection pipette was visible. The injection site is indicated in section A. Each black circle represents a labeled cell resulting from this injection. Note the extensive label in the representation of the upper quadrant of areas V2–V4.
A large crystal of FB was placed in the rostromedial part of V6Av of monkey MF2 (Fig. 5; retrogradely labeled neurons not shown). The halo of the injection invaded the nearby area V6Ad, and there was also a slight amount of leakage into the posterior bank of the parieto-occipital sulcus, toward the occipital pole (probably in V2). Whereas the pattern of label in this case is difficult to interpret because of the invasion of areas adjacent to V6Av, retrogradely labeled cells were seen in many of the same areas in which they were found when the injection was restricted to V6Av (Fig. 7B), including a predominance of afferents from visual areas V2, V3, V4/DP, V6, MT, and MST. As in case M21, a clear projection from V4T was observed, although this may be attributable in part to the leakage of tracer into the occipital cortex. In addition, as expected from the invasion of V6Ad (Gamberini et al., 2009), we also observed robust projections from cytoarchitectural fields PEc and VIP, which were not found in cases with injections restricted to V6Av.
Laminar patterns of projections
As previously reported, the laminar pattern of labeled cells can be a useful tool for determining the hierarchical level of a particular area with respect to that which was injected (Rockland and Pandya, 1979; Maunsell and Van Essen, 1983; Barone et al., 2000; Rempel-Clower and Barbas, 2000). According to these earlier studies, a high percentage of labeled cells in supragranular layers is indicative of a feedforward projection, whereas a high percentage of labeled cells in infragranular layers indicates a feedback projection (from an area representing a higher hierarchical level).
Analysis of the laminar origin of projection neurons was conducted in the three cases with injections restricted to V6Av (Fig. 11), using the percentage of neurons in the supragranular layers (%SLN) as a metric (Barone et al., 2000). Using as a first approximation the criteria defined by Grant and Hilgetag (2005) for the cat visual association cortex, we found that, with few exceptions, the projections to V6Av could be classified as “lateral” (i.e., characterized by nearly balanced proportions of cells in the supragranular and infragranular layers). The highest %SLN values, which are usually associated with feedforward projections, were observed in the caudal occipital cortex (V2/V3) and in area MIP, suggesting that visual information arrives from V2/V3, and motor-related reaching/grasping information from MIP. Conversely, the projections from two motion-sensitive visual areas of the dorsal stream (MT and MST) were characterized by relatively low %SLN values, suggesting visual feedback connections.

Laminar organization of projection neurons. Areas and regions that contained labeled neurons have been positioned according to their %SLN values. The dashed lines (%SLN values, 39 and 69) demarcate the range corresponding to lateral projections (Grant and Hilgetag, 2005).
In contrast with the preliminary results of Gamberini et al. (2009), who reported that V6Av sends feedforward information to V6Ad, we found that these two areas have a lateral pattern of connections. This discrepancy could arise from the different sizes of the injections, which were larger in the earlier study. We do, however, note that, although smaller injections such as the ones used in the present study are valuable in that they afford greater spatial accuracy, they can be misleading when it comes to the laminar distribution of backlabeled cells as they do not ensure uniform effective tracer uptake across all cortical layers.
Discussion
In this study, we demonstrated that area V6Av, one of the functional subdivisions of the rostral bank of the parieto-occipital sulcus of the macaque, receives major inputs from extrastriate visual areas, as well as inputs from parietal and frontal areas involved in sensorimotor integration. Quantitative analysis of these connections suggests that V6Av is primarily a visual area and that it is likely to represent a crucial anatomical bridge between V6 and V6Ad. As discussed in detail below, the finding that V6Av receives input from regions subserving peripheral vision, as well as the fact that its neuronal properties are well suited for coordinating gaze shifts with reaching, suggest that this area represents a quick route for information about the visual periphery to reach the parietal cortex. In addition, V6Av is directly connected with parietal areas in which reaching- and grasping-related activity is represented, and these areas are directly connected with the premotor cortex. This network is likely to control both spatial orientation and visuomotor integration, including a critical role in the control of visually guided prehension in extrapersonal space.
Connections with visual areas
Reflecting expectations based on the response properties of neurons located in area V6Av (Fattori et al., 2001, 2004), a large proportion of cells projecting to this region were located in visual areas, in particular V2, V3, V4, V6, and MST. Previous work has shown that injections in V6 lead to labeled cells located mainly in the ventral part of area V6A (Galletti et al., 2001). Furthermore, Gamberini et al. (2009) provided preliminary evidence that V6Av receives inputs from V6, and in turn projects to V6Ad. These earlier results, in combination with the present data, strongly suggest that V6Av plays an important role in the transfer of visual information to V6Ad, and hence to the caudal parietal cortical areas involved in the visual control of limb movement (Fig. 12).

Summary of connections of areas in the rostral bank of the macaque parieto-occipital sulcus, highlighting similarities and differences between V6, V6Av, and V6Ad. The boxes representing different areas are organized approximately in a caudal to rostral sequence, from the bottom part of the figure to the top. The proportion of neurons forming each connection is indicated by the thickness of the bars linking different areas. Areas in the ventral part of the parieto-occipital sulcus (V6, V6Av) are dominated by visual afferents, and this emphasis is gradually substituted by sensory association and visuomotor/premotor connections as one proceeds toward V6Ad (for a continuation of this trend into area PEc, see also Bakola et al., 2010). This representation highlights the role of V6Av as a crucial link in the integration of visual and somatic/motor information.
Strong visual inputs to V6Av originated in occipital visual areas V2 and V3. We did not attempt to quantify the relative strength of the projections from these areas, as there is some degree of uncertainty about the medial extent of V3 (Essen and Zeki, 1978; Gattass et al., 1988; Felleman et al., 1997; Rosa and Tweedale, 2001), and its cytoarchitectonic borders are difficult to discern medially. However, our best estimate is that inputs from V6Av originate in both areas. This hypothesis is supported by analysis of case MF3, in which labeled cells were located in the ventral cortex, where the border between V2 and V3 is better characterized (Gattass et al., 1988). These findings are consistent with the observations of previous studies (Colby et al., 1988; Gattass et al., 1997), which demonstrated that the peripheral field representations of V2 and V3 project to the PO. According to recent data, area PO, as defined by Colby et al. (1988), partially overlaps with areas V6 and V6Av (Galletti et al., 1999a; Rosa and Tweedale, 2001). It has been suggested that “dorsal stream” areas, in particular those within the medial occipitoparietal cortex, receive preferential inputs from peripheral field representations, consistent with their role in spatial vision (Gattass et al., 1990). The presence of projections from peripheral field V2 and V3 to V6Av is consistent with this notion. Visual input could also flow from V1 to V6 (Galletti et al., 2001), and then from V6 to V6Av (Galletti et al., 2001; Gamberini et al., 2009; present study). One of the shortest routes of visual input to the premotor cortex involves subsequent connection steps from V6Av to V6Ad, and finally from V6Ad to the dorsal premotor areas F2 and F7 (Matelli et al., 1998; Galletti et al., 2004; Gamberini et al., 2009).
Labeled neurons were also noted in area V4. Similar to the projections from V2 and V3, these neurons were located in regions subserving peripheral vision. Cells in area V4 are sensitive to many features relevant to object perception, including color, spatial frequency, orientation, length, and width (Zeki, 1980; Desimone and Schein, 1987; Schein and Desimone, 1990; Cheng et al., 1994). However, little is known about the response properties of cells in the peripheral representation of this area. As in V1 (Yu et al., 2010), it is possible that the response properties change as a function of eccentricity, with cells subserving peripheral vision emphasizing parameters that are relevant for motion and spatial analyses. Previous studies have demonstrated that V4 appears to be an important source of visual information for occipitoparietal areas within the dorsal processing stream, including PO (Mishkin and Ungerleider, 1982; Ungerleider et al., 2008). The finding of a projection arising from the peripheral field representation is consistent with the results of lesion studies, which have demonstrated that the periphery makes a greater functional contribution to spatial vision, compared with object vision (Mishkin and Ungerleider, 1982; Ungerleider and Mishkin, 1982). Finally, the direct projections from V4 to the V6 complex highlight the integration of information between the dorsal and ventral streams (Rosa et al., 2009). Projections from V2, V3, and V4 could provide a route for information about object shape to reach the parietal cortex, and thereby rapidly activate circuits for spatial vision and spatial attention (Fig. 12).
The present results also show that area MST is connected with V6Av. MST shares with V6Av a strong sensitivity to the direction of motion of objects in the visual field (Desimone and Ungerleider, 1986; Saito et al., 1986; Galletti et al., 1996) and has been shown to send a reciprocal projection to the region likely to encompass V6Av in the New World monkey Cebus apella (Rosa et al., 1993). In addition, MST receives specific projections from the regions of V1 and V2 subserving peripheral vision (Sousa et al., 1991; Palmer and Rosa, 2006). A small number of labeled cells were also found in area MT. Input from these superior temporal areas could help mediate interactions with objects during self-motion, a role that is also likely to involve substantial connections with V6 (Rosa and Tweedale, 2001; Galletti and Fattori, 2003; Pitzalis et al., 2010).
Connections with eye/arm movement-related areas
Connections of the anterior bank of the parieto-occipital sulcus with area PGm have previously been described by several authors (Pandya and Seltzer, 1982; Colby et al., 1988; Cavada and Goldman-Rakic, 1989; Leichnetz, 2001; Parvizi et al., 2006). Our results are more enlightening in that they are based on an improved understanding of the subdivisions of the parieto-occipital cortex, thus allowing us to conclude that PGm projects to V6Av, as well as to V6Ad and PEc as described previously (Gamberini et al., 2009; Bakola et al., 2010). Cells in PGm are modulated by eye and hand movements (Ferraina et al., 1997; Thier and Andersen, 1998), but, unlike those in V6A, they are reported to be insensitive to visual stimulation (Ferraina et al., 1997). This functional difference, together with cytoarchitectonic (Luppino et al., 2005) and connectional (Cavada and Goldman-Rakic, 1989) criteria, confirms that PGm and V6Av are adjacent but separate areas.
V6Av receives inputs from area MIP, which contains neurons responsive to somatosensory and visual stimulation, as well as cells related to active arm-reaching movements (Colby and Duhamel, 1991). Similar patterns of activity have been observed within V6A (Breveglieri et al., 2002). The functional properties of MIP cells most closely resemble those found in the dorsal part of V6A. The presence of connections between MIP and V6Av, together with previous results showing much stronger connections with V6Ad (Gamberini et al., 2009), support the view that the V6A complex and MIP are closely related in terms of function. However, the present data help to refine this picture by further highlighting the difference between V6Ad and V6Av, in terms of the strength of this MIP projection. Connections with MIP are likely to mediate the integration of visual, somatic, and motor information both before and during the act of reaching (Fattori et al., 2009, 2010; Gamberini et al., 2009).
Frontal lobe projections were observed from FEF, the caudal principal sulcus (area 46), and the premotor area F7. After injections in PO, Colby et al. (1988) also reported small numbers of labeled cells in the frontal cortex. In addition, Marconi et al. (2001) described strong, reciprocal connections between the V6A region and F7, whereas Matelli et al. (1998) found that F7 injections resulted in labeled cells in the ventral part of V6A. These direct links to premotor cortex, FEF, and area 46 are also clear in New World monkeys, as demonstrated by injections of the putative homolog of V6A [the dorsoanterior area (DA)] (Burman et al., 2006, 2008). The fact that the rostral premotor cortex contains neurons with activity related to eye and arm movements (Schlag and Schlag-Rey, 1985, 1987; Boussaoud et al., 1998; Gregoriou et al., 2005), including those active during reaching (Caminiti et al., 1991), is in agreement with a functional link between area F7 and V6Av. Area 46 contains cells sensitive to visual stimulation and saccadic eye movements (Funahashi et al., 1991; Baker et al., 2006), as well as cells related to attention (Ichihara-Takeda and Funahashi, 2007; Watanabe and Funahashi, 2007). Saccade-related activity and attentional modulation have also been observed in V6A (Galletti et al., 1996; Kutz et al., 2003). These neuronal properties are well suited for coordinating gaze and attention toward the objects to be grasped (orienting movements), which appear to be among the roles of the V6A complex (Galletti et al., 2003).
Footnotes
-
This work was supported by European Union Grant FP6-IST-027574-MATHESIS; the Italian Ministry of Education, University, and Research; Fondazione del Monte di Bologna e Ravenna, Italy; and Australian Research Council Grants LX0776009 and SRI1000006. We thank L. Sabattini and R. Mambelli for the technical assistance, K. Worthy and K. Richardson for the histological work, and M. Zucchelli for the surgical support. We are grateful to R. Tweedale for revising this manuscript.
- Correspondence should be addressed to Prof. Claudio Galletti, Department of Human and General Physiology, University of Bologna, 40127 Bologna, Italy. claudio.galletti{at}unibo.it


