

Introduction
Over the last 30 years the development of new and exciting techniques has enabled us to observe the localization of function in the human brain and to discover how the working brain supports mental activity in health and disease. The most commonly applied brain imaging techniques, positron emission tomography (PET) and functional magnetic resonance imaging (fMRI), use signals that are derived from local changes in cerebral blood flow or metabolism that accompany alterations of brain function. One of the important problems is how we translate the neuroimaging signals to basic neurophysiology. To this end we need detailed studies of the changes in cerebral blood flow (CBF) or oxygen and glucose consumption that are triggered by different types of nerve cell activity. Fortunately this has become feasible by the application of optical and fMRI techniques for mapping of vascular and metabolic signals simultaneously with electrophysiological measurements. Thus changes of neuronal function as indicated by single-cell recordings or local field potentials (LFPs) have been related to hemodynamic changes in real time within the same small brain region. Most of these studies have not measured the blood-oxygen level-dependent (BOLD) signal directly, but the findings are relevant for fMRI as well because CBF is expected to be the major factor for the positive BOLD response (Ogawa et al., 1993, 2000). We present here the basis for the hypothesis that CBF and BOLD signals evoked by neuronal activity relate to the afferent input function, i.e., all aspects of presynaptic and postsynaptic processing, and not the efferent function, i.e., the spike rate out of the activated region, and our view of the mechanisms that couple neural activity to the cerebral circulation.
Do functional neuroimaging signals represent action potentials in principal target cells in the activated brain region?
Increases in CBF or BOLD responses recorded by functional neuroimaging have traditionally been perceived as representing increases in spike activity in the principal target cells of the active brain region. This concept is the basis for the construction of physiological connectivity maps among cortical and subcortical regions (Friston and Price, 2001) and for the idea of a close relationship between the number of action potentials in cortical neurons and the imaging signal based on existing knowledge of the functional organization of the cerebral cortex (Malonek and Grinvald, 1996; Tagamets and Horwitz, 1998; Duong et al., 2001). However, both theoretical arguments and experimental results suggest that this apparent correlation occurs only in specific circumstances as discussed in the following.
Activation of the cerebral cortex leads to desynchronization of the EEG that is not necessarily accompanied by increases in the overall discharge rate of cortical neurons (Creutzfeldt, 1975). Multiunit recordings show a tendency toward increased spiking, but some neurons decrease their firing rate. This may reflect the fact that the basal neuronal firing rate is the most important variable for the population response to stimulation. Cells with a low spontaneous firing rate exhibit the largest responses to stimulation, whereas cells that are already active respond very little, if indeed at all. Therefore, the overall spike response in a population of neurons may remain unchanged in response to a stimulus despite large variations in single-cell activity because only relatively few nerve cells change activity as a function of stimulation (Scannell and Young, 1999). Thus, activation may lead to a redistribution of spiking activity rather than an overall increase in the net spiking activity, and the CBF or BOLD signals that are recorded in different functional states may not necessarily reflect increases in spiking activity in a congruent population of active neurons (Scannell and Young, 1999).
The relationship of spike activity to vascular signals has been addressed experimentally in a number of studies, and in one such study spike activity and CBF were recorded simultaneously from the thalamic nuclei and the somatosensory cortex in awake and anesthetized cats during sciatic nerve stimulation. The data revealed proportional increases in thalamic spike rate and thalamic CBF in awake cats, but the spike rate and CBF were not correlated in the cerebral cortex (Tsubokawa et al., 1980). Other studies have correlated the BOLD signal obtained in fMRI studies to spike recordings obtained under comparable experimental conditions in separate studies. Rees et al. (2000) compared BOLD data obtained from the human visual cortex with single-cell recordings in the same brain region in the macaque. They observed that for comparable experimental conditions the rate of change of the spike rate was nine spikes per second per neuron for each 1% change of the BOLD signal (Rees et al., 2000). However, another study that examined the primary visual cortex reported that the rate of change of the spike rate was 0.4 spikes per second per neuron per 1% change of the BOLD signal (Heeger et al., 2000). Thus, the amplitude of fMRI responses is proportional to neuronal firing rates, but the large difference in the proportionality factor between the increases in BOLD signal amplitudes and the spike rates suggests weaknesses in this eclectic approach. Nevertheless, the idea of a linear relationship between the relative increase in spike rate of layer IV cortical neurons and the BOLD signal amplitude was supported in a recent paper that examined responses of the sensory cortex of anesthetized rats (Smith et al., 2002). At this point, however, it is important to remember that action potentials are preceded by and the result of subthreshold synaptic activity in the targeted neurons. Therefore, an alternative interpretation of these studies is that the BOLD signal amplitude is proportional to several categories of neuronal activity, including all aspects of synaptic processing before the production of action potentials. This is consistent with the conclusion of another recent paper that examined visual function in monkeys by fMRI and electrophysiological techniques at the same time under four different experimental conditions. This study reported that the BOLD signal was dissociated in time from spiking activity in layer IV (Logothetis et al., 2001). This indicated that the BOLD signal amplitude was not an indicator of the spike rate in cortical neurons.
We have used the rat cerebellar cortex for detailed studies of the relationship among action potential production, synaptic activity, and changes in CBF. The cerebellum is a robust preparation, and the basic functional design of the intrinsic neuronal networks is simple compared with other parts of the CNS. Changes of physiological function may be observed at the neuronal network level by appropriate positioning of stimulating and recording electrodes and probes. Along this line, we identified a number of neural network layouts as indicated in Figure 1 in which we examined the effect of monosynaptic excitation, disynaptic inhibition, and deactivation on neural activity and CBF (Fig. 1, top). First, we briefly describe some of the features of the cerebellar cortex that are relevant for understanding the experiments described in the last part of this section.

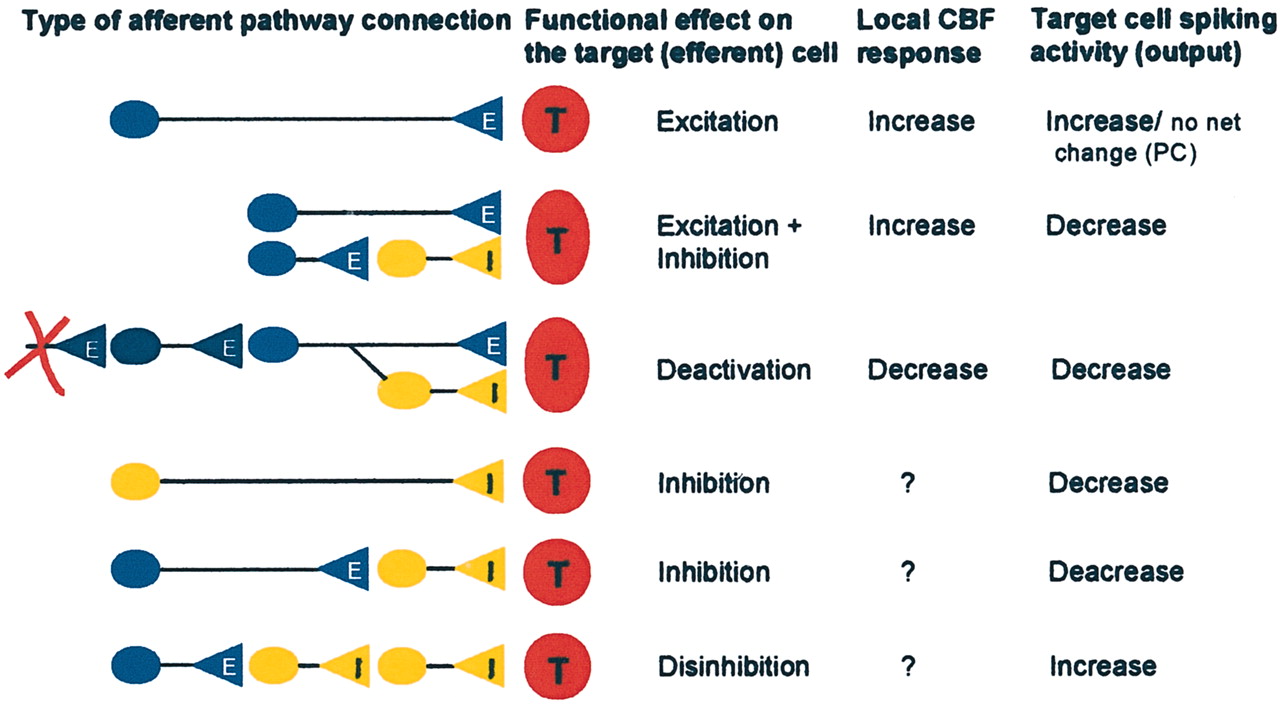
Schematic drawings of neuronal circuits thought to be relevant for studies of the coupling between neuronal activity and CBF or BOLD signals. Our studies and those of others have demonstrated the hemodynamic changes produced by monosynaptic excitation as shown in the first line, mixed disynaptic inhibition/excitation as shown in the second line, and deactivation as shown in the third line. The bottom three panels show other categories of neuronal circuits that will need to be examined to obtain a better understanding of the neuronal basis of CBF or BOLD signals. E, Excitatory; I, inhibitory; T, target cell.
The basic circuitry of cerebellar cortex is organized around the Purkinje cells from which the final and only output from the cerebellum originates. The activity of Purkinje cells in vivo is modified by two excitatory afferent inputs: parallel fibers (PFs) and climbing fibers (CFs). The axons of granule cells, PFs, make excitatory synapses to the distal dendrites of Purkinje cells (Llinas and Sugimori, 1992). PF stimulation results in monosynaptic excitation of Purkinje cells that is followed by an IPSP attributable to excitation of interneurons (Llinas and Sugimori, 1992). The CFs originate in the inferior olive in the brain stem. In most adult animals only one CF afferent contacts a given Purkinje cell on primary or secondary dendrites, i.e., close to the cell body (Llinas and Sugimori, 1992). Activation of CFs elicits a stereotyped synaptic response followed by a complex spike, i.e., a large action potential in Purkinje cells followed by high-frequency bursts of smaller action potentials. In summary, CF stimulation produces a powerful monosynaptic excitatory input onto Purkinje cells, whereas activity in parallel fibers produces more complex integration in Purkinje cells on a longer time scale via activity in two synapses.
The results described in the following are shown in Figure 2 and in our previous publications (Akgoren et al., 1997; Mathiesen et al., 1998; Lauritzen, 2001). First we examined the hypothesis that stimulation of the purely excitatory climbing fibers evoked a blood flow response that was proportional to the spike rate of the Purkinje cells. We examined the frequency dependency of the CBF response and the spike rate in the Purkinje cells at the same time to test this idea. Under control conditions, cerebellar Purkinje cells fired simple spikes at random (Fig. 2a), but climbing fiber stimulation changed the discharge pattern in Purkinje cells; hence simple spikes were replaced by complex spikes. We observed that the number of complex spikes increased, but at the same time the number of simple (spontaneous) spikes decreased and the overall spike rate remained the same. Thus, our first hypothesis was false. We then tested the hypothesis that the rise in CBF was proportional to the number of complex spikes but independent of the total number of spikes. This hypothesis was also false because the saturation frequency was 10 Hz for the CBF response (Fig. 2b), whereas the number of complex spikes continued to increase up to stimulation frequencies of 15-20 Hz. Thus, our data could not support the hypothesis that activity-dependent increases in CBF were proportional to the spike rate in efferent neurons.

Interrelationship of action potentials, synaptic activity, and local changes in CBF in rat cerebellar cortex. a-d, Recordings of action potentials (a), CBF (b), LFP (c), and CBF versus ΣLFP (d) for stimulation of the climbing fiber system. e-h, Recordings of action potentials and CBF (e), CBF (f), ΣLFP versus CBF (g), and LFP (h). a, Under control conditions Purkinje cells discharges were mainly simple action potentials that were triggered by the mossy-fiber granule cell system. In response to climbing fiber stimulation, this spike pattern changed to become dominated by complex spikes at 1, 2, 5, 7, 10, and 15 Hz. However, the total number of spikes remained the same. b, CBF increased frequency dependency at the same time but already reached a plateau at 10 Hz, whereas the number of complex spikes continued to increase up to 20 Hz. This suggested that the rises in CBF and spike rate were dissociated. c, The LFP evoked by climbing fiber stimulation was monophasic and negative, produced by ion fluxes in postsynaptic cellular elements. d, CBF increases evoked by climbing fiber stimulation were linearly correlated to ΣLFP recorded at a depth of 400 μm, i.e., corresponding to maximal postsynaptic activity. e, Purkinje cell spike activity and CBF evoked by parallel fiber stimulation. Spikes almost disappeared at 1-3 sec after onset of stimulation, and the spontaneous firing did not return to normal until 19-25 sec after end of stimulation. CBF increased during stimulation, continued to increase for 5-10 sec after end of stimulation, and reversed to baseline after 40-50 sec. The GABAA antagonist bicuculline (0.5 mm, topical application; horizontal bar) did not affect CBF but attenuated the inhibition of Purkinje cell spike activity during stimulation. This figure demonstrates the complete dissociation of spikes and vascular signal. f, Frequency dependence of CBF rises in response to parallel fiber stimulation. g, Correlation of frequency-dependent increases in CBF to ΣLFP indicated a sigmoid relationship. h, Enlarged LFP to indicate how amplitudes were calculated. The first negativity (N1) was associated with the presynaptic action potential, whereas the second negativity (N2) represents postsynaptic excitation. The amplitude was measured as the voltage difference between the two dashed lines. Adapted from Mathiesen et al. (1998).
In separate experiments the cerebellar parallel fibers were stimulated directly (Fig. 2e). This resulted in total inhibition of Purkinje cell spike activity caused by the synchronous activation of inhibitory interneurons. In contrast, CBF increased frequency dependently in face of zero spikes (Fig. 2e). This result indicated that the production of action potentials in principal nerve cells during activation was not a condition for a concomitant increase in CBF. The result implies that it is impossible on the basis of increases in CBF (or the BOLD signal) to conclude whether the spike activity in a given brain region is increased or decreased (Mathiesen et al., 1998). Taken together, the cerebellar studies questioned the idea that signals recorded by functional neuroimaging correlated to the efferent function of the region that was stimulated (Mathiesen et al., 1998). This result was supported by the study of Logothetis et al. (2001), which suggested that the BOLD signal reflected categories of neuronal activity other than spikes, i.e., subthreshold synaptic activity. We then decided to examine the possibility that the amplitude of the vascular signals depended on afferent function, i.e., all aspects of presynaptic and postsynaptic processing in activated neuronal circuits before the production of action potentials.
Is the magnitude of CBF and BOLD signals determined by the afferent input function?
To address this question we focused on recordings that would help us to monitor processing at the level of the excitatory synapse. The most commonly used indicator of synaptic function in vivo is the LFP, which is produced by synchronized activity of ensembles of nerve cells. Synaptic activity is associated with ion fluxes across the cell membrane that produce changes in the field potential. In an excitatory synapse, a net influx of positive ions is most commonly observed at the site of excitation. A net efflux of positive ions accompanies this from other parts of the same cell, leading to extracellular current flow. Because of the resistive properties of the extracellular media, this causes a potential change that can be measured as the extracellular or local field potential (Nicholson, 1973). In the following we use LFP amplitude measurements to indicate the magnitude of synaptic activity and relate this variable to CBF or BOLD signal amplitudes.
The simultaneous recordings of electrical activity and CBF revealed that the vascular response took several seconds to develop, whereas the LFP appeared within a few milliseconds (Mathiesen et al., 1998, 2000; Ances et al., 2000). This suggested that the biological mechanism underlying the transform of neural activity to CBF was slow. We as well as others have observed that the LFP amplitudes do not correlate with the CBF signals because the LFP amplitudes decrease as a function of the stimulus frequency, whereas the blood flow response increases (Ibanez et al., 1995; Mathiesen et al., 1998; Ngai et al., 1999). Therefore, we decided to sum the LFP amplitudes for the entire stimulation period (ΣLFP) to be able to compare the coupling relation between synaptic activity and CBF for different experimental protocols (Mathiesen et al., 1998). This took into account the accumulated effect of synaptic activity on the vessels, the occasional dropouts of LFP signals especially at high stimulation frequencies, and decreases in LFP amplitudes as a function of the stimulus frequency. The data suggested a linear relationship between ΣLFP and CBF for the climbing fiber system (Fig. 2 d) (Mathiesen et al., 1998) and for the somatosensory system in two studies that used stimulation of the hindpaw (Ngai et al., 1999; Matsuura and Kanno, 2001). Another three studies documented a linear correlation between the amplitudes of the BOLD signal and the amplitude of somatosensory evoked potentials (SEPs) recorded from the scalps in humans (Arthurs et al., 2000), and the LFP signal in monkey and rat cortex (Brinker et al., 1999; Logothetis et al., 2001). The fact that summed field potential amplitudes correlated to CBF, whereas the amplitude of averaged SEPs correlated to the BOLD signal, may suggest that the coupling relation between synaptic activity and the BOLD or CBF differ depending on recording conditions. Nonetheless, these studies all show a strong correlation between postsynaptic neuronal activity and the CBF or BOLD response.
Our own study of the sensory cortex (using infraorbital nerve stimulation) and of the cerebellar parallel fiber system suggested nonlinearity of the relationship between synaptic activity and CBF because a plot of ΣLFP versus CBF was sigmoid (Fig. 2g) (Mathiesen et al., 1998; Nielsen and Lauritzen, 2001). The finding of a threshold and a plateau for the blood flow responses suggested that for very low and very high levels of synaptic activity there was no corresponding increase in CBF. In between these extremes there was a range within which the CBF increase was linearly coupled to postsynaptic activity. Our results were supported by a mathematical model based on experimental data, which suggested that the relationship between neural activation and CBF in the rat somatosensory cortex evoked by forepaw stimulation was indeed nonlinear (Ances et al., 2000). Thus, low levels of synaptic activity were not always accompanied by increases in blood flow, and for high levels of stimulation there was an uncoupling of synaptic activity and CBF. The possibility of a nonlinear relationship between synaptic activity and BOLD or CBF signals may be relevant for studies in which images are compared for different functional states. In conclusion, excitatory synaptic activities do correlate to increases in CBF and BOLD signals. The relationship appears to be linear for some experimental conditions and nonlinear for other conditions, but we still need to get more insights into the transform of neural activity to CBF and BOLD signals.
How well does a local increase of CBF or BOLD reflect the distribution of the underlying neuronal activity?
Other papers have compared cortical maps generated on the basis of vascular or BOLD signals with maps from microelectrode recordings, which directly measured spikes or synaptic activity in response to stimulation. The results suggest that both BOLD and CBF responses can be used to determine the topographic organization of the cortex, but there is a considerable discordance (40 - 50%) with respect to the electrophysiological mapping (Narayan et al., 1995; Akgoren et al., 1996; Disbrow et al., 2000; Harrison et al., 2002). This may be explained by the orientation of the local vessels with respect to the activated region (Disbrow et al., 2000) or propagated vasodilatation from areas of active cortex to up-stream vessels with larger territories of supply than the active region (Iadecola et al., 1997; Erinjeri and Woolsey, 2002). It is also possible that vasodilator substances diffuse from active regions to adjacent nonactive regions or that the LFP is too small for some types of stimulation and target cells to become detected even with microelectrode techniques (Akgoren et al., 1996). Finally, neurons within the cortex and in subcortical structures project to cortical vessels, an arrangement that is fit to adjust flow to activity because the projections contain potent vasodilator substances (Zhang et al., 1991; Chedotal et al., 1994; Iadecola, 1998; Tong and Hamel, 2000; Vaucher et al., 2000). Thus, there are anatomical and physiological mechanisms that limit the physiological resolution, i.e., the accuracy of functional localization of the vascular signals in relation to the underlying neural signal, and the extent to which PET and fMRI studies can contribute to an exact localization of brain function.
The distribution of stimulus-evoked changes of glucose metabolism and CBF within the cortex appears to be more localized. This opens up the possibility of studying laminar communication within distinct brain regions when using optical or fMRI techniques with high temporal resolution (Nielsen and Lauritzen, 2001; Silva and Koretsky, 2002). Autoradiographic studies have shown that the maximal rise in glucose consumption and CBF occurs in layer IV, to which the major part of the thalamocortical fibers project (Ginsberg et al., 1987; Sokoloff, 1999; Gerrits et al., 2000). This is consistent with real-time recordings of CBF and BOLD (Akgoren et al., 1997; Nielsen and Lauritzen, 2001; Silva and Koretsky, 2002). The physiological basis of the differences in CBF increments between different layers may be the strategically placed pericytes that are believed to regulate capillary blood to meet demands in the immediate microenvironment (Ehler et al., 1995; Harrison et al., 2002) or differences in capillary density accompanying differences in synaptic function (Patel, 1983; Cox et al., 1993). We expect that real-time studies of the laminar distribution of the hemodynamic changes will prove useful in the identification of the vascular mechanisms that underlie the CBF or BOLD signals.
CBF and BOLD signals evoked by synaptic inhibition and deactivation
We have so far considered the changes in vascular and metabolic signals that accompany increases in neural function. However, a fundamental aspect of brain function is the continuous variation in synaptic excitation and inhibition that leads to different levels of activity. It suggests that decreases in neural activity occur as often as increased activity under normal conditions. This may be related to increases in synaptic inhibition attributable to excitation of interneurons that triggers GABA release, and interaction of GABA with its receptors, or deactivation, i.e., decreased activity in one brain region caused by decreased activity in a projecting brain region.
Synaptic inhibition
The experimental data for the cerebral cortex, the hippocampus, and the cerebellar cortex are consistent with the hypothesis that effective synaptic inhibition is energy demanding (Ackermann et al., 1984; Bruehl and Witte, 1995; Iadecola et al., 1996). However, it remains an open question whether it is the excitation of inhibitory interneurons or inhibition per se that costs energy, because these studies could not distinguish directly the effects of GABAergic transmission from indirect effects attributable to excitation of interneurons. One study of a monosynaptic glycinergic inhibitory circuit did report an increase of glucose consumption of the targeted neurons during inhibition (Nudo and Masterton, 1986), but prolonged hyperpolarization of cortical neurons caused by inhibition was accompanied by a decrease in glucose consumption (Bruehl and Witte, 1995). No data are available for the energy consumption evoked by activity in monosynaptic GABAergic circuits. Therefore, it is difficult to extrapolate the existing data to the level of neurotransmission at the inhibitory GABAergic synapse.
In human fMRI studies, the relative influence of synaptic inhibition and excitation has been examined using the go-nogo paradigms. The results of one such study suggested that GABAergic transmission was of minor importance for the BOLD signal in the supplementary motor cortex and the primary motor cortex, if indeed of any importance at all (Waldvogel et al., 2000). Another study demonstrated an increased BOLD signal in several brain regions during a nogo test (Durston et al., 2002). The BOLD signal amplitude increased as a function of the preceding number of go trials. This suggested that synaptic inhibition produced under nogo conditions was energy demanding but dependent on the experimental conditions. Two human studies that used intracarotid or intravenous administration of a strong GABA agonist (4,5,6,7-tetrahydroisoxazolo-(5,4)-pyridin-3-ol) reported a decrease in CBF (Roland and Friberg, 1988) and an increase in glucose consumption (Peyron et al., 1994). These data are difficult to reconcile because one would expect increases in glucose consumption to be accompanied by increases in CBF and decreases in CBF to be accompanied by decreases in glucose consumption on the basis of the idea of a coupling between neural activity, glucose consumption, and blood flow. Nevertheless, the data of Roland and Friberg (1988) are consistent with animal studies, which demonstrated that intravenous injection of a GABA agonist reduced CBF and glucose consumption to the same degree (Kelly and McCulloch, 1983; Kelly et al., 1989). The effect of the GABA agonist was most pronounced in cortical layer IV rather than in the superficial cortical layers that contained the highest density of GABA receptors. This pointed to interaction of the GABA agonists with thalamic receptors that modified cortical CBF and glucose consumption indirectly via deactivation of the cortex as described in the following section.
The study of Roland and Friberg (1988) might suggest that GABA agonists control CBF directly via interaction with blood vessels. This possibility was examined in hippocampal slices with functioning blood vessels (Fergus and Lee, 1997). Application of the GABAA receptor agonist muscimol dilated the penetrating arterioles, whereas baclofen, a GABAB receptor agonist, induced vasoconstriction. These studies are at variance with in vivo studies of the cerebellar cortex which showed that CBF remained constant under conditions of documented GABAergic inhibitory activity that subsequently was blocked by GABA antagonists (Li and Iadecola, 1994; Akgoren et al., 1996). Our own unpublished data suggest that superfusion of brain tissue with GABA, or synthetic agonists of the GABA receptors, has no direct influence on CBF. In conclusion, the excitation of inhibitory interneurons that precedes effective synaptic inhibition is energy demanding, but we still need to identify the changes in BOLD or CBF signals that accompany GABAergic inhibition per se under in vivo conditions.
Deactivation
Reduced neural activity may also be caused by deactivation, i.e., decreases in the excitatory synaptic input to a defined neuronal circuit because of a decrease in activity in excitatory fibers projecting to that region (Figs. 1, 3) (Gold and Lauritzen, 2002). This may underlie the decrease in BOLD and CBF signals observed in functional neuroimaging studies under baseline conditions or under other conditions of reduced activity (Raichle et al., 2001). Fast eye saccades in humans suppress activity in the occipital cortex, as evidenced from electrophysiological recordings, that is associated with a decrease in the BOLD signal (Wenzel et al., 2000). This is explained by deactivation early in visual processing, possibly at the level of the lateral geniculate nucleus (Burr et al., 1994).

Deactivation produced by functional ablation of the left frontal cortex by an episode of cortical spreading depression (CSD) produced decreased activity in the cortico-pontine-cerebellar projections and in turn reduced spiking activity in cerebellar Purkinje cells in the contralateral cerebellar cortex. a, The rat brain viewed from above. CSD was elicited in the left frontal cortex (E, right) and identified by the suppression of electrocorticographic (ECoG) activity and the concomitant rise in CBF (top two recordings). At the same time, the spontaneous spiking (red, third recording) in Crus II of the contralateral cerebellar cortex became strongly attenuated, whereas CBF in the contralateral and ipsilateral cerebellar hemisphere decreased slightly (fourth and fifth recordings). y-axis without units indicates normalized data. b, Summary figure showing decreases in spontaneous Purkinje cell spike activity and baseline cerebellar CBF in response to impaired contralateral neocortical function attributable to focal ischemia (n = 10), CSD (n = 4), and TTX (n = 4). This figure illustrates the discrepancy between the large decreases in spontaneous neuronal activity and the small decreases in baseline cerebellar CBF during deactivation. Relative changes (%) of mean spike rate (red) and cerebellar blood flow (CeBF) (blue) are shown. Adapted from Gold and Lauritzen (2002).
Deactivation may also be caused by interruption of the excitatory output from one brain region to connecting brain regions. This phenomenon, commonly known as diaschisis, has gained renewed interest from functional neuroimaging studies that revealed decreased metabolism and CBF in anatomically intact brain regions that were remote from a cerebral lesion (Baron et al., 1981; Martin and Raichle, 1983; Meneghetti et al., 1984; Price et al., 2001; Ito et al., 2002). We used decreased activity in the cortico-pontine-cerebellar projections to study the relationship between Purkinje cell spiking activity and CBF in the cerebellar cortex under conditions of deactivation (Fig. 3) (Gold and Lauritzen, 2002). A strong reduction in the afferent input caused a pronounced decrease in Purkinje cell spiking activity (by up to 70%). Unexpectedly, the relative decrease in CBF was small (16%) compared with the effect on spiking activity. This suggested that the baseline level of CBF is determined by factors that are independent of neuronal signaling.
Further evidence in favor of this idea came from experiments that used TTX to abolish all types of spontaneous and evoked signaling in which basal CBF decreased by only 10-20% (Akgoren et al., 1994; Fabricius and Lauritzen, 1994; Gold and Lauritzen, 2002). This may suggest that the dynamic range available for CBF decreases caused by deactivation is limited. The data are consistent with the idea that the baseline level of CBF is determined by neuronal processes distinct from signaling, most likely the basal glucose consumption that feeds the housekeeping activities of normal brain tissue with energy. The general relationship of baseline CBF and glucose consumption exists in each brain area. Thus, brain regions that have the greatest glucose consumption display the highest rate of CBF, and areas with a low glucose consumption such as the white matter tracts also have the lowest CBF values (Sokoloff, 1981). In addition, systemic factors such as blood pressure and arterial blood gases control baseline CBF. One implication of our findings is that baseline CBF levels are relatively insensitive to decreases in neuronal signaling. Second, the proportionality factor that describes the relationship between the amplitude of the CBF or BOLD signals and the corresponding changes in neural function may differ depending on the baseline conditions and whether neural function increases or decreases: excitatory synaptic activity is accompanied by increases in CBF or BOLD signals that are large and easily defined. In contrast, decreases in excitatory synaptic activity from baseline levels are accompanied by decreases in CBF and possibly BOLD signals that are much smaller. Therefore, we postulate that CBF or BOLD recordings underestimate the levels of neuronal deactivation when they are based on decreases in their baseline levels because small decreases may conceal a much larger decrease in neuronal activity than first assumed when the results are accepted at their face value.
Possible mechanisms that transform neural activity to increased glucose consumption and CBF
Finally, we need to consider some of the possible mechanisms that link neural activity with glucose utilization and blood flow (Kuschinsky et al., 1983; Fillenz et al., 1999; Magistretti et al., 1999; Sokoloff, 1999; Bonvento et al., 2002). Which are the active pathways? Are there key molecules? Are the mechanisms affected in disease states? These are among the many questions that follow in the wake of the work identifying the neural mechanisms that underpin the CBF and BOLD signals. Glucose consumption in the brain is believed to be coupled to glutamate transport into astrocytes that triggers glycolysis and lactate release. This is supposed to be followed by reuptake of lactate into neurons and oxidative phosphorylation (Sibson et al., 1998; Magistretti et al., 1999). Lactate release and the associated alterations of brain extracellular pH may explain the contribution of metabolism to the activity-dependent increases in CBF, in addition to the CO2 released from neurons produced by oxidation, because hydrogen ions dilate cerebral resistance vessels (Kuschinsky and Wahl, 1978). In this view there is a close relationship between astrocytic function and brain blood flow regulation (Paulson and Newman, 1987; Fillenz et al., 1999; Bonvento et al., 2002; Gjedde et al., 2002).
Stimulation of the cerebellar cortex evoked frequency-dependent decreases of extracellular pH preceded by a short phase of alkalization (Kraig et al., 1983). Interestingly, the major part of the acidic changes was blocked by ouabain, which suggested that they were caused by the release of an acid metabolite produced when the Na-K-ATPase is active. This is consistent with the idea that sodium is the electrochemical driving force for glutamate uptake into astrocytes and that increases in intracellular sodium is the stimulus for the Na-K-ATPase, and in turn glycolysis (Magistretti and Pellerin, 1999). In contrast to extracellular potassium (see below), pH decreases almost linearly during the entire stimulation period and for several seconds after the stimulus train has ended, with a direct relation to the rate, intensity, and duration of the stimulus. The time base of the pH changes and CBF differ somewhat and the initial alkalization is expected to decrease CBF (Kuschinsky and Wahl, 1978), but increased CBF was observed. Nevertheless, this scheme remains attractive because it describes a serial coupling of neural activity, metabolism, and mediator of the activity-dependent increase in CBF. However, the coupling of glucose metabolism to blood flow explains only part of the CBF rise, and other vascular messenger molecules are at work. Nitric oxide (NO) synthase inhibitors blocked ∼50% of the CBF increase in response to stimulation without affecting neuronal activity (Dirnagl et al., 1993; Akgoren et al., 1994; Irikura et al., 1994; Li and Iadecola, 1994). Further studies identified NO as a modulator, not a mediator, of the activity-dependent increases in CBF in the somatosensory cortex (Lindauer et al., 1999; Bonvento et al., 2000; Cholet et al., 2001), but in the cerebellar cortex, NO functions as the most important mediator of the CBF responses (Akgoren et al., 1996; Yang and Iadecola, 1997). This suggests that vasodilator substances involved in neurovascular coupling may differ between brain regions.
Potassium and adenosine are two other key substances that may explain the rises in CBF that are independent of NO and pH (Astrup et al., 1978; Lassen, 1991; Ko et al., 1990; Iadecola, 1993). The adenosine hypothesis is based on a putative mismatch between energy and/or oxygen consumption and substrate delivery, either by a rise in neuronal activity or a decrease in tissue perfusion-substrate delivery (Berne et al., 1983; Phillis, 1989). Our findings suggested that the CBF increase evoked by climbing fibers was dependent on NO and adenosine, whereas the rise in CBF evoked by parallel fiber stimulation was independent of adenosine release but dependent on NO and potassium (Akgoren et al., 1997). Potassium is released whenever a nerve cell is active, and there are strong theoretical arguments to support the hypothesis that this molecule could be the main mediator of increases in CBF accompanying activation (Paulson and Newman, 1987; Lassen, 1991). However, the experimental data suggest that increases in extracellular potassium explain only part of the activity-dependent increases in CBF (Astrup et al., 1978; Iadecola and Kraig, 1991; Caesar et al., 1999). Finally, certain derivatives of arachidonic acid, i.e., epoxyeicosatrienoic acid and prostacyclin, contribute to the blood flow increase during activation (Harder et al., 1998; Niwa et al., 2000a).
There is a growing clinical interest in disease models in which the coupling mechanisms between neural activity and CBF are disturbed. This is because of the large number of clinical conditions that are accompanied by disturbed coupling of neural activity and CBF/BOLD, e.g., migraine, stroke, and Alzheimer's disease (Olesen et al., 1981; Nelles et al., 1999; Rapoport, 1999). These findings can be reproduced in experimental disease models. For example in rats the coupling between neural activity, oxygen metabolism, and blood flow is disturbed for more than 1 week after 10 min of cardiac arrest (Schmitz et al., 1998), and in experimental models of migraine the coupling between neural activity and CBF is disturbed for 2 hr, which is the expected length of a migraine attack (Lacombe et al., 1992; Fabricius et al., 1995). Still other studies show that transgenic mice overexpressing peptides that play a critical role in the development of Alzheimer's disease have an attenuated increase in neocortical blood flow elicited by somatosensory activation, whereas the increase in glucose usage is preserved. This may suggest that alterations in the coupling between activity and blood flow produce a potentially deleterious mismatch between substrate delivery and energy demands imposed by neural activity (Niwa et al., 2000b; Mueggler et al., 2002). Because the increase in CBF that accompanies neural activity is believed to ensure substrate supply to the brain (oxygen, glucose) and to remove potentially harmful substances (e.g., lactate), it follows that neuronal function may become impaired, possibly damaged, if the neurovascular coupling is at fault.
Summary
In conclusion, stimulus-evoked CBF or BOLD signals reliably reflect changes in activity of the underlying neuronal networks. The amplitude of the signals probably depends on the afferent input function, i.e., all aspects of presynaptic and postsynaptic processing, but the existing data do not support the hypothesis that efferent function, i.e., the spike rate out of the same region, contributes to the activity-dependent changes of blood flow (Fig. 4). This calls into question the idea that neuroimaging signals represent functional units that communicate with one another. It is important to distinguish between effective synaptic inhibition and deactivation that increase and decrease, respectively, CBF and glucose consumption. Further work is needed to reach a better understanding of the mechanisms of the CBF and BOLD signals and the interaction between different types of neuronal circuits and activities in producing them. A key to progress may be to stimulate circuits with defined input and output functions and to target the processes in those circuits with appropriate pharmacological, genetic, and physiological tools.
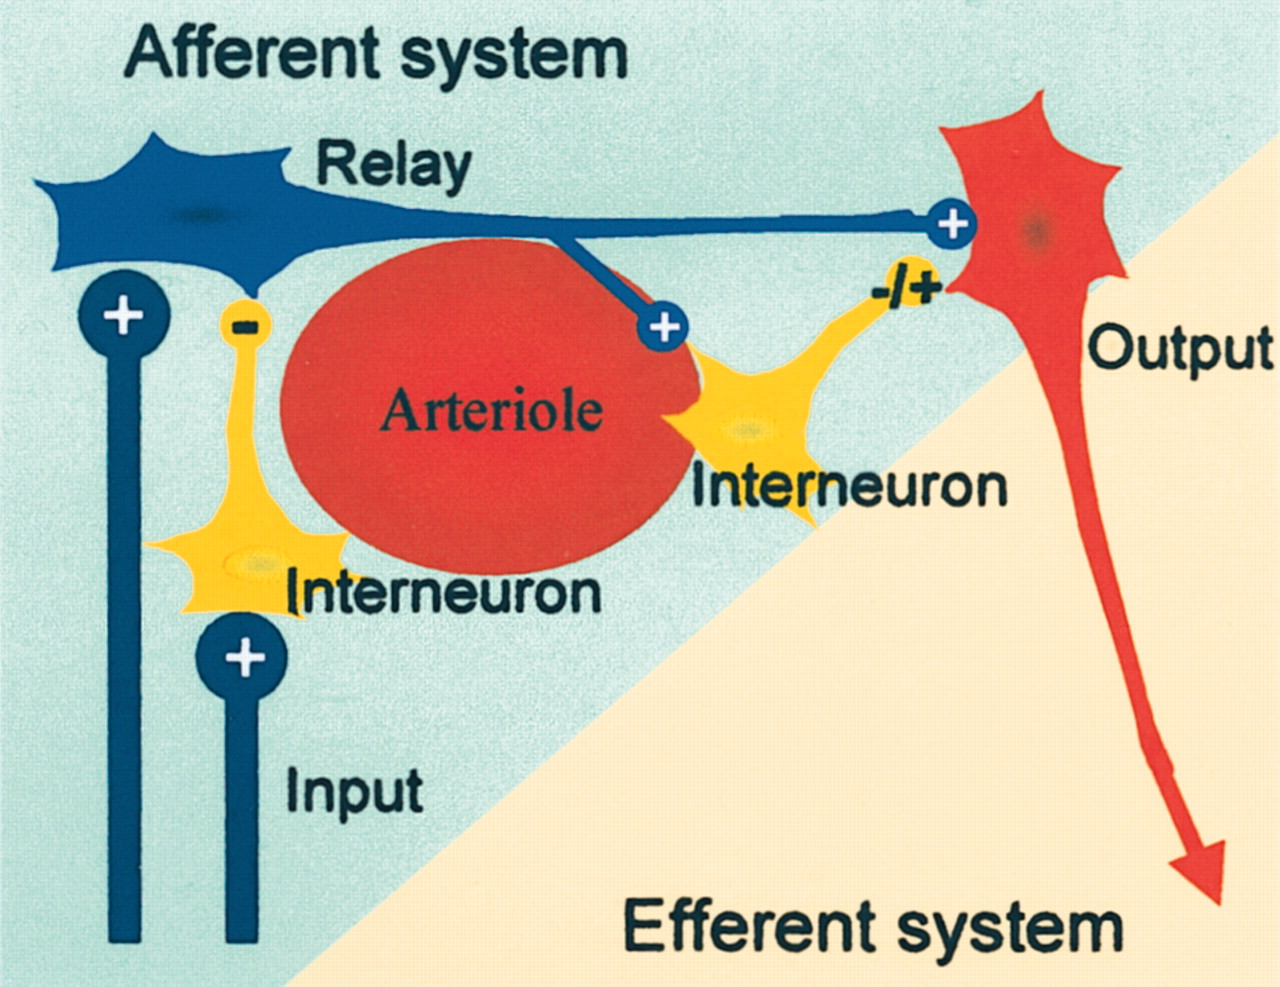
Neuronal network model thought to illustrate our working hypothesis of the neural basis of CBF and BOLD signals used in functional neuroimaging. Activity-dependent increases in BOLD or CBF are probably related to activity in the afferent input system, i.e., local excitatory and inhibitory synaptic activity in relay neurons, interneurons, and the efferent cell. Local spiking in horizontal projections of activated neurons may contribute as well, but this remains to be shown. Under most conditions increases in CBF are unrelated to spiking activity in efferent neuron. Therefore, it is not possible on the basis of a local increase in CBF (or BOLD) to decide whether the spiking activity out of an activated region is increased or decreased. Adapted from Lauritzen (2001).
Footnotes
This study was supported by NeuroScience PharmaBiotech, The Lundbeck Foundation, The Danish Medical Research Council, The Carlsberg Foundation, Brødrene Hartmann Foundation, and the NOVO-Nordisk Foundation.
Correspondence should be addressed to Dr. Martin Lauritzen, Department of Clinical Neurophysiology, Glostrup Hospital and University of Copenhagen, DK-2600 Glostrup, Denmark. E-mail: marl{at}glostruphosp.kbhamt.dk.
Copyright © 2003 Society for Neuroscience 0270-6474/03/233972-09$15.00/0


