

Abstract
Horizontal connections in area 17 of adult cats and ferrets link cells with similar preferred orientations by a patchy network of projections extending several millimeters across the cortex. The maturation of orientation selectivity in ferret area 17 has been demonstrated previously by quantitative single-unit recording and optical imaging to begin at approximately postnatal days (P) 32–P36. We therefore made restricted injections of cholera toxin B-subunit (CTB) or CTB-gold into ferret area 17 at a series of developmental ages and statistically quantified the degree of clustering in plots of retrogradely labeled cells in tangential sections through layer III for comparison to the published values for orientation tuning at each age. At P21, horizontal connections within area 17 lacked patchiness entirely, although clear patches of labeled cells were present in extrastriate areas. By P27, significant clustering of horizontal connections within area 17 was present. A second phase of cluster refinement was observed to occur at approximately P34–P36, coinciding with the emergence of mature orientation tuning and maps. Continuous silencing of cortical action potentials by chronic tetrodotoxin infusion from P21 resulted in a spatially random distribution of retrogradely labeled cells at P34. In contrast, bilateral enucleation from P21 did not prevent the initial development of clustered horizontal connections. We conclude, based on our findings and those of others, that the anatomical specificity of long-range horizontal connections results from an activity-dependent process that initially can use spontaneous activity in the cortical and thalamic networks to establish crude periodic connections and later uses visual cues to refine these connections.
- horizontal connections
- ferret
- area 17
- visual cortex
- CTB-gold
- cholera toxin
- orientation
- cortical maps
- development
A conspicuous property of the mammalian neocortex is its organization into functional columns in which cells respond preferentially to similar stimulus features (Mountcastle, 1957; Hubel and Wiesel, 1962). In the visual cortex, this functional columnar organization is reflected closely in the anatomical specificity of the inputs to a column. For example, thalamic axonal inputs to layer IV of the primary visual cortex segregate during development into eye-specific patches from an initially intermixed set of inputs guided by patterned activity in the eyes (Le Vay et al., 1978; Stryker and Harris, 1986; Antonini and Stryker, 1993). A similar degree of connectional specificity of the mature thalamocortical afferents is apparent in the segregation of thalamocortical afferents by on- and off-center type (Zahs and Stryker, 1988), and the receptive field alignment of afferent inputs to an orientation column along its preferred orientation (Tanaka, 1983; Chapman et al., 1991; Reid and Alonso, 1995; Ferster et al., 1996).
Anatomical specificity is also present among intracortical connections both within and between cortical areas (for review, see Salin and Bullier, 1995). This is perhaps best characterized in the primary visual cortex, where each cortical column is connected to a subset of its neighbors by intrinsic intracortical circuitry, primarily in the form of long-range horizontal axons that extend periodic patches of terminals across many millimeters through the gray matter (Rockland and Lund, 1982; Gilbert and Wiesel, 1983; Martin and Whitteridge, 1984;Rockland, 1985; Luhmann et al., 1986; Price, 1986). There is mounting evidence that intracortical connections in the primary visual cortices of primates and carnivores (e.g., cat and ferret) selectively connect orientation columns that prefer similar orientations (Ts’o et al., 1986; Gilbert and Wiesel, 1989; Malach et al., 1993; Weliky and Katz, 1994). This link between form and function in the adult cortex raises basic questions about the developmental sequence of events by which the link is forged.
What is the developmental relationship between the formation of patchy horizontal connections and the emergence of orientation selectivity in the cortex? There is general agreement from anatomical studies in the cat, in which the development of horizontal connections has been studied most fully, that the earliest perceptible patches in the long-range intracortical connections in primary visual cortex arise early during the second postnatal week at approximately P8–P10 (Price, 1986; Callaway and Katz, 1990; Luhmann et al., 1990; Lübke and Albus, 1992). There is considerably less agreement about what proportion of neurons in area 17 of the cat possess orientation specificity at this age, with published values ranging from 0 to 100% (Hubel and Wiesel, 1963; Pettigrew, 1974; Blakemore and Van Sluyters, 1975; Buisseret and Imbert, 1976; Fregnac and Imbert, 1978; Albus and Wolf, 1984). Single-unit recordings in kittens at this young age are beset by sluggish responses and prolonged habituation, as well as instability in the cardiovascular physiology of the anesthetized neonate, all of which can make accurate characterization of the orientation tuning of neurons extremely difficult.
In contrast, the ferret, which is born ∼3 weeks earlier in development than the cat (Linden et al., 1981), has vigorous cortical responsiveness and is physiologically much more robust at the equivalent developmental age. Under these conditions, Chapman and Stryker (1993) were able to carry out a quantitative physiological study of the developmental time course of orientation selectivity. The work presented below is a quantitative anatomical study of the development of long-range intrinsic connections in area 17 of the ferret, which makes possible a direct comparison of the anatomical and physiological data in a single species.
Another important issue for understanding the mechanisms by which connectional specificity is achieved is the contribution of visual experience and neural activity to the refinement of intracortical anatomy. Earlier studies using dark rearing (Luhmann et al., 1990), binocular lid suture (Callaway and Katz, 1991), or strabismus (Löwel and Singer, 1992) to deprive kittens of normal visual experience led to the conclusion that there was an early visual activity-independent period of crude clustering of horizontal connections followed by a later period of experience-dependent refinement of clusters (Katz and Callaway, 1991). The recent discovery, however, of waves of spontaneous electrical activity in retinal ganglion cells starting long before the period of natural eye opening (Galli and Maffei, 1988; Wong et al., 1993) raises the possibility of a rich environment of retinally driven inputs to the developing visual system, even in the complete absence of external visual stimuli. Thus, the role of activity in the initial emergence of clustered connections was not explored adequately by the early experiments. This study tests directly whether the initial emergence of crude clusters in the intracortical connections can occur without cortical action potentials and whether spontaneous retinal ganglion cell activity accounts for the crude refinement that occurs in the absence of visual experience.
Some of the results presented here have been published previously in preliminary form (Ruthazer and Stryker, 1994).
MATERIALS AND METHODS
Injection of tracer. Thirty black-point sable ferrets (Marshall Farms, New Rose, NY) were used for this study. Animals were anesthetized by inhalation of halothane (0.5–5.0%) in a 2:1 nitrous oxide/oxygen mixture and placed in a stereotaxic head holder. An appropriate level of anesthesia was maintained by regular monitoring of heart rate, respiratory rate, and the absence of withdrawal to paw pinch. In addition, atropine and antibiotic (Baytril enrofloxacin 2.27%) were injected subcutaneously (2.5–5.0 mg/kg). Body temperature was monitored using a rectal thermometer and maintained at a normal level using a water-circulating heating pad. The eyes were protected by artificial tears (Lacrilube). Under sterile conditions, a midline incision was made in the scalp, and a unilateral or bilateral flap of skull was drilled to expose the lateral occipital cortex back to the tentorium. A small slit was cut in the dura at the caudal pole 5–10 mm lateral to the midline. In some cases, a recording electrode was advanced into the cortex in the vicinity of the intended injection site to record spontaneous and visually evoked activity. A thick-walled (1.0 mm outer diameter; 0.25 mm inner diameter) glass micropipette, pulled and broken to a tip diameter of ∼25–30 μm, was filled with 1% cholera toxin B-subunit (CTB) (List Biological Labs, Campbell, CA) or 0.9% CTB-gold (BGOLD7, List Biological Labs). A Narashige micromanipulator was used to advance the micropipette at an angle approximately perpendicular to the pial surface into the caudal pole of the cortex until it broke through the elastic pia mater into the cortex (typically at a depth of 800 μm) and was then retracted to a depth of 500–400 μm. Over the course of 10 min, 100 nl of tracer (measured by observing a 2 mm advance of the meniscus in the pipette using a 40× Wild surgical microscope with eyepiece reticle) was injected manually using air pressure from a syringe with a quick-release valve connected by polyethylene tubing to the micropipette. In the case of bilateral injections, efforts were made to place the injections at different mediolateral levels in each hemisphere to avoid callosal contamination of the labeling pattern. After the injection, the pipette was retracted, the skull flap was replaced, and the fascia and skin were each sutured back together at the midline. Subcutaneous 2.5% dextrose-lactated Ringer’s solution (10–20 ml/kg) was administered to aid postoperative recovery.
Unless indicated otherwise, all ages given in the text indicate the age of the ferret kit at the time of injection. This is a standard practice for retrograde tracers, because most of the tracer uptake is believed to occur shortly after injection. In this study, perfusion generally was performed 2 d after injection, because longer survival times did not seem to improve the quality of labeling.
Cortical infusion cannula implantation. Cannulae attached to osmotic minipumps (model 2002, Alza Corp., Palo Alto, CA) delivering tetrodotoxin (TTX) (Calbiochem, La Jolla, CA) or saline control solution to the visual cortex were implanted according to the procedure of Chapman and Stryker (1993), except that because the infusion period was only 2 weeks, it was not necessary to replace the minipumps.
In brief, under sterile surgical conditions as described above, the skull was exposed, and cannulae, made by modifying 30 gauge needles attached to Alzet osmotic minipumps containing 1.0 or 2.5 μM TTX in saline, were inserted through the uncalcified skulls of P21 ferret kits at an acute angle in a rostral to caudal direction. The cannulae were held in place by a mass of dental cement and two mooring pins angled acutely in the direction opposite to the cannula. After the minipumps were placed into a saline-filled pocket between the scapulae, the fascia and skin were sutured over the entire cannula mass.
Bilateral enucleation. P21 ferret kits were anesthetized with halothane (0.5–5.0%) in a 2:1 nitrous oxide/oxygen mixture. For each eye, the eyelids were spread open and the conjunctiva was blunt-dissected from the sclera of the eye. Oculomotor muscles were located using a small blunt hook and cut at the attachment points to the sclera. The optic nerve was then clamped with a hemostat and cut proximal to the eye, which was then extracted. Antibiotic ophthalmic ointment (Chloroptic) was applied to fill the gap left by the extracted eye. The lid margins were then cut to allow the lids to regrow together and sutured shut with a single mattress stitch of 4-0 polyglactin suture (Vicryl). Antibiotic (Baytril enrofloxacin 2.27%, 2.5–5.0 mg/kg) was administered subcutaneously.
All surgeries and procedures on animals were performed with the approval of the University of California, San Francisco Committee on Animal Research.
Unfolding, sectioning, and processing of cortical tissue.Approximately 48–72 h after tracer injection, ferrets were anesthetized deeply by intraperitoneal barbiturate (Nembutal) injection and perfused transcardially with 0.1 m phosphate buffer followed by 4% paraformaldehyde in 0.1 m phosphate buffer using a butterfly catheter and 35 ml syringe or motorized peristaltic pump. The brain was then removed from the skull, and the cerebral cortices were gently separated from the rest of the brain at the internal capsule and parahippocampal gyrus. A coronal incision bisected the cortex just anterior to the caudal edge of the suprasylvian sulcus, and a sagittal relieving cut split the splenial gyrus up to the dorsal crest of the posterior lateral gyrus. Pia was peeled from the splenial, lateral, and suprasylvian sulci, and the white matter was stripped from the inner surface of the occipital cortex. The unfolded cortex was then laid on a glass slide so that as much of the pial surface as possible made direct contact with the glass. A second glass slide separated from the first slide by a pair of 1.3 mm spacers was clamped against the white matter side of the unfolded cortex to keep it from peeling off the first slide during overnight post-fixation and cryoprotection in 4% paraformaldehyde with 30% sucrose.
After post-fixation, the unfolded cortex was frozen, flat pial surface upward, onto a frozen mound of 30% sucrose in phosphate buffer on a freezing microtome stage. The angle of the stage was adjusted so that the flat pial surface was parallel to the blade. Forty micrometer sections were collected in phosphate buffer. Alternate sections were either Nissl-stained or reacted for cytochrome oxidase by the method ofHorton (1984) and either immunostained (for CTB) by the method of Luppi et al. (1987) or silver-intensified (for CTB-gold) (Amersham IntenS EM kit, Amersham, Arlington Heights, IL; 2 × 20 min). Tissue was permeabilized before immunostaining or silver intensification by 30 min incubation in 50% ethanol and washed with distilled water (3 × 15 min) before silver intensification. After intensification, the reaction was fixed by a 5 min incubation in 2.5% sodium thiosulphate and washed in distilled water (3 × 15 min). CTB-gold sections were mounted on autoradiography grade subbed slides (Fisher Superfrost plus; Fisher Scientific, Houston, TX), air-dried overnight, cleared in graded alcohols and xylenes, and coverslipped with DPX mountant (Gurr) for viewing under dark-field optics.
Quantitative analysis. In every case, either the seventh, eighth, or ninth section below the pia (280–360 μm depth, uncorrected for tissue shrinkage) was selected to reconstruct the distribution of labeled neurons using Neurolucida plotting software (MicroBrightField Inc.) with an Optronix TEC-470 video camera at 20× magnification (10× air objective and 2× video relay lens) and a fiber optic dark-field illuminator (Micro Video Instruments, Avon, MA). For the analyses in this paper, only clearly labeled cells with classic neuronal morphology (i.e., dendritic branches and a large distinct nucleus) were included. Although these criteria lead to slight underestimates in the actual number of labeled neurons, spatial statistics are more accurate with a large subset of the total population than they are with a set that includes many false positives. Data were saved as ASCII lists of (x, y) coordinates of labeled cell somata in micrometers relative to the injection site center (sample plot in Fig. 1A). Experiments were excluded from analysis if the injection site was seen to invade the white matter or if excessive subpial spread of tracer resulted in cells being labeled from their apical dendrites.

Methodology and description of the Cluster Index (CI). A, Example plot (from section in Fig. 5A) of labeled cells used to calculate the CI. Thedashed line surrounding the cells and the circleof radius 500 μm around the injection site center indicate the borders of the region-of-interest used for the calculation in this case. Scale bar, 1 mm. B, Schematic illustration ofw, the cell-to-cell nearest-neighbor distance, andx, the random point-to-cell nearest-neighbor distance for a subset of cells from A. Triangles represent cells in the data set, and the circle represents a random point in the region-of-interest. (Actual analysis was performed using 1 × 1 mm windows.) See Materials and Methods for details. C, Histogram (bin size = 0.05) of CI measurements made on 10,000 pseudorandom sets of 100 “cells” is a Gaussian distribution with CI ≤ 0.70 for 95% and CI ≤ 1.10 for 99% of cases.
The Cluster Index (CI), used to quantify clustering in the cell plots, is derived from Hopkins’ statistic for spatial randomness (Hopkins, 1954; Ripley, 1981). This statistic is based on two basic measurements: (1) the nearest-neighbor distance between the points in the data set (defined as w) and (2) the distance between a randomly selected location in the field and the point from the data set closest to it (defined as x) (Fig. 1B). Hopkins’ statistic is defined simply as: Σ(x2)/Σ(w2). Because this is a ratio, ranging from 0 to ∞, it is mathematically simpler to deal with the log of this statistic, the distribution of which is very nearly Gaussian (Fig. 1C). For the analysis in this paper, the following procedure was applied to derive CI values. (1) A region-of-interest was drawn tightly around the data set to eliminate edge artifacts and to exclude patches in area 18 from the analysis; (2) a circle of radius 500 μm centered at the injection site was excluded from the region-of-interest to exclude local short-range circuitry from the analysis (Fig. 1A); (3) an analysis window of 1 mm2 was swept across the region-of-interest in 100 μm steps to produce a value for Hopkins’ statistic at each window position, deriving x for a random subset (10%) of the total population and w for the same cells, but using 100% of the cells in the window to determine nearest-neighbor distances to preserve adequate statistical independence in the nearest neighbor measurements. This was repeated ten times and averaged for each step. (4) The median value of log[Σ(x2)/Σ(w2)] for all of the positions of the analysis window is taken as the CI for the entire section. Because Hopkins’ statistic is highly sensitive to any clustering in the data set, the use of a sliding analysis window effectively constrains the CI to measure clustering within the range of spatial frequencies relevant to cortical columnar organization (peak sensitivity = 1 cycle/mm).
Density maps were made by assigning the cells in the plot of labeled cells into 100 × 100 μm bins. To measure cluster spacing, the distances between the centers of neighboring peaks as determined by local threshholding in these density maps were then measured and averaged for each reconstructed section. Density range graphs were made from the density maps by recording the maximum density value in each 100 μm circular annulus expanding from the injection site center. These values were then averaged across individuals within each age category. Estimates of linear cortical growth were made by measuring the distance along the anteroposterior axis from the caudal pole of the visual cortex to the caudal-most point in the suprasylvian sulcus in camera lucida drawings of the brain made immediately after perfusion and before flattening. All image analysis was performed using software written in the IDL graphics language on a DEC Alpha workstation.
RESULTS
Distribution of label from focal injections in area 17
The development of long-range intrinsic connections in ferret area 17 was examined by making small injections into area 17 of either CTB (Luppi et al., 1987) or CTB-gold (Llewellyn-Smith et al., 1990; Kritzer and Goldman-Rakic, 1995) (Fig. 2). CTB-gold is a highly selective retrograde tracer that labels cells by forming particulate aggregates in cell somata (Fig.3A), much like fluorescent latex microspheres (Katz et al., 1984) or wheat germ agglutinin-apo-horseradish peroxidase-gold (WGA-apo-HRP-gold) (Basbaum and Menétrey, 1984), although rare axonal filling was observed occasionally, particularly in the youngest (P21) animals in this study. CTB-gold proved particularly useful for mapping cortical microcircuitry because of its high sensitivity and low diffusibility, which permitted small volumes (≤100 nl) to be pressure-injected into the cortex, with very little lateral spread and no detectable tissue disruption. Tracking of the CTB-gold along the injection pipette typically deposited a thin plug of tracer <100 μm in diameter that extended from just below the injection depth up to the pial surface (Figs. 2A, C,3B). To ensure that the most distant labeled cells were visible, the silver-intensification reaction was run under conditions that produced a dense precipitate in a 100- to 700-μm-diameter region surrounding the injection site. This dense precipitate is attributable to silver grains deposited early in the reaction serving as nucleation sites as the reaction proceeds, producing a highly amplified signal from CTB-gold-labeled neurons at great distances, at the expense of a relatively intense deposition of silver precipitate near the injection site. A halo of intensely labeled local-projection neurons and glia extends ∼500 μm from the injection center and is visible outside the dense core of precipitate (Figs. 2B,3D). The size of the actual injection site in relation to the region of dense silver precipitate and the halo of local-projection neurons is evident in Figure 3D, which shows a contrast-reversed image of the unprocessed injection site (Fig.3B) from an adjacent section superimposed at scale on the silver-intensified section.

Parasagittal sections through the LGN and the occipital pole of a CTB-gold-injected adult ferret cortex.B, Dark-field image of a silver-enhanced section shows the dense precipitate around the injection site core, surrounding halo of glia, and short-range circuit neurons. Immediately adjacent cytochrome oxidase (CO) (A) and Nissl-stained (C) sections reveal the appearance of the CTB-gold injection without silver intensification. The large arrow indicates the area 17/18 border determined by the pattern of CO, Nissl, and CTB-gold staining. There is a patch of labeled cells in area 18 in B. D, Silver-intensified dark-field section 1.2 mm lateral to the injection site in B. Patches of retrogradely labeled neurons (small arrows) are clearest in the deep part of layer II/III. E, Silver-enhanced LGN section from the same animal shows a column of labeled neurons that spans all layers of the LGN but is fainter in the C laminae, characteristic of labeling from area 17. F, Dorsal view of a ferret brain indicates the location of the injection site, which was typical for this study, and the planes of section for panels A–D. The shaded regionindicates area 17. A–E, Dorsal is up; anterior is left. Scale bar, 500 μm. F, Anterior isup. Scale bar, 5 mm. In this and all of the following figures, each scale bar applies to the frame it occupies and to all preceding frames without scale bars.

A, CTB-gold-labeled cells from the section shown in D at high magnification in dark field.B, An injection site that has not been silver-intensified from a section immediately above that shown in D. The bulk of the injection is extremely well restricted and much smaller than the region of dark precipitate present after silver intensification. For comparison of scale, a reverse-contrast image of the unreacted injection site is shown at scale in D. C–G, Depth series in adult ferret visual cortex flat-mount viewed in dark field (with bright-field injection site included for reference). Depths (uncorrected for tissue shrinkage) are (C) 120 μm, (D) 280 μm, (E) 520 μm, (F) 680 μm, and (G) 840 μm. The dashed lineindicates the approximate area 17/18 border. Several clusters in a section from lower layer II/III (D) are indicated byarrowheads. Note the correspondence of clusters in all layers with compression in the rostrocaudal axis with depth. The CI value for this case (D) was 1.31. In these and all of the following photographs, the dark deposit of silver precipitate around the injection site has been photographed in bright field and photomontaged onto the dark-field image. This more accurately reproduces the actual appearance to the eye of the intensified injection site, which saturates in photographs because of the limited dynamic range of the film. Rostral is up; lateral isleft. Scale bars: C–G, 1 mm; A, 20 μm; B, 100 μm.
Beyond the halo of local-projection cells, clusters of labeled neuronal somata were found consistently, both in area 17 (Fig. 2B, D) and in numerous extrastriate areas, with particularly dense labeling in area 18 (Fig. 2B), as well as more rostral visual areas including the lateral suprasylvian visual area (data not shown). Several subcortical structures were labeled from area 17, most prominently a single column of cells spanning both magnocellular and parvocellular laminae of the lateral geniculate nucleus (LGN) (Fig. 2E), cells in the medial interlaminar nucleus, large neurons in the lateral posterior and central lateral nuclei of the thalamus, and a broad, densely labeled group of cells in the claustrum.
Normal development of patchy long-range connections within area 17
Adult pattern of connections
Labeled cells within area 17 of adult ferrets (n = 4) were located in all layers but were especially dense in layers III and VI and sparse in layer IV and upper layer V (Fig.2D). Cells in the supragranular layers in area 17 in adult cortices were labeled as far as 5 mm from the center of the injection site, with a mean distance of 3490 ± 1410 μm (SD,n = 3) to the farthest group of labeled cells. A marked anisotropy in the distribution of labeled cells within area 17 was observed at all ages, with 88% (22/25) of injections in normal animals resulting in cells being labeled at a greater distance parallel to the 17/18 border than perpendicular to it. The length from the center of the injection site to the most distant detectable groups of labeled neurons was an average of 69.5% greater in the mediolateral directions (65.9% greater laterally and 40.1% greater medially, measured along the 17/18 border) than in the caudal direction (measured perpendicular to the border). The presence of the border several millimeters anterior to the injection site prevented this comparison for the rostral direction. This is consistent with findings in the cat where the extent of labeling is also longer along the axis of the 17/18 border (Gilbert and Wiesel, 1989; Luhmann et al., 1990; Callaway and Katz, 1990).
Labeled cells formed distinct patches in radial alignment across the cortical layers, which was evident most readily in tangential sections through unfolded, flattened visual cortex (Fig. 3C–G). The mean intercluster distance in flattened adult cortices was 698 ± 75 μm (SD, n = 3). The subjective appearance of clustering in a distribution of points can often be misleading with respect to its true spatial statistics, because human vision is prone to seeing patterns even in random distributions. To quantitate and compare the degree of clustering in the distributions of labeled cells at all ages, cell positions were plotted using a microscope with a video camera lucida (example shown in Fig. 1A), and Hopkins’ spatial statistic for randomness was adapted to generate a CI for every flattened hemisphere (described in Materials and Methods). Negative CI values reflect spatial regularity in a distribution of points; CI values near zero indicate random distributions; and positive CI values indicate clustered sets, with higher CI values corresponding to decreasing probabilities of randomness. The mean CI for distributions of cells in the three flattened adult cortices was 1.24 ± 0.06 (SD), indicating highly significant clustering (p < 0.001; Monte Carlo test).
This study focused mainly on the development of intracortical connections in the lower supragranular layers of area 17 at depths of 280–360 μm, where lateral intrinsic connections showed the highest degree of patchiness. The topology of the occipital cortex of the ferret also makes the upper layers more amenable to the study of lateral organization than the deep layers. The caudal pole of the posterior lateral gyrus of the ferret comes to an acute angle as sharp as 35° at some positions, resulting in a distention of radial columns along the anteroposterior (AP) axis in the upper layers and a comparable compression in the deep layers. Consequently, at the caudal pole it is easier than normal to detect the presence of discrete clusters of labeled cells in the upper layers and more difficult in the deep layers. As illustrated in Figure 3C–G, there was good correspondence of the patches across all layers along the mediolateral (ML) axis, despite an increasingly compressed appearance along the AP axis with increasing depth. Injection at sites more anterior would have reduced this asymmetry, but would have increased the risk that injections invade area 18.
Horizontal connections are diffuse and random at P21
The youngest age examined in this study was P21, which is when nearly all of the upper layer cortical neurons have recently completed their migration into the cortical plate (Jackson et al., 1989). At P21, few cells in the supragranular layers of area 17 were found to have long-range horizontal connections (defined for this study as neurons labeled >500 μm from the injection site center), and very few labeled cells within area 17 were found further than 2 mm from the injection site. There were no demonstrable clusters of labeled cells in area 17 at this age, although multiple discrete groups of labeled feedback projection neurons in extrastriate visual areas were already apparent (Fig. 4A, C). These early extrastriate patches most likely reflect retinotopic discontinuities in those areas, as observed in the cat by electrophysiological recording (Albus and Beckmann, 1980; Sherk and Mulligan, 1993) and as inferred from the topography of interhemispheric and associational connections in adults (Sanides and Albus, 1980; Sherk, 1986; Olavarria and Van Sluyters, 1995). The distribution of labeled cells within area 17 suggests that at P21 horizontally projecting axons of layer II/III neurons were still quite immature, and that most of these axons had not yet extended far enough to be distinguished from local short-range connections or were so poorly arborized that they failed to extend a branch into the injection site. Injections on P21 (perfused P23) of CTB, which fills dendrites and axons of labeled cells, confirmed that only a small number of retrogradely labeled neurons could be found in upper cortical layers, and that the majority of labeled axons were short (Fig. 4F). Consistent with reports that subplate neurons extend a projection into the overlying cortex (Friauf et al., 1990; Herrmann et al., 1994; Galuske and Singer, 1996), a large number of neurons, presumably the interstitial cells described byRockland (1985), were retrogradely labeled across a relatively broad region in the deep layers of the cortex and in the white matter (Fig.4D, E). They were also completely unclustered in area 17.

Cortical flat-mounts from ferrets injected on P21 and perfused on P23 reveal the absence of patchy connections within area 17. The dashed line indicates the approximate area 17/18 border. A, C, Two examples of supragranular labeling at P21 (A, CI = 0.41; C, CI = −0.25). The density and range of labeled cells is lower than that in older animals within area 17, although the corticocortical projections from area 18 are densely labeled and clustered. B, Deeper section from 320 μm below the section shown in A also reveals the absence of patchiness in the horizontal connections. The finger of label extending laterally from the injection site is attributable to flattening artifact where the section passes through more widespread label in the upper layers. D, CTB-immunostained section through white matter demonstrates the dense concentration of labeled subplate cells at this age, just beneath a CTB injection site.E, Blowup of the white square in D. F, CTB-immunostained upper layer section shows short axonal fibers and very few cells labeled from a large CTB injection site. Orientation as in Figure 3. Scale bars: A–D, 1 mm; E, F, 50 μm.
The mean CI value for CTB-gold injections in P21–P24 ferrets was 0.34 ± 0.49 (SD, n = 4), indicating that on average the distribution of labeled cells in this age group was not significantly more clustered than a random distribution of cells (t test, p > 0.1). One of the P24 ferrets, however, did have a CI value that indicated significant clustering at the p = 0.05, but not the p = 0.01, significance level (Monte Carlo test).
Clustered connections are apparent by P27
Clusters of labeled cells were clearly evident in P27 cortex, despite the fact that eye opening had not yet occurred in any of these ferret kits (Fig. 5). This clustering tended to take the form of fingers extending outward from the halo of local diffuse label, although there were also quite a few discrete patches. The mean CI value for injections in ferrets at P27–P28 was 0.97 ± 0.10 (SD,n = 6). Although the CI for these animals had not yet attained the fully mature level, it provides statistical support for the strong subjective perception of clustering at this early age (t test, p < 0.0001). In addition to having developed into clusters during this period, the horizontal connections also increased their range and density considerably (Fig.6A). By P27, the mean maximum distance from the injection site at which groups of cells in area 17 were labeled had reached 3660 ± 695 μm (SD, n = 5) parallel to the 17/18 border and 2470 ± 829 μm perpendicular to the border, comparable to adult values, although most patches had not yet achieved mature labeling density.

Examples of P27 (A–C) and P28 (D) CTB-gold labeling in tangential sections through lower layer II/III viewed in dark field. Clusters of labeled cells (arrowheads) are clearly evident at this age. CI values are (A) 0.78, (B) 1.06, (C) 1.02, and (D) 0.97. The dashed line indicates the approximate area 17/18 border. Rostral is up; lateral isleft. Scale bar, 1 mm.

Peak density of labeled cells as a function of distance from the center of the injection site. A, Progressive increase in peak density with age up to P33 reflects the emergence of dense clusters of labeled cells. Changes after P33 presumably involve the retraction of inappropriate projections outside clusters and are therefore not reflected in measurements of peak (cluster) density. B, Density distribution of BE cortices resembles that of age-matched normals. TTX-treated cortices have below-normal density near the injection site, reflecting the lack of clusters, and above-normal density at distances >2000 μm, beyond the range of many horizontally projecting cells in normal animals. Error bars represent SEM. See Materials and Methods section for details.
The pattern of cells labeled by intrinsic long-range connections at P33–P34 (Fig. 7) had a patchiness (CI = 0.94 ± 0.22, SD, n = 5) and range roughly similar to that at P27, although in general cells within clusters were more intensely labeled in the older cortices, giving the impression of increased clustering. There was also a notable rise in the peak density of labeled cells in clusters during this period (Fig.6A), indicative of either an increase in the specificity of connections or a general increase in axonal arbor complexity, with a corresponding increased probability of tracer uptake. In fact, from P27 until approximately P34, the CI remained at a plateau averaging 0.96 ± 0.16 (SD, n = 11), lending support for the latter conclusion that intrinsic corticocortical axons were adding axonal branches, both within clusters and outside clusters, without greatly improving their moderate target specificity.

Examples of P33 (A, C) and P34 (B, D) CTB-gold labeling in tangential sections through lower layer II/III in dark field. CI values are (A) 0.82, (B) 1.11, (C) 1.25, and (D) 0.76. Thedashed line indicates the approximate area 17/18 border. Orientation and scale bars as in Figure 5.
Rapid transition to mature specificity occurs at approximately P36
At approximately P36 there was a rapid increase in the CI to 1.52 ± 0.099 (SD, n = 2). It remained at this level at least up to P41, the oldest group of ferret kits included in this study (CI = 1.52 ± 0.23, SD, n = 4). This increase in the CI was not accompanied by an increase in the mean peak density of labeled cells compared with P33–P34 levels (Fig.6A), suggesting that the significant refinement of clusters at this age was attributable at least in part to a pruning of mistargeted axons. In contrast to the lattice-like appearance of most earlier clusters, many of the clusters of labeled cells at this age were discrete patches surrounded on all sides by labeled-cell-sparse territory (Fig. 8).

Examples of P38 (A) and P41 (B, C) CTB-gold labeling in tangential sections through lower layer II/III in dark field. CI values are (A) 1.53, (B) 1.82, and (C) 1.29. The dashed line indicates the approximate area 17/18 border. Orientation and scale bars as in Figure5.
It is notable that this transition age very closely matches the period when single-unit orientation tuning and orientation maps derived by optical imaging rapidly mature to adult-like selectivity in the ferret. To illustrate this point, in Figure 9 the median orientation selectivity index values from single-unit electrophysiology experiments by Chapman and Stryker (1993) and the mean orientation tuning strength from chronic optical imaging experiments by Chapman et al. (1996) are plotted alongside the mean CI values for the range of ages described in this study. Two features are strikingly evident in this plot. First, horizontal connections become moderately but significantly clustered by P27, nearly a week before both the appearance of mature orientation selectivity in single-unit responses and the earliest orientation maps detectable by optical imaging at approximately P32–P36. Second, the period of late refinement of horizontal connections corresponds well to the period of rapid maturation of orientation selectivity and the onset of orientation tuning in optical maps.

Line graph of mean Cluster Index (CI) values from this study (squares), median Orientation Selectivity Index (OSI) values from single-unit recording (Chapman and Stryker, 1993) (circles), and mean orientation tuning from optical maps (Chapman et al., 1996) (triangles) in ferret area 17 as a function of age. At P27 horizontal connections are significantly clustered, but single-unit recordings reveal poor orientation selectivity (∼25% of cells have orientation-selective responses), and optical imaging does not yet show an orientation map. Between P32 and P36, a secondary refinement of horizontal connections occurs along with the maturation of single-unit orientation selectivity and the emergence of the earliest optical orientation maps. Data are pooled across animals by age. CI, OSI, and optical tuning axes were aligned by setting equal the values for a random distribution of cells (CI = 0), the absence of an optical orientation map (P31 case), and the 90th percentile OSI (OSI = 15) of adult ferret LGN cells, which are not tuned for orientation, and by scaling the axes to set equal the CL, OSI, and optical tuning values in mature animals. Error bars represent SEM.
Role of neuronal activity in the early specificity of horizontal connections
Horizontal connections in mature cats and ferrets have been demonstrated to link cortical columns with similar orientation preferences (Gilbert and Wiesel, 1989; Weliky and Katz, 1994). The presence of patches in the pattern of long-range intrinsic connections in area 17 before the development of mature orientation selectivity in the single-unit responses raised the question of whether the initial emergence of patchy connections during this early period might occur in an activity-independent manner, as has been demonstrated for many early axonal targeting events (for review, see Goodman and Shatz, 1993). To test this hypothesis, the sodium channel blocker TTX was infused into the visual cortex of three ferret kits to silence cortical neurons for 2 weeks starting at P21, when intracortical connections have not yet begun to form patches. At P34, an age when the clustering of horizontal connections is easily detectable in normal ferrets, CTB-gold injections were made into the TTX-treated cortex and contralateral control hemisphere. Ferrets were then returned to their cages to allow transport of the tracer for 2 d, with the cannula continuing to deliver drug. At the time of injection, recordings were made in the TTX-treated and control hemispheres that confirmed the unilateral silencing of action potentials by TTX in all cases reported here.
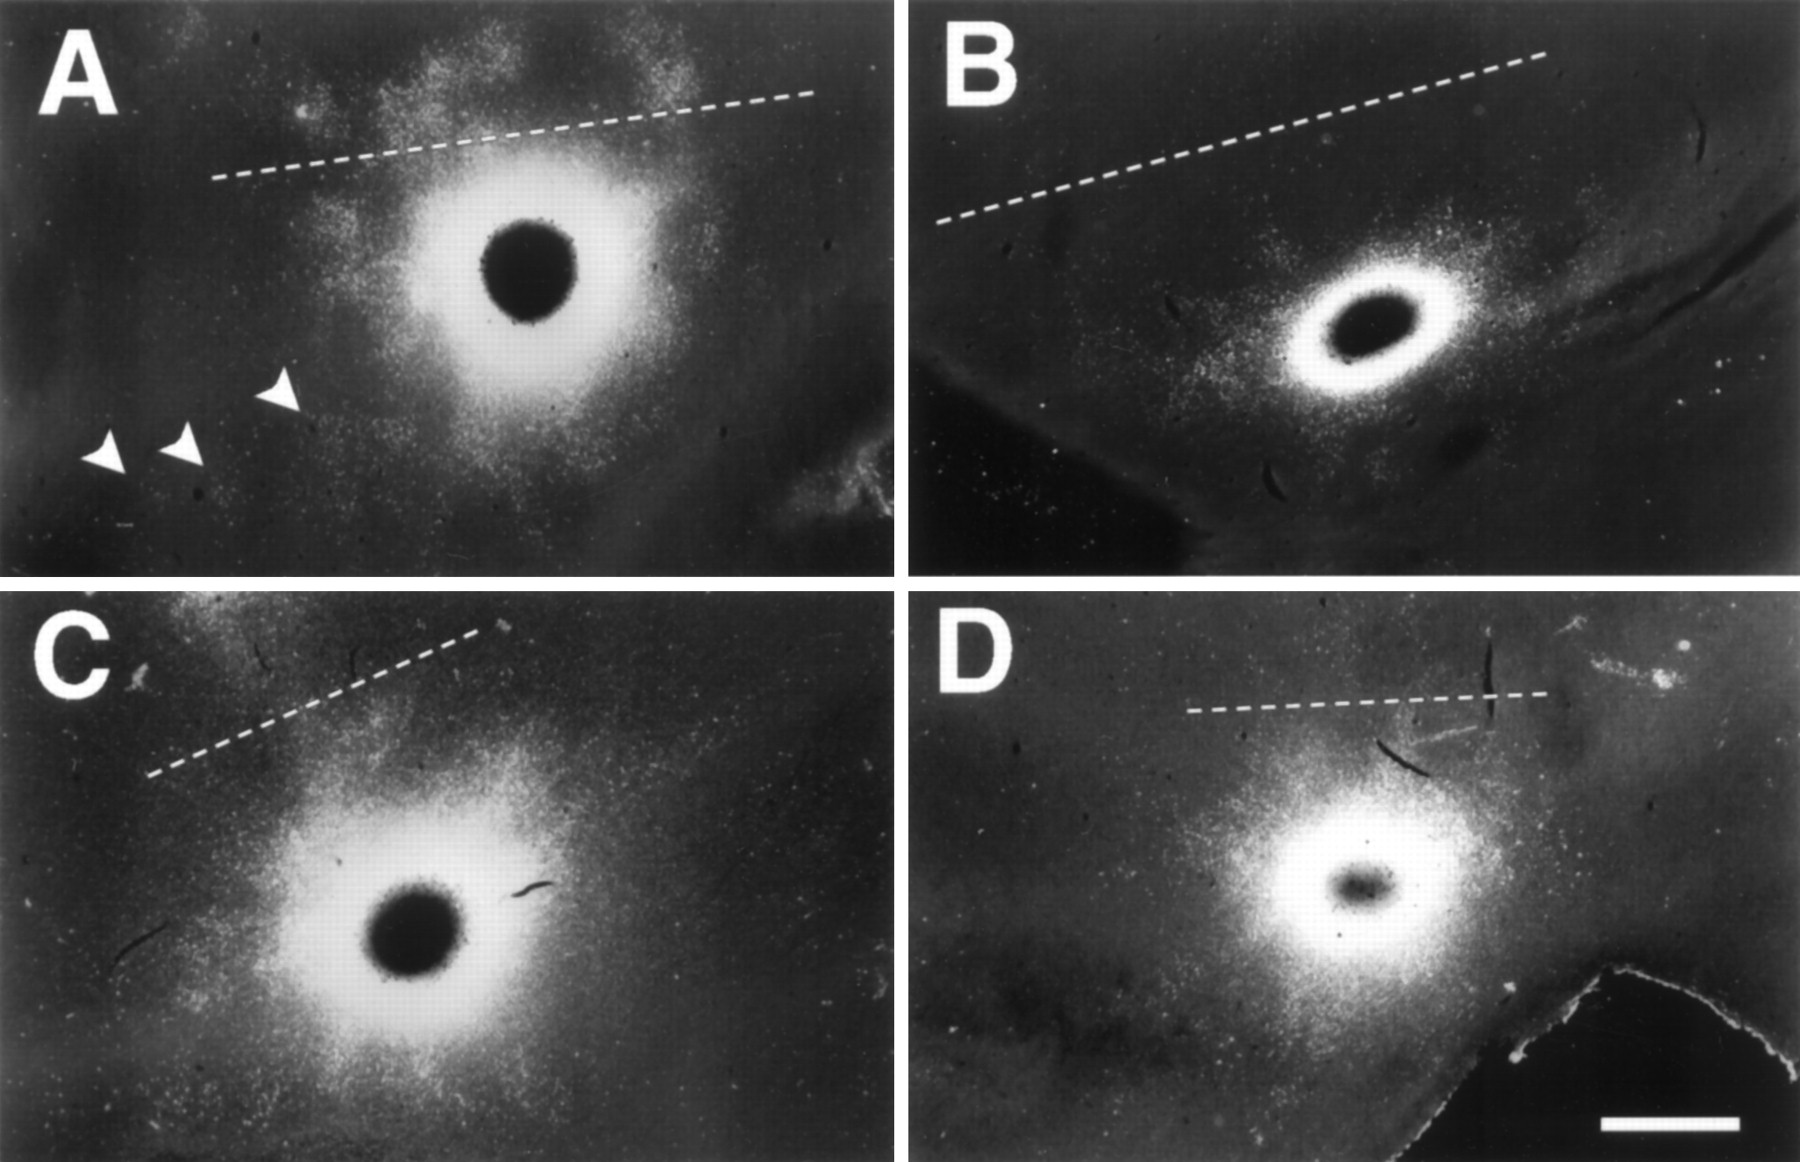
In the TTX-treated regions, CTB-gold labeled cells were found widely distributed surrounding the injection site, with no evident clustering (Fig. 10). In these animals the mean CI value was 0.12 ± 0.03 (SD, n = 3), indicating a high degree of randomness in the distribution of labeled cells (Fig.11). In addition to lacking columnar specificity, the distribution of labeled neurons in TTX-treated cortex covered a broader tangential range than that in saline-infused or untreated age-matched controls. The most distant labeled cells in TTX-treated area 17 were on average 31 and 10% further from the injection site center in the AP and ML directions, respectively, compared with controls. There was also a considerable reduction in TTX cortices of the anisotropy along the 17/18 border to just a 3.4% greater projection range along the border than perpendicular to it. These results are consistent with findings in other systems that activity blockade can result in increased axonal sprouting (for review, see Neely and Nicholls, 1995). The increase in projection range, however, is not a simple consequence of widespread sprouting on top of a normal distribution of cells, which would be expected to result in an increase in the peak density of labeled cells. On the contrary, within 2 mm of the injection site the peak density of labeled cells in silenced cortex was considerably less than in age-matched control animals (Fig. 6B). The developmental increase in the density of the projection from cells in clusters, which occurs in normal animals between P21 and P34, did not take place in the TTX-treated animals. This more wide-ranging, but less dense, distribution of labeled neurons suggests that intracortical axons growing in electrically silent cortex probably have longer but less richly branched arbors that lack columnar specificity.

TTX infusion from P21 until perfusion at P36 prevents clustering of horizontal connections labeled by CTB-gold injection at P34. A, B, TTX-treated cortices. C, Saline-infused control, injected P36 and perfused P38. D, Labeling from a P34 CTB-gold injection in the untreated hemisphere contralateral to B. CI values are (A) 0.08, (B) 0.14, (C) 1.45, and (D) 0.78. Thedashed line indicates the approximate area 17/18 border. Orientation and scale bars as in Figure 5.

Comparison of CI values in normal development at P21, P34, and P41, TTX-treated cortex, saline-control cortex, and cortex from binocular enucleates (BE). TTX was infused continuously into visual cortex starting at P21, and an injection of CTB-gold was made at P34. Saline controls were treated identically except that the CTB-gold injection was made at P36. BEs were performed on P21, and animals were injected at P34. Error bars represent SEM.
Role of visual experience on early refinement of horizontal connections
Because the initial segregation of horizontal connections occurs by an activity-dependent mechanism, the early patchiness in the horizontal projections probably reflects an underlying correlation structure in the pattern of activity across the immature cortex. Waves of spontaneous activity in retinal ganglion cells have been observed in ferrets at approximately this age, subsiding some time after P21 and before P30 (Wong et al., 1993). These waves could result in correlated activity across long distances in the cortex (von der Malsburg, 1993). To assess the contribution of retinal activity to the early development of cortical horizontal connections, ferret kits were binocularly enucleated (BE) at P21 (the developmental equivalent of a P0 kitten), when horizontal connections lack patchy specificity, and injected with CTB-gold at approximately P34, when the initial clustering of horizontal connections is clearly evident in normal animals.
Well defined patches of labeled cells were found in the cortices of BE ferrets (n = 5) (Fig. 12). The cluster index of BE ferrets was 0.90 ± 0.26 (SD, n = 5), not significantly different from P33–P34 normal animals (CI = 0.94 ± 0.22, SD, n = 5) (t test,p > 0.1). In other respects, including range, density, and anisotropy relative to the 17/18 border, the intracortical connections of BE ferrets also resembled those of normal animals in the stage of development when clustered horizontal connections have already begun to emerge. Mean intercluster distance in BE ferret cortices was 682 μm ± 92 μm (SD, n = 5), which was not significantly different (t test, p > 0.5) from the cluster spacing of 650 μm ± 47 μm (SD,n = 5) in similarly aged P33–P34 normals. Indeed, although intercluster spacing was quite variable between individual animals at all ages, no age group in which clusters were evident had an intercluster distance (corrected for cortical growth as described in Materials and Methods) significantly different from the normal adult spacing of 698 μm ± 75 μm (SD, n = 3) (t test, p > 0.05). Thus, concurrent retinal activity does not seem to be critical for the early phase in the development of columnar specificity of horizontal connections that occurs before the maturation of orientation selectivity.

Examples of labeling in tangential sections through lower layer II/III of ferrets enucleated binocularly at P21, receiving CTB-gold injections into area 17 on P36 (A) or P34 (B–D) and perfused 2 d later. CI values are (A) 0.72, (B) 1.10, (C) 1.05, and (D) 0.52. The dashed line indicates the approximate area 17/18 border. Orientation and scale bars as in Figure5.
DISCUSSION
Long-range horizontal connections in area 17 of the ferret begin to segregate from an initially sparse, random projection to pronounced clusters between P21 and P27, nearly a week earlier than the emergence at P32—P36 of mature orientation selectivity in single-unit recordings and of orientation maps, as demonstrated by optical imaging. These crudely clustered horizontal connections then undergo a further refinement in concert with the maturation of orientation selectivity around the end of the fifth postnatal week. The initial segregation into patchy connections requires cortical action potentials but not retinal activity, suggesting that activity patterns in the developing visual cortex have an intrinsic periodicity that shapes the early establishment of horizontal connections, which in turn may guide and stabilize the development of the orientation map.
Methodological considerations
The primary objective of this study was to describe quantitatively the emergence of specificity in the overall pattern of intracortical connectivity in relation to the developmental time course of columnar properties such as orientation selectivity. We therefore chose to make focal retrograde tracer injections rather than to fill the axons of individual neurons. The reciprocal nature of horizontal connections makes either of these approaches appropriate (Kisvarday and Eysel, 1992; Boyd and Matsubara, 1991). Because a retrograde study reveals the potential connectivity of a large number of neurons to a single cortical location rather than the potential connections made by a single cell, it is much more sensitive to small connectivity changes in the population as a whole that occur during development (Callaway and Katz, 1990) and similarly less likely to produce a bias toward any one particular cell type, such as large neurons that may be easier to impale. The pattern of retrograde labeling is also particularly well suited to statistical analysis because it can be described accurately by a small set of simple Euclidean coordinates.
The main potential source of artifact in any retrograde study is variability in the size of the tracer uptake zone. The absence of specificity in the distribution of labeled cells, especially in very young animals with less dense neuropil to impede tracer diffusion, should be interpreted cautiously. The absence of demonstrable specificity in the lateral connections at the earliest ages studied is therefore less persuasive than the finding of a highly significant projection specificity as early as P27. Nonetheless, there are additional considerations that add credence to our interpretation of the data from the youngest animals. First, the use of CTB-gold, which spreads less than most other tracers, considerably decreases the risk of artifact attributable to widespread diffusion of the tracer. Second, although it is true that the tracer did diffuse further on average in the P21 cortices than at other ages, clustered labeling was clearly present even in those older animals that had comparably large injection sites. In fact, among mature animals (P36 to adult) there was no significant correlation of CI value to injection site area (n = 10; r2 = 0.04). Third, lack of clustering in the distribution of labeled cells was never accompanied in this study by an atypically high density of labeled cells, making it unlikely that an abnormally broad tracer uptake zone could account for the lack of specificity revealed in these cases. Finally, biocytin-labeled axons from P22 ferrets in an independent study (Durack and Katz, 1996), as well as the P21/23 CTB-labeled axons in this study, were short and unbranched, consistent with the short-range, low-density retrograde labeling we report.
Comparison to development in the cat
The normal development of long-range horizontal connections in area 17 of the ferret seems to be similar to that reported in cats, although it is somewhat more rapid. For the purpose of comparing development in cats and ferrets, it is roughly accurate to consider a P21 ferret developmentally equivalent to a P0 kitten (Linden et al., 1981) and to assume that postnatal development proceeds from there at about the same rate in cats and ferrets.
There is general agreement that the earliest detectable clustering of intrinsic connections in area 17 of the cat occurs at approximately P8 (between P6 and P8, Callaway and Katz, 1990; P3–P8, Luhmann et al., 1990; P7–P11, Lübke and Albus, 1992), with strong clustering present by approximately P12 (Callaway and Katz, 1990; Lübke and Albus, 1992; Galuske and Singer, 1996). Clustering of horizontal connections in ferrets was clearly evident and statistically significant by P27. In agreement with findings in the cat of bothLübke and Albus (1992) and Callaway and Katz (1990), the periodicity and lateral range of these early clusters was essentially identical to that seen in mature ferrets, suggesting that each fully mature cluster might emerge from a single cluster that was present at P27. Callaway and Katz (1990) demonstrated this to be true in at least one case in the cat by injecting different color microspheres into the same cortical site at early and late times in development and showing that the same set of clusters was labeled at both ages.
There is less agreement in the cat literature about the time course and degree of refinement of patchy horizontal connections after the initial emergence of clusters. Data from Luhmann et al. (1990), who mostly used large injections of WGA-HRP, and from Callaway and Katz (1990, 1991), who used restricted injections of latex microspheres and reconstructions of axons filled with lucifer yellow, support a model in which the fully mature pattern of connectivity is achieved by approximately the sixth postnatal week after a secondary stage of refinement of connections involving the specific elimination of inappropriate axon collaterals. In agreement with the idea of selective retraction of inappropriate connections, Kennedy and co-workers (1994) reported labeling a transient population of widely scattered area 17 projecting neurons until approximately P19 in kittens. On the other hand, a quantitative study in which intrinsic intracortical connections in area 17 were examined by placing a small crystal of DiI in fixed brains at various developmental ages found no evidence for any secondary refinement beyond the initial emergence of clusters during the second postnatal week (Lübke and Albus, 1992).
The gradual refinement of clusters we observed in the ferret was intermediate between these findings. The transition from unclustered, random connections at P21 to a mature pattern of connectivity at approximately P41 took <3 weeks, in contrast to the 4–5 weeks reported for the cat; however, the apparent transformation of the distribution of labeled cells from a lattice-like matrix to discrete rounded patches, together with the increase in CI values from a transient plateau without an accompanying change in the density of labeled cells in clusters after P34, is consistent with selective retraction of inappropriate connections producing the late component of the refinement in the ferret.
Because the CTB-gold used for our study is more similar in nature to latex microspheres (Callway and Katz, 1990, 1991) than to WGA-HRP (Luhmann et al., 1990) or to DiI (Lübke and Albus, 1992), it is perhaps not surprising that our findings are qualitatively most consistent with the results of Callaway and Katz (1990). These conclusions, however, are supported independently by elegant experiments using laser photostimulation to map the functional inputs to layer II/III pyramidal neurons from neighboring cells in tangential slices of ferret visual cortex (Dalva and Katz, 1994). These experiments revealed mainly short-range connections between P17 and P26, exuberant, crudely patchy long-range connections between P27 and P40, and long-range discretely clustered connections in ferrets older than P40. Durack and Katz (1996) also observed an initial period of crude cluster emergence beginning at P28, followed at approximately P34 by a second phase of arbor refinement by selective retraction and elaboration of axonal branches in biocytin-labeled layer II/III cells from acute slices of ferret visual cortex.
Hebbian mechanisms in the development of intrinsic connections
A Hebbian learning rule (Stent, 1973; Changeaux and Danchin, 1976), which has been proposed to guide ocular dominance column development (von der Malsburg and Willshaw, 1976; Miller, et al., 1989) and orientation map formation (Linsker, 1986; Tanaka, 1992; von der Malsburg, 1993; Miller, 1994), might also direct the development of intracortical circuitry. The strongest experimental evidence in support of a correlation-based mechanism for the development of long-range horizontal connections is the finding in the cat that strabismus, which reduces correlation between the two eyes, causes long-range horizontal connections to segregate based on ocular dominance (Löwel and Singer, 1992).
It is reasonable therefore to propose that the refinement of horizontal connections that occurs after P34 in the ferret may be directly attributable to the developmental increase in orientation selectivity of layer II/III neurons between P32 and P35 (Fig. 9). As cells become increasingly selective for orientation, the likelihood that pairs of neurons with different preferred orientations fire simultaneously decreases considerably, leading to a pruning of exuberant connections; however, given the fact that only ∼25% of cortical neurons are orientation-selective at P27 (Chapman and Stryker, 1993) and that there is no demonstrable orientation map by optical imaging before P32 (Chapman et al., 1996), a different explanation is probably necessary to account for the early emergence of clustering evident by P27.
The observation that only crude clustering of horizontal connections is present after dark-rearing or binocular lid suture led earlier investigators to propose that the late refinement of horizontal connections is activity-dependent (Luhmann et al., 1990; Callaway and Katz, 1991). Because the initial clustering of horizontal connections occurs before eye opening and, moreover, because our finding in enucleates demonstrates that the earliest clustering is not dependent on retinal activity, simple manipulations of visual experience do not address the activity-dependence of the initial clustering of horizontal connections.
Our finding that clusters fail to segregate in cortex electrically silenced by TTX argues strongly that the early clustering of intrinsic connections is in fact dependent on the firing of action potentials in the cortex. Although we cannot exclude entirely the possibility that electrical activity in cortical neurons may be permissive rather than instructive for the early segregation of horizontal connections, this seems unlikely, because the connectivity in silenced cortex did not seem to be a degraded or frozen version of the normal pattern. Instead, a novel connectivity emerged in which axons seemed to grow beyond their normal range, without preference for one site over another, as if searching for an appropriate location at which to terminate. A similar morphology has been described for the axons of retinal ganglion cells exposed to prenatal infusion of TTX (Sretavan et al., 1988) and for thalamocortical axons after chronic binocular TTX injections (Antonini and Stryker, 1993). We therefore propose that the same putative Hebbian mechanism involved in the maturation of horizontal connections based on patterned visual experience is also in effect at earlier times before eye opening and that this Hebbian mechanism is likely to be responsible for the very earliest segregation of horizontal connections into crude clusters.
The fact that the peak density of labeled neurons in the TTX-treated cortices is lower than that of the clusters in controls excludes the possibility that TTX induced an exuberant axonal growth that masked an underlying activity-independent clustering of connections. If, however, activity blockade or some secondary effect of TTX infusion were to have the effect of diverting the machinery of axonal outgrowth from a hypothetical activity-independent clustering mode to the observed abnormal mode of nonspecific outgrowth, our interpretation above would be incorrect. The fact that in extrastriate areas clusters of labeled cells, which are already present in a crude form at P21, are somewhat degraded by TTX infusion (especially in area 18; see Fig. 10) does not permit us to rule out this alternative, although it seems equally likely that the maintenance of clustering in the interareal connections may also require ongoing correlated activity. The only unequivocal proof that the earliest clustering of horizontal connections is indeed activity-dependent would be the demonstration that increasing the correlation in the activity between two cortical locations strengthens their mutual connections and decreasing their correlation reduces their interconnectivity. This has been demonstrated, but only at a much later stage of development (Löwel and Singer, 1992).
In rat barrel cortex, blockade of cortical activity from birth disrupts neither the normal barrel arrangement of the thalamocortical projection (Chiaia et al., 1992; but see Schlaggar et al., 1993; Fox et al., 1996) nor the development of a normal pattern of corticocortical projections within layer IV (Rhoades et al., 1996). The formation of a patchy thalamocortical projection in barrel cortex takes place as a part of the initial ingrowth into the cortical plate (Erzurumlu and Jhaveri, 1990; Schlaggar and O’Leary, 1994) and is sensitive to disruption, even by lesions, only very early in development (Belford and Killackey, 1980). Barrel formation and plasticity may constitute an aspect of cortical development fundamentally different from the segregation of LGN afferents within area 17 into ocular dominance columns, which is clearly activity-dependent and takes place and is sensitive to disruption much later in development, long after afferents have made initially diffuse functional connections in layer IV (Le Vay et al., 1978; Stryker and Harris, 1986; Antonini and Stryker, 1993). Similarly, it is difficult to relate directly the formation of patchy intrinsic connections in visual cortex to any specific event in barrel cortex development.
Early development of modular organization
If it is true that Hebbian mechanisms direct the establishment of clustered horizontal connections from the onset, then the early clustering of horizontal connections would reveal an underlying correlation structure to activity in the immature cortex, and at least one of these three situations would therefore apply: (1) cells may already be organized into nascent orientation columns at an age when 25% or fewer of the cells even possess appreciable orientation selectivity; (2) cells may be organized early into functional columns by some other input property, such as ocular dominance or on- and off-center inputs; or (3) correlations in spontaneous activity across the immature cortex may be strongly spatiotemporally modulated independent of functional selectivity, perhaps by short-range cortical circuitry or in conjunction with waves of spontaneous activity in the thalamus.
The spatial organization of single-unit orientation preferences has not been studied systematically in immature ferrets; however, optical imaging of intrinsic signals in the developing ferret visual cortex does not reveal an orientation map until P32–P36, about the time of the maturation of orientation selectivity in single-unit recordings (Chapman et al., 1996). Nonetheless, even as early as P23, approximately one quarter of ferret cortical neurons studied by Chapman and Stryker (1993) displayed some orientation selectivity. These initially selective cells were observed even in cortices that had been silenced with TTX starting from P21, before any reliable response to visual stimulation could be evoked, a manipulation that entirely prevented the later maturation of orientation selectivity. A similar proportion of orientation selective cells has been described in the visual cortex of very young kittens (P6–P12), along with a weak tendency for neighboring orientation-selective cells to prefer similar orientations (Blakemore and Van Sluyters, 1975; Fregnac and Imbert, 1978; Albus and Wolf, 1984). An interesting prospect is that the few orientation-selective cells present in immature visual cortex might form orientation kernels, perhaps linked by horizontal connections, around which the mature orientation map could crystallize. This hypothesis is testable.
Although it remains to be demonstrated conclusively that the early clusters at P27 are indeed the same clusters that connect orientation columns in adult ferrets, the early horizontal connections could contribute to the stability of the emerging orientation map while thalamocortical inputs increase and reorganize during the ensuing weeks (Cragg, 1975; LeVay et al., 1978; Friedlander and Martin, 1989;Antonini and Stryker, 1993). Support for this notion comes from the observations that orientation columns revealed by chronic optical imaging are remarkably stable over time (Kim and Bonhoeffer, 1994; Chapman, et al., 1996) and that rearing kittens under conditions in which they experience only a limited range of orientations does not cause a massive reorganization of the orientation map, but rather seems to result in normal orientation column spacing, with a selective maintenance of responses to the experienced orientations (Stryker et al., 1978; Singer et al., 1981).
An alternative possibility is that the earliest patchy horizontal connections do not link orientation columns at all, but instead connect groups of cells with some other common property. Aside from orientation columns, the visual cortex of the adult ferret is known to be organized into ocular dominance columns (Law et al., 1988; Ruthazer et al., 1995) and on- and off-center columns (Zahs and Stryker, 1988). Transneuronal labeling experiments reveal that ocular dominance columns first begin to segregate in ferret area 17 after P30 and before P37 (Ruthazer et al., 1995), too late to be responsible for the early clustering of long-range horizontal connections. Much less is known about the developmental time course for other cortical features. Because some theoretical treatments of the development of orientation selectivity rely on the segregation of on- and off-center lateral geniculate inputs (Tanaka, 1992; Miller, 1994), it would be particularly interesting to know when in development their segregation across the cortex occurs.
The relationship of orientation columns to patchy horizontal connections in adult animals encourages the notion that the earliest patchy connections also link cells that share some common receptive field property; however, as yet there is little direct support for this idea. The fact that enucleation at P21, when horizontal connections were just starting to extend, did not substantially disrupt the initial periodic clustering of horizontal connections shows that the emergence of periodic clustering does not depend on concurrent instructive cues from patterned activity, visual or spontaneous, in the eyes. A similar result has been demonstrated in macaque monkeys in which fetal binocular retinal ablations fail to block the formation of periodic cytochrome oxidase blobs (Kuljis and Rakic, 1990; Kennedy and Dehay, 1993). Nonetheless, retinal spontaneous activity may play a role in setting up the conditions necessary for clustering to occur, given that by P21 retinogeniculate connections are specific for eye, on–off contrast, and layer (Sretavan and Shatz, 1986), as may be thalamocortical connections to subplate cells in area 17 (Ghosh and Shatz, 1994). Retinal waves and a crude retino-thalamo-subplate circuit are probably both already present at birth in ferrets (Friauf et al., 1990; Wong et al., 1993), when bilateral enucleation causes profound shrinkage of the LGN (Guillery et al., 1985). To minimize such pathological effects of enucleation, we limited our study to testing the direct contribution of concurrent retinal activity to the refinement of horizontal connections by performing the enucleations at the latest age at which we were confident, within the limitations of our methodology, that the horizontal connections had not yet begun to cluster in the cortex.
The phenomenon of patchy intracortical connections is not limited to primary visual cortex. They have been observed throughout the cortices of large mammals in diverse sensory and association areas, although they have different properties in different areas (Amir et al., 1993;Lund et al., 1993). It therefore seems highly unlikely that in primary visual cortex they emerge purely as a consequence of the specific properties of retinal patterned activity. Rather, it seems that they constitute a general attribute of cortical organization but are sculpted individually in different cortical areas during development, probably by patterns of activity in their particular set of afferent inputs.
Spontaneous activity in the thalamocortical network
Bandpass-filtering white noise produces periodic patterns that greatly resemble cortical maps (Rojer and Schwartz, 1990). The cortical equivalent of spatial bandpass filtering is achieved by local excitatory connections at short range together with predominantly inhibitory interactions at slightly greater distances: the “Mexican hat” function of intracortical interaction (von der Malsburg and Willshaw, 1976; Swindale, 1982; Miller et al., 1989; Miller, 1994). Thus, a patchy, periodic pattern of correlation in cortical activity could arise as a direct consequence of normal local cortical circuitry acting on random spontaneous activity in the immature cortex. In this scenario, the periodicity of orientation columns would be constrained by the preexisting local and long-range intrinsic cortical circuitry, but the specific orientation preference at a given site could be exclusively a later-emerging function of the inputs. This has the merit that orientation selectivity could develop rapidly and simultaneously across the entire visual cortex, as a consequence of the system’s being highly constrained and interconnected from the outset.
Kittens monocularly lid-sutured from before eye opening and then reverse-sutured before the end of the critical period produce orientation maps from each eye that are in perfect register, despite never having experienced binocular vision (Godecke and Bonhoeffer, 1996). This experiment supports the model presented above that describes horizontal connections as a structural scaffold in the cortex for the emerging orientation map that is independent of visual experience. Although the model predicts that the locations of orientation columns in the map should be similar for the two eyes, it poses no obvious requirement that the specific orientations represented in those columns be the same for the two eyes, unless there is correlation during development between activity in the two eyes.
Recent in vitro recordings in slices of ferret LGN reveal that spindle waves, which occur in vivo during slow-wave sleep, are in fact attributable to synchronized oscillations that propagate as traveling waves through all laminae of the LGN (Kim et al., 1995). Such synchronized activity between the monocular thalamic laminae could serve to coordinate the development of the thalamocortical inputs from both eyes. It is interesting to note that spindle waves are first observed at approximately P26 in the ferret (McCormick et al., 1995), just about when the horizontal connections are beginning to cluster.
The following model can account for all of the findings noted above. First, the early segregation of long-range horizontal connections into clusters occurs by a Hebbian mechanism, guided by correlations present in the immature visual cortex but not dependent on retinal activity. This early correlation structure may be attributable to an ordered distribution of a small number of selective neurons, but could also simply arise from the interaction of cortical spontaneous activity with the spatial filtering properties of normal local circuitry in the cortex. As the activity-dependent maturation of orientation selectivity proceeds, the resulting orientation map would be constrained and facilitated by the periodicity of the extant network of local and long-range cortical circuitry. The specificity of horizontal connections would then be refined further in a visual experience-dependent manner by the newly established orientation map.
Footnotes
This research was supported by National Institutes of Health Grant EY009760 (M.P.S.) and Training Grant EY07120 (E.S.R.). We thank the following people: Antonella Antonini and Allan Basbaum for invaluable scientific and technical advice; Steve Zucker for help with spatial statistics; Sheri Harris for excellent lab administration; Karen MacLeod for animal care assistance; Barbara Chapman and Tobias Bonhoeffer for helpful discussions and for generously permitting the use of their data; and Michael Crair, Deda Gillespie, Michael Merzenich, Michael Silver, and Richard Van Sluyters for helpful discussions and critical reading of this manuscript.
Correspondence should be addressed to Dr. Michael P. Stryker, Professor and Chair, Department of Physiology, University of California, San Francisco, CA 94143-0444.


