

Article Figures & Data
Figures
- Fig. 1.
Working memory tasks. In these two tasks, the information guiding a correct response changed from trial to trial, and the monkey was required to update this information (i.e., to maintain an internal representation of the immediately preceding trial). InDelayed Spatial Alternation, after a delay, the monkey had to displace alternately a left or right plaque to retrieve a reward. Rewards were hidden by two identical plaques. In Delayed Object Alternation, the monkey had to alternate its choices between two objects (different in color, shape, and size) from trial to trial to obtain rewards. The same two objects were presented throughout the session and from day to day. To prevent monkeys from adopting a spatial strategy, the objects were positioned according to a pseudo-random order. The + sign indicates that a reward is hidden behind the plaques or objects (reinforced stimulus), whereas the − sign signifies the absence of positive reinforcement;arrows indicate the correct response (except for the first trial, in which either choice is correct).
- Fig. 2.
Sensorimotor and associative memory tasks. In theSensory Motor condition, memory was not required either because the reward was in sight at the response phase (Fig. 2) or because all stimuli were baited (data not shown). An intertrial interval separated each trial, and there was no relationship between trials. In the Visual Pattern Discrimination condition, the monkey had to learn an association between a stimulus (the + sign card) and the reward. This association did not vary from trial to trial and from day to day. The + sign indicates that a reward is hidden behind the plaques or objects (reinforced stimulus), whereas the − sign signifies the absence of positive reinforcement;arrows indicate the correct response.
- Fig. 3.
Levels selected for the image analyses. Seven levels, from the rostral to the caudal parts of the striatum, were selected for LCGU analysis. This schematic lateral view representation of the striatum in the center of the figure displays the anterior–posterior levels selected in each animal. The dark gray image represents the caudate nucleus, whereas thelight gray area is the putamen. Autoradiograms from one monkey are shown at each of the seven levels. Note that the scale is not applicable from one photograph to another.
- Fig. 4.
Example showing the two different methods of image analysis. Panels 1 and 2 are photographs from the same section taken at level 3 in a monkey performing the SMC task to illustrate the two different methods of analysis used in this study. The rationale for these two methods and additional methodological details are presented in Material and Methods.Panel 1 shows the “sample” method of image analysis. In this method, LCGU was measured in square samples centrally located in each of nine subdivisions of the caudate nucleus (as defined in the frame). These measurements were performed on three to six sections at each level for a given monkey. A mean LCGU rate was obtained by pooling equivalent samples from all sections at one level. For instance, left dorsolateral samples (box 1) from all sections at level 3 obtained from one monkey were averaged to obtain a mean LCGU rate corresponding to the left dorsolateral subarea at level 3. Thereafter, averages from the dorsal (boxes 1–3), central (boxes 4–6), and ventral (boxes 7–9) samples were pooled to obtain mean LCGU rates for the dorsal, central, and ventral subregions of the caudate nucleus, respectively. Finally, mean LCGU rates from these three regions were averaged to obtain a mean LCGU rate for the caudate nucleus. This procedure was applied to the left and right caudate nuclei separately. Mean LCGU rates for a given region were averaged across monkeys to obtain a group mean LCGU value for that particular region. In the second method of analysis (“regional” analysis, panel 2), instead of taking box samples, the caudate nucleus was divided into three regions (dorsal, central, and ventral), as shown. Measurements of LCGU rates were performed on the entire surface of the region of interest. Results were averaged for each region and across animals by the same method that was applied in the “sample” analysis. Note the decrease in the intensity of labeling according to a dorso-ventral gradient and the patchy zones of higher intensity in the dorsal regions. The dorso-ventral gradient observed in this figure was confirmed by the LCGU measurements in the CONT group, which showed a 24% difference between the dorsal region of the caudate nucleus (adjusted mean LCGU rates, 56 ± 4.67) and the ventral striatum (adjusted mean LCGU rates, 43.2 ± 3.49). L, Lateral border; M, medial border; D, dorsal border; V, ventral border; P, putamen.
- Fig. 5.
Percent increase in mean LCGU rates in the spatial working memory group, as compared with the control group. The percent increase in mean LCGU rates of the spatial working memory group (DSA) is shown at each level, as compared with a control group (CONT = VD + SMC tasks). The results presented in this figure are from the “regional” analysis. Results from the dorsal, central, and ventral regions are shown at levels 1–3. At levels 4 and 5, ranges are shown for the overall increase in the dorsal, central, and ventral regions of the caudate nucleus. At levels 6 and 7, only one mean LCGU rate was obtained, because the caudate nucleus was not segmented into subregions at these levels. When shown, the putamen appears without numbers, because this structure was analyzed only at level 4 (the putamen is not shown at that level). Characters in boldand an asterisk indicate the statistically significant increase in mean LCGU rates (p < 0.05) in the DSA group relative to the CONT group. Note that “left” and “right” sides are flipped, because film autoradiograms are the “mirror” images of the actual sections. Also note that the scale differs from one level to another. NC, Caudate nucleus;P, putamen.
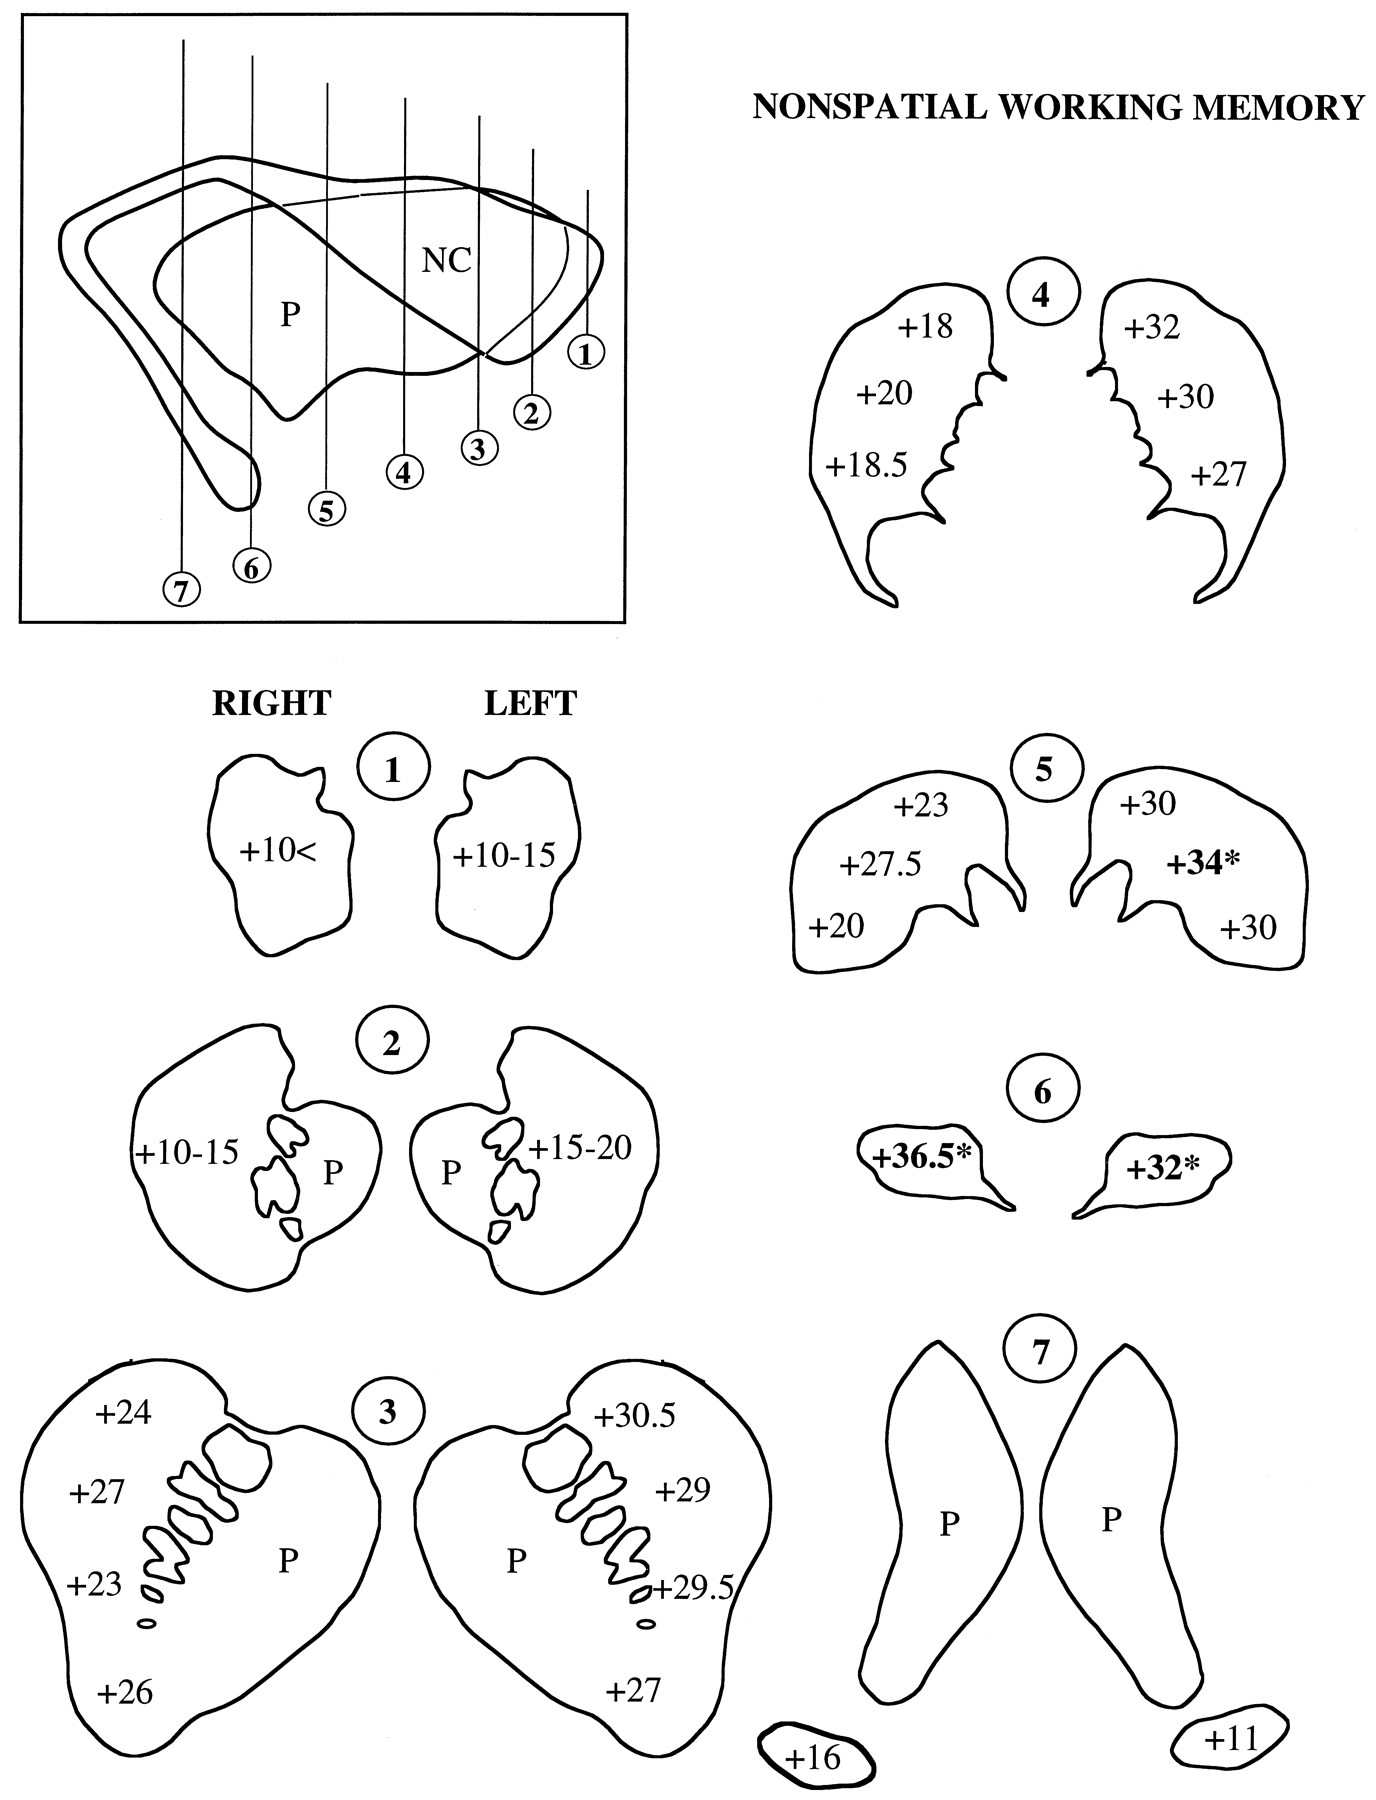
- Fig. 6.
Percent increase in mean LCGU rates in the nonspatial working memory group, as compared with the control monkeys. The percent increase in mean LCGU rates of the nonspatial working memory group (DOA) is shown at each level, as compared with a control group (CONT = VD + SMC task). Results from the dorsal, central, and ventral regions are shown at levels 3–5. At levels 1 and 2, ranges are shown for the overall increase in the dorsal, central, and ventral regions of the caudate nucleus. At levels 6 and 7, only one mean LCGU rate was obtained, because the caudate nucleus was not segmented into subregions at these levels. Characters inbold and an asterisk indicate the statistically significant increase in mean LCGU rates (p < 0.05) in the DOA group relative to the CONT group.
- Fig. 7.
Gradient of changes throughout the anterior–posterior axis of the caudate nucleus in the spatial and nonspatial working memory groups, as compared with a control group. The results presented are the percent increase in adjusted mean LCGU rates in the spatial and nonspatial working memory conditions, as compared with a control group (VD + SMC tasks) for the left (top) and right (bottom) caudate nuclei. Statistically significant increases in mean LCGU rates (p< 0.05) are shown by the asterisks.


Tables
- Table 1.
Comparison between working memory and control conditions for mean LCGU rates in the caudate nuclei
Levels Left CN LCGU Right CN LCGU WORK μmol/100gm/min CONT μmol/100gm/min WORK μmol/100gm/min CONT μmol/100gm/min 1 (Head) Dorsal 62.35 ± 4.18* 46.49 ± 4.75 63.55 ± 3.72* 50.41 ± 4.23 Central 63.27 ± 4.24* 48.38 ± 4.82 62.96 ± 6.13 50.76 ± 4.69 Ventral 52.37 ± 3.72 43.38 ± 4.23 51.42 ± 3.61 41.01 ± 4.10 2 (Head) Dorsal 70.23 ± 2.971-165 52.21 ± 3.37 70.28 ± 3.271-165 51.47 ± 3.72 Central 68.00 ± 3.191-165 51.94 ± 3.63 68.86 ± 3.691-160 50.74 ± 4.19 Ventral 56.02 ± 2.401-160 44.31 ± 2.73 56.26 ± 2.991-160 41.57 ± 3.39 3 (Head) Dorsal 70.90 ± 3.51* 55.98 ± 4.30 70.50 ± 2.85* 59.09 ± 3.49 Central 72.75 ± 3.79* 59.76 ± 4.64 72.72 ± 3.30* 60.51 ± 4.04 Ventral 64.69 ± 3.39* 52.66 ± 4.15 63.34 ± 3.28 54.48 ± 4.02 4 (Head/body) Dorsal 71.31 ± 5.86 59.60 ± 7.41 72.64 ± 5.70 57.40 ± 7.23 Central 74.32 ± 5.98 64.09 ± 7.57 74.85 ± 5.55 61.13 ± 7.04 Ventral 59.75 ± 5.03 51.03 ± 5.23 60.20 ± 4.89 50.77 ± 5.69 5 (Body) Dorsal 71.25 ± 4.53 61.75 ± 5.74 71.74 ± 4.04 60.85 ± 4.66 Central 78.25 ± 4.01 68.24 ± 5.08 77.89 ± 3.58* 63.94 ± 4.14 Ventral 59.78 ± 3.11 56.61 ± 3.93 60.88 ± 2.82* 50.47 ± 3.25 6 (Body) 68.28 ± 3.58 57.96 ± 4.39 73.38 ± 3.02* 60.60 ± 3.44 7 (Tail) 60.18 ± 2.85 54.90 ± 3.24 58.10 ± 2.25 51.08 ± 2.75 The data presented here are the mean LCGU rates (expressed in μmol/100 gm/min ± SEM) in several subregions at seven different levels in the frontal plane from the rostral to the caudal parts of the left and right caudate nuclei. Level 1 is the most rostral, whereas level 7 is the most caudal. The working memory (WORK) group pooled the mean LCGU rates from the DSA and DOA groups. The control (CONT) group represents the average of the mean LCGU rates from the SMC and VD groups. Bold characters indicate statistically significant increases in mean LCGU values in the WORK condition, as compared with the CONT group (results were processed in a MANCOVA). CN, Caudate nucleus; LCGU, local cerebral glucose utilization;
↵* p < 0.05;
↵F1-160 p < 0.01;
↵F1-165 p < 0.005.
Level Left CN LCGU Right CN LCGU DSA DOA SMC VD DSA DOA SMC VD 1 (Head) Dorsal 65.01 ± 5.04 57.32 ± 7.65 41.28 ± 6.67 53.12 ± 7.27 65.99 ± 4.69 58.44 ± 7.11 48.24 ± 6.20 53.41 ± 6.77 Central 66.48 ± 5.21 56.78 ± 7.92 45.02 ± 6.91 52.99 ± 7.53 66.51 ± 4.92 55.78 ± 7.53 47.12 ± 6.56 55.72 ± 6.56 Ventral 55.30 ± 4.69 46.14 ± 7.10 42.43 ± 6.19 45.03 ± 6.75 55.28 ± 4.23 43.31 ± 6.42 38.85 ± 5.59 44.26 ± 6.10 2 (Head) Dorsal 74.04 ± 3.5 62.06 ± 5.09 51.26 ± 4.44 54.04 ± 4.84 73.28 ± 4.03 63.45 ± 6.11 53.34 ± 5.04 49.80 ± 5.81 Central 72.57 ± 3.45 58.12 ± 5.24 51.30 ± 4.57 53.54 ± 4.99 72.39 ± 4.53 61.00 ± 6.88 51.92 ± 5.99 49.97 ± 6.54 Ventral 59.42 ± 2.61 48.68 ± 3.97 43.69 ± 3.46 45.66 ± 3.77 59.69 ± 3.53 48.64 ± 5.35 42.36 ± 4.67 41.26 ± 5.09 3 (Head) Dorsal 69.73 ± 8.47 73.21 ± 7.23 55.64 ± 6.71 56.36 ± 6.74 69.16 ± 3.90 73.17 ± 5.70 69.16 ± 3.90 57.05 ± 5.32 Central 70.69 ± 5.23 76.82 ± 7.66 60.93 ± 7.11 58.65 ± 7.15 70.63 ± 4.51 76.81 ± 6.60 61.95 ± 6.12 59.14 ± 6.16 Ventral 63.09 ± 4.64 67.85 ± 6.80 55.16 ± 6.31 50.19 ± 6.34 61.26 ± 4.49 67.42 ± 6.57 55.71 ± 6.10 53.03 ± 6.13 4 (Head/body) Dorsal 69.12 ± 8.47 73.66 ± 11.36 61.82 ± 10.73 62.70 ± 10.65 68.28 ± 7.82 80.95 ± 10.97 56.06 ± 14.71 61.50 ± 9.99 Central 70.08 ± 8.50 80.03 ± 11.40 69.84 ± 10.77 64.43 ± 10.69 69.74 ± 7.57 84.81 ± 10.02 59.71 ± 13.70 63.00 ± 9.68 Ventral 59.60 ± 5.55 65.12 ± 7.50 58.54 ± 10.07 52.22 ± 6.98 56.39 ± 6.16 67.04 ± 8.65 54.44 ± 10.25 49.95 ± 7.88 5 (Body) Dorsal 68.14 ± 6.29 76.91 ± 8.63 56.04 ± 10.27 65.08 ± 7.99 66.98 ± 4.56 79.95 ± 6.11 52.61 ± 5.77 68.81 ± 5.73 Central 73.40 ± 5.20 86.76 ± 7.16 68.00 ± 8.51 67.79 ± 6.61 73.26 ± 4.50 85.83 ± 6.04 60.38 ± 5.71 67.28 ± 5.66 Ventral 57.65 ± 4.02 63.32 ± 5.52 62.29 ± 6.57 52.32 ± 5.11 57.81 ± 3.39 66.15 ± 4.54 45.77 ± 4.29 55.29 ± 4.26 6 (Body) 62.33 ± 3.99 79.83 ± 5.84 54.26 ± 5.42 61.83 ± 4.11 70.37 ± 2.85 81.57 ± 4.32 52.24 ± 3.76 69.76 ± 4.11 7 (Tail) 59.50 ± 3.37 64.75 ± 5.12 49.52 ± 4.64 61.22 ± 4.87 57.28 ± 2.85 57.30 ± 4.16 47.27 ± 3.86 54.96 ± 3.88 The data presented here are the mean LCGU rates (expressed in μmol/100 gm/min ± SEM) in several subregions at seven different levels in the frontal plane from the rostral to the caudal parts of the left and right caudate nuclei in the DSA, DOA, SMC, and VD conditions. Level 1 is the most rostral, whereas level 7 is the most caudal. A MANCOVA has been performed to the four conditions in the different striatal subregions to compare the four with one another. The results of this analysis are shown in Results.


