

Abstract
Rhythmic oscillations of the PER protein, the product of theDrosophila period (per) gene, in brain neurons of the adult fly are strongly involved in the control of circadian rhythms. We analyzed temporal and spatial expression patterns of three per–reporter fusion genes, which share the same 4 kb regulatory upstream region but contain increasing amounts ofper’s coding region fused in frame to the bacteriallacZ gene. The fusion proteins contained either the N-terminal half (SG), the N-terminal two-thirds (BG), or nearly all (XLG) of the PER protein. All constructs led to reporter signals only in the known per-expressing cell types within the anterior CNS and PNS. Whereas the staining intensity of SG flies was constantly high at different Zeitgeber times, the in situ signals in BG and XLG flies cycled with ∼24 hr periodicity in the PER-expressing brain cells in wild-type andper01 loss of function flies. Despite the rhythmic fusion-gene expression within the relevant neurons ofper01 BG flies, their locomotor activity in light/dark cycling conditions and in constant darkness was identical to that of per01 controls, uncoupling protein cycling from rhythmic behavior. The XLG construct restored weak behavioral rhythmicity to (otherwise)per01 flies, indicating that the C-terminal third of PER (missing in BG) is necessary to fulfill the biological function of this clock protein.
- circadian rhythms
- period gene
- lacZreporter
- Lateral Neurons
- fusion proteins
- locomotor behavior
- immunochemistry
This article is dedicated to Brigitte Frisch. She found delight in her work and life. She believed that everyone had something to offer and made us all feel special. Her humor and strength will always be remembered.
The period (per) gene is thought to be a central component of the circadian clock inDrosophila. Mutations in this gene abolish (per01), shorten (perS, perClk, andperT), or lengthen (perL) daily locomotor activity rhythms that persist in constant darkness (DD) in wild-type flies (Konopka and Benzer, 1971; Dushay et al., 1992; Konopka et al., 1994). Under normal light/dark (LD) conditions, perS andperL mutants show phase advances or delays of their evening activity peaks, whereasper01 mutants do not entrain at all and simply react to the LD changes (Hamblen-Coyle et al., 1992; Wheeler et al., 1993) (see Fig. 12).

Locomotor activity of SG, BG, and XLG transgenics and their controls in LD cycles. Data were plotted from the entrainment portions (the first 7 or 14 d, 12:12 hr LD cycle) of the locomotor activity runs performed in this study (see Materials and Methods, Table1). Histograms were generated by first superposing locomotor data from a given (male) fly (see inset inH), followed by superposing the daily activities of all flies from the same genotype (for additional details about preparation of these plots, see Hamblen-Coyle et al., 1989). Theopen bars indicate activity exhibited in the light portion, and the solid bars activity monitored in the dark portion of the cycle. A,per+ SG3 males (n = 40) and ry506 control males (n = 46). B,per+ SG10 males (n = 24) compared with their w control males (n = 13). Note the substantially earlier evening peak in SG transgenic flies. C, BG/TM2males in the per+ (n = 38) and per01(n = 34) genetic backgrounds (the latter,inset). D, BG6 males in the same pair of backgrounds (n = 29 and 26, respectively). The phase advance (compared with the ry506control males shown in A) of the evening peak is not as strong as for SG (see also Table 1). Note as well that there is no anticipation of the LD and dark/light (DL) transitions in both of theper01 BG strains.E, XLG-A males (n = 47) in aper+ background showing only a subtle phase advance of their evening activity, compared with the control strainDf(1)w (n = 47) shown in theinset; XLG-A otherwise appeared to behave in aper+-like manner. F, XLG-B in a per+ background (n = 46), the behavior of which is very similar to that ofper+ XLG-A. G,per01 XLG-A (n = 42). H,per01 XLG-B (n = 38). Both G andH reveal complex patterns of LD behavior; the flies seemed to anticipate the LD changes, showing increased activity before the lights are turned off in the evening, with a distinct (notper+-like) phase advance of nearly 3 hr. In addition, these per01 XLG flies clearly reacted to LD and DL transitions as the straightper01 w sn3 control males do (n = 30; see inset in G). The complex behavior caused by the simultaneous presence of the XLG transgene and theper01 allele was observed in the records from individual animals (see inset inH), and therefore is not a reflection of two subpopulations of differently behaving flies.
per RNA and PER protein fluctuate in abundance with 24 hr periods (Hardin et al., 1990; Zerr et al., 1990; Zeng et al., 1994). Expression of the per gene inper01, perS, andperL is affected in the same manner as locomotor behavior, indicating a molecular feedback loop in which the PER protein regulates its own transcription (for review, see Hall, 1995; Rosbash, 1995). Mutations in a different clock gene, timeless(tim) also produce arrhythmic (tim01) and period-altered (timSL) behavior (Sehgal et al., 1994; Rutila et al., 1996). The products of the timgene undergo similar fluctuations as those of per, and both PER and TIM proteins can dimerize in vivo (Sehgal et al., 1995; Zeng et al., 1996). tim01 orper01 mutations result in loss of rhythmic RNA expression of the other (nonmutated) gene, indicating that both genes are necessary for establishing the molecular feedback loop in which the PER–TIM heterodimer is thought to play an important role (Zeng et al., 1996).
Behavioral analysis of genetic mosaics expressing PER in certain lateral brain neurons (LNs) of per01flies is sufficient to restore rhythmic behavior under DD conditions, suggesting that these cells have pacemaker function (Ewer et al., 1992). Analysis of PER coding transgenes showing rhythmic expression in the LNs of per01 flies was consistent with these results: the transgenics were able to entrain to LD cycles and showed rhythmic behavior under DD conditions (Frisch et al., 1994;Vosshall and Young, 1995).
A genomic 4.2 kb DNA fragment upstream of per’s coding region was shown to drive rhythmic RNA expression of reporter genes fused to this sequence when endogenous PER protein is present in these flies (Hardin et al., 1992). Fusion of per-regulatory sequences directly to lacZ did not lead to cycling of β-galactosidase (β-GAL) levels in a per+genetic background, whereas this 5′-flanking DNA from theper locus and half of its coding region were reported to permit β-GAL to fluctuate with a 24 hr period (Zwiebel et al., 1991). That result did not prove reproducible, which was one of the reasons that prompted our analysis of a series of per–lacZ fusion constructs, each sharing the same 5′ regulatory sequences but with increasing amounts of per’s coding region (Fig.1). Thus, we mapped regions of the per gene product that are necessary to allow PER-like protein turnover. To ask whether the cycling of a certain fusion protein could be independent of endogenous PER, we also analyzed the temporal expression of these transgenes in a per01 background. Analysis of locomotor behavior was performed under LD and DD conditions to determine which fusion proteins might mediate rhythmic behavior.

Structure of per–lacZ fusion genes analyzed for temporal and spatial expression. In the top panel, the structure of a 13.2 kb genomic DNA fragment containing the per gene is shown. This construct restores rhythmic behavior after transformation intoper01 mutants (Citri et al., 1987). The solid line represents upstream untranscribed regulatory sequences as well as introns and 3′ untranscribed DNA. Thebars reflect exon sequences; solid partsdesignate untranslated and open bars protein-coding DNA sequences. Striped portions represent the PAS domain, which can function as an intermolecular protein dimerization motive (residues 240–496) (Burbach et al., 1992). Shaded areasrepresent the C domain involved in intramolecular protein interactions (residues 524–685, Huang et al., 1995), and checked areas represent the GT repeats, which vary in number among different Drosophila melanogaster strains (e.g., 20 Gly-Thr pairs in the wild-type strain Oregon-R) (Yu et al., 1987). Potential PEST sequences, identified by the program PESTFIND (Rechsteiner et al., 1987) are indicated byasterisks and extend from residues 135 to 162 (exon 3), 652 to 664 (exon 5), 1184 to 1215 (exon 6), and 1242 to 1256 (also showing the highest PEST score, exon 7). The arrowindicates per’s transcription start site (+1). Translation starts at the NcoI site and stops 32 bp 3′ of the NciI site. The differentper–lacZ fusion genes contain various amounts of this genomic per DNA fragment, fused in frame to theE. coli lacZ gene. They all share the same 5′ regulatory region (from the BamHI site at −4200) and transcribed sequences up to the SacI site in exon 5 (including the PAS domain), where the SG fragment is fused to lacZ. SG contains only one complete PEST sequence and is missing parts of the C domain and all of the GT repeat. The BG construct contains additionalper-coding DNA up to the BamHI site in exon 5, including two PEST sequences as well as the complete C domain and GT repeat. XLG extends to the NciI site in exon 8, including two additional PESTs that are missing in BG. Note that this construct does not quite encode the full-length PER protein (see Materials and Methods).
MATERIALS AND METHODS
Generation of per–lacZ fusion constructs
The structure and generation of the SG construct has been described previously (Liu et al., 1988). It contains a 4.2 kb 5′-flanking region that is part of a 13.2 kb genomic perfragment; the latter almost completely rescues the effects of the arrhythmic per01 mutation (Citri et al., 1987; Yu et al., 1987; Dushay et al., 1992). In addition to this upstream region, SG contains per DNA coding for ∼50% (638 amino acids) of the N-terminal PER protein (up to the SacI site, therefore called SG) (Fig. 1) fused in frame to the bacterial lacZ gene.
The generation of the BG construct is described elsewhere (Dembinska et al., 1997). It contains the same 4.2 kb 5′-flanking region as SG and encodes 868 amino acids of PER, corresponding to the N-terminal two-thirds of this protein (up to the BamH1 site and therefore called BG) (Fig. 1) fused in frame to the lacZgene (as above).
The XLG construct was generated as follows. First, the CaspeRlacZ transformation vector (Thummel et al., 1988) was modified by replacing the BamHI and PstI restrictions sites with XhoI and NotI sites after Klenow treatment and blunt-end ligation of the respective linkers. TheXhoI site was created to allow in-frame cloning of genomicper DNA to lacZ. A 6.4 kb genomic perDNA fragment containing sequences from −4200 bp to +2267 bp (the bp numbers are with reference to the transcription start of theper gene) was cut with NotI and XbaI and ligated into the NotI and XbaI sites of the transformation vector (the XbaI site is located between theXhoI and NotI sites of the modified vector). In a different step, a clone containing genomic per DNA from theXbaI site at +2267 to a XhoI site at position +6658 was generated [the XhoI site was generated after first filling in the original NciI site at position +6658 with Klenow and then blunt-ligating it to a filled in XhoI site of pBluescript II KS(+)]. To create the final construct, this 4.4 kbXbaI/XhoI fragment was ligated in frame into theXbaI/XhoI sites of the transformation vector. This construct contains DNA coding for nearly the whole PER protein, except 10 amino acids at the C-terminal end, normally encoded by DNA extending from the NciI site at position +6658 to the translational stop codon TAG at position +6690. Because theNciI site was replaced by XhoI and aXhoI linker was used to create this restriction site in thelacZ gene, this construct was named XLG.
Stocks and P-element transformation
The genetic variants used for this study are described inLindsley and Zimm (1992). Flies were raised on a cornmeal, sugar, yeast, and Tegosept medium (the latter being a mold inhibitor) on a 12:12 hr LD cycle (lights on at 8 A.M.)
Two independently isolated SG lines, carrying this per–lacZfusion gene inserted into the X (SG10) or the second chromosome (SG3) (Liu et al., 1988; Zwiebel et al., 1991) were used in this study. Both lines were obtained after transformingper01;ry506embryos. To generate a per+ SG10 strain, theper01 SG10 chromosome was recombined with a per+ w sn3 chromosome to replace the loss-of-function mutation with per’s normal allele (Ewer et al., 1992).
One transgenic BG line was obtained after transformingper01;ry506embryos with the BG construct (X. Liu, personal communication). In this line, the P-element is inserted on the third chromosome and causes lethality when flies are homozygous for the insertion; this line is balanced with the multiply inverted third chromosome In(3LR)TM2, ry Ubx and was therefore named BG/TM2 (indicating that flies from this stock carry only one copy of the BG construct). The BG transposon in BG/TM2 was mobilized by crossing that strain to a transposase-producing Δ2-3 strain (Robertson et al., 1988); this resulted in the homozygous-viable BG6 strain, in which the transgene is located on the second chromosome.
The XLG-A and XLG-B strains were generated after transformingDf(1)w embryos with the XLG construct (carrying the mini-white+ gene as selectable marker). Transformations were performed using standard techniques (Rubin and Spradling, 1982); transposase was supplied by co-injection of the helper plasmid pUChsπΔ2-3 (Laski et al., 1986). Two transformed lines were recovered, derived from different injected embryos. The locations of the insertions were determined genetically by crossing transformant flies to second and third chromosomal balancer chromosomes. The XLG-A and XLG-B lines carry their (homozygous-viable) insertions on the second chromosome. To analyze these transgenes in aper01 background, the Df(1)wchromosome (which carries per+) was replaced by an X chromosome carryingper01 w sn3.
Histochemistry
Transgenic males carrying either the SG-, BG-, or XLG-lacZ fusion genes were exposed to at least three 12:12 hr LD cycles at 25°C before sectioning. For the cycling experiments, flies were collected at two different Zeitgeber times (ZTs) in the case of SG and XLG (ZT12 and ZT24 for SG, ZT9 and ZT21 for XLG; ZT24 defines “lights on” and ZT12 “lights off”) and at four different times in the case of BG (ZT3, ZT9, ZT15, and ZT21). For the time points at which the flies had to be collected in the dark, vials were moved (in darkness) from the incubator to a small light-tight container where they were kept until they were either anesthetized or embedded in a tissue-freezing medium (TBS).
Immunohistochemistry. Flies were anesthetized, their wings and legs removed, and the specimens transferred to an Eppendorf tube containing 1 ml ice-cold fixing solution (4% paraformaldehyde in 0.1m sodium phosphate buffer, pH 7.0). After fixing them for 4 hr at 4°C on a rotating mixer, the fixing solution was removed and the flies were washed four times for 10 min in 0.1 mphosphate buffer, pH 7.4, at 4°C. After the last wash, flies were incubated overnight in 25% sucrose in 0.1 m phosphate buffer, pH 7.4, at 4°C. Flies were frozen in tissue-freezing medium, and horizontal sections (10 μm) of individual specimens were made on a cryostat microtome (SLEE). Sections were then transferred to glass slides, dried for 1 hr, and rinsed in 0.1 m phosphate buffer, pH 7.4, for 10 min and in PBS two times for 10 min each at room temperature. Each slide was preincubated for 1 hr at room temperature with 400 μl PBS containing 3% normal horse serum (NHS), 0.1% Triton X-100, and 0.1% BSA. Sections were then incubated overnight at 4°C with a monoclonal mouse anti-β-GAL antibody (Promega, Madison, WI) diluted 1:2000 in PBS containing 3% NHS, 0.03% Triton X-100, and 0.1% BSA. On the next day, slides were rinsed three times for 10 min each at room temperature (as for all the following washes and incubations) in PBS containing 0.03% Triton X-100 and 0.1% BSA and then incubated for 1 hr with a 1:200 dilution (see above) of a secondary biotinylated horse anti-mouse antibody (Vector Laboratories, Burlingame, CA). After rinsing the sections three times for 10 min each in PBS containing 0.03% Triton X-100 and 0.1% PBS, then two times for 10 min each in the same solution without Triton X-100, the Vectastain ABC ELITE Kit (Vector) was used to amplify the staining signal. Slides were washed again two times for 10 min each in PBS containing 0.1% BSA and three times for 10 min each in PBS before they were developed with DAB, as described in Siwicki et al. (1988) with minor modifications. All sections included in the cycling analysis were incubated with 0.3 mg/ml DAB solution for exactly 3 min. Slides were then baked with Crystal Mount (Biomeda), and coverslips were mounted with DPX (Fluka, Ronkonkoma, NY). Sections were viewed and photographed using Nomarski optics and a Zeiss Axiophot light microscope.
Anti-PER stainings were performed by incubating fly sections (see above) with a polyclonal rabbit anti-PER antibody, which was raised against full-length PER protein expressed in a baculovirus expression system (Liu et al., 1992). Anti-PER antibodies were used in a final concentration of 1:6000 after preabsorbing the serum againstper01 embryos. Signals were visualized after incubation with a secondary biotinylated donkey anti-rabbit antibody (1:200) and DAB, as described above.
X-gal staining. Stainings with 5-bromo-4-cloro-3-indolyl-β-D-galactopyranoside (X-gal) were carried out on 10 μm frozen horizontal sections, as described in Liu et al. (1988), except that slides were mounted and photographed as described above (for the antibody stainings).
Scoring of staining intensities. In the case of the BG construct, transgenic males from the BG/TM2 strain in aper+ and per01background were collected at four different time points during a 24 hr cycle (see above). Five males (per+genetic background) or six males (per01 background) per time point were analyzed. After staining and mounting, the slides were coded and scored by three different investigators, who inspected the sections at 160× magnification under the microscope. Levels of staining were subjectively scored using an intensity scale of 1 to 4, in increments of 0.5 (1 = no detectable staining above background, 4 = most intense staining). Scoring was carried out separately for the following three per-expressing tissues in the head: photoreceptor (PR) cells, glia, and per-expressing LNs (cf. Zerr et al., 1990). Final (to be plotted) scores were calculated as follows. First, the mean for each animal was determined as the average of the value given by each of the three investigators, then the five or six means for all animals sectioned at the same time were averaged to calculate the final mean (± SEM) for a given genotype, tissue, and time (see Results; see Fig. 8). In the case of the SG construct type, males from the two transgenic lines SG3 and SG10 [the former in aper+ (n = 10) and aper01 (n = 8) background, the latter in a per+ background only (n = 10)] were sectioned at two opposite ZTs (see above) and stained with X-gal. Collections were made from incubators that were kept on opposite phases [LD and dark/light (DL)] so that pairs of flies with the same genotype but entrained to opposite ZTs could be collected and processed at the same time (each pair was processed on a given experimental day). To standardize the scoring of the staining intensity, photographs (all at the same exposure) of each fly brain, at the level of the esophagus, were taken. These images of fly brains, from flies sectioned on the same day, were then ranked by three different observers (each fly was given one rank, representing an average staining intensity of PRs, glia, and the ventral group ofper-expressing LNs). These photographs were then decoded, and ranks given to a pair of flies, with the same genotype and opposite ZT, were compared. If the fly at ZT12 was given a higher rank (e.g., stronger staining intensity) compared with its partner at ZT24, the pair was classified as “higher staining at ZT12”; and vice versa. If both flies of a pair turned out to have the same rank, they were classified as “equal” (see Fig. 6).

Quantification of BG-mediated staining intensities. Sections from per+ orper01 BG/TM2males were stained with anti-β-GAL-antibody. Flies were entrained and collected under 12:12 hr LD conditions. Five (per+) or six (per01) flies were sectioned and stained at each time point. The staining intensities in the LNs, glia, and PRs of each fly were subjectively scored by three observers (who were unaware of either genotype or ZT of the preparations), using an intensity scale from 1 to 4. The means for each genotype are plotted as a function of ZT (see Materials and Methods, including the procedure of SEM calculation). A, Staining intensities in LNs in aper+ background. B,per01 background; in both genetic backgrounds, the staining intensities show circadian fluctuations, although cycling is less robust and with lower amplitude in the mutant background. C, Staining of glia in aper+ background. D,per01 background. Only in theper+ background were strong circadian fluctuations of staining intensities detectable. E, PR staining in a per+ background.F, per01background. Again, circadian changes in staining intensities were detectable only when per+ was expressed.

Quantification of staining intensities for the SG3 and SG10 per–lacZ transformants. Three observers were asked to rank (X-gal-mediated) staining intensities of fly brains sectioned at ZT24 and ZT12 on the same day (see Materials and Methods). The intensity for a given pair of flies (with the sameper genotype) was classified as “higher at lights on” (ZT24), “higher at lights off” (ZT12), or “equal.” For the per+ SG3/SG3 andper+ SG10 transgenics, five pairs of flies were scored, and for per01SG3/SG3, four pairs (resulting in a total of 15 classifications for theper+ genetic background and 12 classifications in the per01background). The majority of fly pairs from all genotypes showed equal staining at both time points or higher staining at lights off (in contrast to wild-type PER or BG- and XLG-per–lacZfusion proteins, which stain most intensely around lights on) (Zerr et al., 1990; present study).
Immunoblotting
Flies from the XLG-A and XLG-B transgene strains, in aper+ and a per01background, were entrained for at least 3 d in 12:12 hr LD cycles, as described for the histochemistry experiments. Animals from all four genotypes were collected and immediately frozen on dry ice at six different ZTs (ZT2, ZT6, ZT10, ZT14, ZT18, and ZT22). Total fly-head protein extracts were prepared from 100 to 200 heads of each collection, as described in Edery et al. (1994). Equal amounts of each extract (∼100 μg) were mixed with 5× SDS sample buffer (Laemmli, 1970) and separated on 5.7% polyacrylamide (29.6:0.4, acrylamide:bisacrylamide ratio)/SDS gels. After electrophoresis, proteins were electroblotted to nitrocellulose membranes (12–14 hr with 150 mA in a buffer containing 20% methanol, 0.1% SDS, 14.2 mm Tris, 192 mm Glycin). To ensure that the transfer of the 300 kd XLG fusion proteins had been complete, gels were stained with Coomassie brilliant blue. The quality of protein transfer and the (intended) equal loading were checked by staining the proteins on the nitrocellulose membrane, using the reversible Ponceau S stain (Sigma, St. Louis, MO). After blocking with 1% BSA in a solution containing 140 mm NaCl, 10 mm Tris/HCl, ph 7.5, 0.05% Tween 20 (TBST) membranes were incubated with a polyclonal rabbit anti-PER (see above) or a mouse monoclonal anti-β-GAL (Promega) antibody (both 1:10,000 diluted in 5% nonfat dry milk in TBST) for 2 hr. Filters were washed one time for 15 min and three times for 5 min in TBST and incubated for 30 min with a secondary HRP-coupled anti-rabbit or anti-mouse antibody (Amersham, Arlington Heights, IL), respectively. After washing (see above), proteins were visualized using the Enhanced Chemi-Luminescence Kit (Amersham) followed by autoradiography. Typically, exposures were for 1–60 sec. Band intensities were quantified after exposing membranes to chemiluminescence sensitive screens (usually 10 times longer than for x-ray exposures) and by subsequent imaging of exposed screens in a phosphoimager (Bio-Rad, Hercules, CA). After staining a membrane with the anti-PER antibody, the same membrane was stripped (in 100 mm β-mercaptoethanol, 2% SDS, 62.5 mmTris/HCl, pH 6.7, for 30 min at 50°C), blocked, and incubated with anti-β-GAL antibody, as described above. Amplitudes of protein cycling were calculated after first setting the highest expression values (as obtained from the phosphoimager data) in each experiment equal to 1, followed by dividing the mean of the two highest values (usually ZT18 and ZT22) by that of the two lowest values (usually ZT2 and ZT6).
Circadian behavioral rhythms
Locomotor activity of adult males was monitored automatically, as described in Hamblen et al. (1986). Data were processed and analyzed, as described in Hamblen-Coyle et al. (1992).
Flies were kept under 12:12 hr LD conditions at 25°C for 7 or 11 d, depending on the experiment. Recording of the locomotor activity data began after 1 d in LD conditions. On day 8 or 12, respectively, the lights stayed off, such that the flies were subsequently monitored in DD conditions for the next 12–14 d. To determine the period of free-running rhythms, data collected under DD conditions were searched for periodocities using the χ2periodogram (Sokolove and Bushell, 1978). Significant periods were determined as described by Hamblen et al. (1986).
To determine the exact position of the morning and evening activity peaks in LD conditions, a program called Phase was applied (for details, see Hamblen-Coyle et al., 1992). It allows an objective determination of an activity peak (with respect to times of environmental transitions in LD cycles) for each fly on a given day; then a mean (per day) value is computed for an individual for which successive cycles involve the same environmentally cycling conditions. These (per fly) mean phase values were used in a (nonparametric) Mann–Whitney U test to perform statistical comparisons among the different genotypes. The software (Hamblen-Coyle et al., 1992) was also used to compute group phase values for all the animals of a given genotype tested (see Table 1).
Entrained and free-running behavior of SG, BG, and XLG transgenics
RESULTS
Spatial expression pattern of SG, BG, and XLG transgenes at a high time point
In situ expression of the per gene has been revealed by using per–lacZ fusion genes and by anti-PER antibody stainings (Liu et al., 1988, 1991, 1992; Siwicki et al., 1988;Ewer et al., 1992). In Drosophila heads, per is expressed in certain neurons, in PRs R1–R8, in the ocelli, and in glia cells of the optic lobes and the central brain. Theper-expressing neurons consist of two classes, known as Lateral Neurons (LNs), which are located in the cortex between the dorsal anterior brain and the medulla, and dorsal neurons (DNs), located in the posterior dorsal-most cortex. The LNs were reported to consist of two groups: a more dorsally located cluster of approximately three to seven cells on each side of the brain called thedorsal LNs (LNd) and another, more ventral cluster of at least eight cells called the ventral LNs (LNv). For the DNs, between 2 and 10 cells can be found on each side of the brain (Ewer et al., 1992; Helfrich-Förster and Homberg, 1993; Frisch et al., 1994; Helfrich-Förster, 1995).
To compare the spatial distribution of the three different PER–β-GAL fusion proteins used in this study with that of wild-type PER protein, sections of SG, BG, and XLG transgenic flies were stained by application of anti-β-GAL antibodies (Fig. 1). To allow comparisons of expression levels among the different transgenes, all flies were fixed for sectioning late at night (ZT21), when PER is expressed at its maximum levels (Zerr et al., 1990). In agreement with earlier studies (Liu et al., 1988; Ewer et al., 1992), the SG fusion protein is expressed in all known per-expressing cells, although several differences (quantitative and qualitative) were observed. Figure 2 demonstrates head expression of the SG3 transgenic line, which shows the same staining pattern and intensity differences in the various cell types that were reported previously for the SG10 strain (per–β-gal) (see Materials and Methods; see also Ewer et al., 1992). Compared with PER expression, SG signals appear to be more intense in glia (in Fig. 2C,arrowheads) and PRs, whereas staining in the LNs (arrows) is much fainter (compare Fig. 2 with Ewer et al., 1992). Also, the number of stained glial cells in the optic lobes and especially in the central brain seems to be larger compared with that of PER positive cells (Fig. 2) (cf. Ewer et al., 1992). In addition the fusion protein is detectable in both nuclei and cytoplasm of LNs and PRs (glial cells are too small to make this distinction), whereas PER is predominantly nuclear late at night (Fig. 2) (cf. Ewer et al., 1992;Liu et al., 1992, Curtin et al., 1995).

Distribution of anti-β-GAL immunoreactivity in aper+ SG3 transgenic adult male.A, Staining pattern at the level of the esophagus, in a horizontal section (the others depicted here are in the same plane). Scale bar, 40 μm. B, Magnification ofA; arrow points to a group of the LNv (relatively ventral LNs; see Ewer at al., 1992);arrowheads point to glia cells in the outer rim of the medulla, in the cortex, and to glia located at the border between the cortex and the neuropil of the central brain. Scale bar, 8 μm.C, A different section located just ventral to that inA and B; the arrow points to LNv, arrowheads to glia cells located in the lamina and the outer rim of the medulla. Scale bar, 12.5 μm.D, A section showing not only LNv(arrow), but also glia cells in the second optic chiasm (arrowhead). Scale bar, 12.5 μm.
The larger BG fusion protein is also expressed in all knownper-expressing cells; however, in contrast to SG, its expression seems more closely to reflect the wild-type expression pattern (Fig. 3). All types of neurons (DN, LNd, LNv) were stained intensely. This fusion protein fills up the somata, which made it possible to distinguish the different sizes (and shapes) of the neurons. The DNs are a loose cluster of cells. The two neurons shown in Figure 3, E and F, have a diameter of ∼8 μm. The LNd usually form a tight cluster of ∼six cells; their diameter is ∼6 μm (Fig.3A,B). This group is usually difficult to identify in the SG strains, probably because of the weak SG expression in the LNs in general (see above). The LNvconsist of two different-sized cell types: four large oval neurons (diameter, ∼13 μm) and four to six smaller cells (diameter, 6 μm) (Fig. 3C,D) (cf. Helfrich-Förster and Homberg, 1993; Helfrich-Förster, 1995). In most samples, the locations of the LNv span 30–40 μm in the dorsal to ventral direction. Usually the large neurons are slightly dorsal to the smaller neurons, but there is variability in the arrangement of these cells.

Pattern of per-expressing cells in a per+ BG transgenic adult at ZT21. This male carried the BG construct heterozygous with a balancer chromosome (TM2; see Materials and Methods) and was stained with anti-β-GAL antibody. A, The open arrowpoints to LNd (relatively dorsal LNs; see Ewer et al., 1992). Scale bar, 25 μm B, High-magnification view ofA; four to five LNd (diameter, ∼6 μm) lie close together; arrowheads point to glia in the cortex, adjacent to the neurons, and to glia bordering the medulla. Scale bar, 12.5 μm. C, A large oval cell of the LNv group (large arrow); the smaller arrow points to four neurons of smaller diameter (∼6 μm).D, Higher magnification of C;arrowheads point to glial cells at the outer rim of the medulla and to glia in the second optic chiasm. E, DNs.F, Higher magnification of E, showing two overlapping DNs present in this section (diameter, ∼8 μm); thearrowhead indicates cortical glia. G, PR staining (left part of the image); thearrowheads point to glia in the lamina and in the layer between the PRs and lamina. Scale bar, 8 μm. H, Staining in the cardia. Magnifications in C,E, and H as in A; inD and F as in B.
By focusing through the soma of the LNs, one can usually distinguish the nucleus from cytoplasm by slightly lighter staining in the former compartment (see Fig. 3B for the LNd and D for the LNv). Thus, the BG fusion protein can enter the nucleus, but it is clearly not predominantly nuclear as is PER at this time of the LD cycle (Curtin et al., 1995). Glial staining in the BG transgenic type was generally less intense and restricted to fewer cells than glial staining in SG flies (compare Figs. 2A and 3C). Strong glial staining was only observed along the outer rim of the medulla (Fig.3D). In contrast to SG, only weak glial staining was observed in the lamina (Figs. 2C and 3D), the cortex, including neuropil borders (Figs. 2A and3C), and the inner optic chiasm (Figs. 2Dand 3D). Glial staining of BG transgenics therefore closely reflects PER expression in this cell type (cf. Ewer et al., 1992).
The nuclei of the PRs in BG flies showed robust reporter expression. The cytoplasm of the PR cells is also labeled but less strongly than in SG flies (Figs. 2A,C,D,3C,D,G); this might contribute to the weaker signal in the lamina in BG flies (see above). Expression of the BG fusion protein in the thorax and abdomen was also inspected and found to be similar to that of PER (for an overview ofper-expressing tissues in the whole fly, see Hall, 1995). As an example, nuclear BG staining in the outer layer of epithelial cells in an alimentary structure (the cardia) is shown (Fig.3H).
The XLG fusion protein was expected to exhibit an expression pattern very similar to that of PER, because this transgene encodes nearly the full-length protein (Fig. 1). Yet the observed stainings in PR cells and glia were different from the wild-type and BG patterns, at least in terms of intensity of the signals (Fig. 4); XLG expression in the PRs is not restricted to the nucleus but is equally distributed through the whole cells (Fig. 4E). Whereas prominent glial expression was observed at the outer rim of the medulla in SG and BG, XLG flies showed very low expression in these cells (Fig. 4A–C). Moreover, these glial cells and few additional ones in the cortex of the optic lobe (Fig.4A) were the only positively stained non-neuronal cells that we were able to identify (for example, no staining could be detected in the lamina and the inner optic chiasm) (Fig.4C,E). In contrast, XLG-mediated signals inper-expressing neurons were prominent and similar to those observed for BG. The XLG fusion protein also fills up the neuronal perikarya, making it possible to distinguish cell sizes and shapes. Figure 4, A and B, shows six cells of the LNd group. In addition, two large cells from the dorsal subset of the LNv are visible. Figure 4Dillustrates staining of smaller DNs (diameter, ∼3-5 μm) compared with the DNs shown in Figure 3F (diameter, ∼8 μm). In both cases, these neurons (usually two) are located at similar lateral positions in the posterior dorsal brain and were the only DNs found in that region. This indicates that they belong to the same group of cells that shows variable cell size rather than representing cells of two different groups, as was observed for the LNv (Fig.3C,D). A different group of five to eight DNs expressing the BG fusion protein was found to be located in more central regions of the dorsal brain (data not shown).

per-Expressing cells in the head of a per+ XLG-B transgenic adult at ZT21. The sections of the male were stained with anti-β-GAL antibody (staining of this line is more intense than in XLG-A, but the spatial pattern is identical; compare Fig. 10) (also data not shown).A, Six LNd cells (open arrow) are visible in this section (diameter, ∼5–6 μm); the solid arrow points to two large cells (diameter, ∼11 μm) from the relatively dorsal region of the LNv group;arrowheads indicate glia cells bordering the medulla. Scale bar, 12.5 μm. B, Higher magnification ofA. Scale bar, 8 μm. C, The solid arrow points to LNv; four cells of smaller size (diameter, ∼4–5 μm) are visible in this plane. D, DNs (arrow); note that the nucleus seems stained lighter than the surrounding cytoplasm (diameter, ∼3–5 μm). Magnifications in C and D are as in A. E, PR staining, which appears mainly cytoplasmic (the nuclei cannot be distinguished from the soma); the open arrow points to a group of LNd. Scale bar, 25 μm.
The XLG fusion protein is present in the nucleus and the cytoplasm, and the majority of the signal seems to be in the latter compartment (Fig.4A–D). This indicates that the C-terminal part of PER, not present in BG, is not responsible for proper nuclear localization of PER–β-GAL fusion proteins (see Discussion). We have no explanation for the relatively low expression of XLG in glia cells. Two independent transgenic lines (XLG-A and XLG-B) gave similar results, arguing against chromosomal position effects. Furthermore, Western blot experiments show that both transgenic lines express the fusion protein in comparable amounts to endogenous PER (see Fig.11).

Western blots of XLG transgenics. Males carrying the A and B insert location of this fusion gene and eitherper+ orper01 had protein extracted from their heads, which was electrophoresed and subjected to immunoblotting as a function of ZT (i.e., different times within a 12:12 hr LD cycle when the adults were killed for protein extraction). These times are indicated above each lane in A andB. B, XLG-B based Western blots after incubation with polyclonal anti-PER antibody; in bothper+ andper01 genetic backgrounds, the PER–β-GAL fusion protein undergoes similar changes in abundance and mobility as the endogenous PER protein does. For quantification of this experiment, see C and D. As controls, equal protein amounts of head extracts from Df(1)w(per+) andper01 w sn3(per01) flies were blotted on the same gel. Note the absence of endogenous PER in all genotypes for which the genetic background isper01. B, Signals obtained after application of a monoclonal anti-β-GAL antibody [the same membrane (see A)] was stripped and subsequently incubated with this reporter-detecting reagent) and showed the same mobility shifts and fluctuations in abundance as inA, in both per+ andper01 genetic backgrounds. SeeE for quantification. In addition, a 116 kd protein band is detected by the anti-β-GAL antibody in all head extracts from the XLG transgenics but not in those from the two control strains. Note that this band runs at a similar position in the gel as does the bacterial β-GAL protein, which was included in the MW marker.C–F, Quantification of a set of Western blot experiments using a phosphoimager (see Materials and Methods). To allow amplitude and phase comparisons between different protein curves, the highest expression values for each protein in each experiment were set equal to 1. C, XLG-A and XLG-B proteins in theper+ background. D, XLG-A and XLG-B in the per01 background (for C and D, the proteins were detected with anti-PER). To compare the cycling of both fusion proteins with that of PER, endogenous PER abundance (fromper+ XLG-A flies in C andper+ XLG-B flies in D) is also plotted. Amplitudes of protein cycling in these experiments were as follows: PER in XLG-A [strain B], 4 (6.5)-fold; XLG-A [B] inper+, 4.5 (5)-fold; XLG-A [B] inper01, 1.5 (2)-fold (for how the amplitudes were calculated, see Materials and Methods). ForE, the same blots used to generate the data forC and D were subsequently incubated with anti-β-GAL (see above) and quantified; amplitudes were 11 (9.5)-fold for XLG-A [B] in the per+ and 3.5 (3)-fold for XLG-A [B] in the per01background. In F, quantification of a second, independent Western blot experiment involving the XLG-A and XLG-B lines (in the per+ andper01 backgrounds) probed with anti-β-GAL was performed. Again, the XLG fusion proteins show robust abundance and mobility fluctuations in both genetic backgrounds (amplitudes for XLG-A [B] were 8 (9)-fold in theper+ and 2 (3)-fold in theper01 background. Theopen bars represent the light, and the solid bars the dark portion of the LD cycle, respectively.
Temporal pattern of transgene expression inper+ and per01 genetic backgrounds
The detailed analysis of the spatial expression patterns allowed us to study temporal changes in expression in the different cell types expressing the various fusion proteins.
To determine whether the different PER–β-GAL fusion proteins undergo PER-like circadian fluctuations in abundance, we performed X-gal and anti-β-GAL antibody stainings at different times of the day (see Materials and Methods). Flies were entrained for at least 3 d in 12:12 hr LD cycles before they were sectioned at a variety of ZTs. The transgene-mediated signals were also assessed in flies for which only (endogenous) per gene was a loss-of-function mutation (per01) to ask whether cycling could be controlled by the PER sequences in a given fusion protein.
It was reported that β-GAL enzyme activity shows circadian oscillations in head extracts of per+ SG flies, whereas the activity was constant in aper01 background (Zwiebel et al., 1991). Because this aspect of the study proved irreproducible (see Discussion), we performed X-gal stainings to reexamine this finding. When pairs of SG3 and SG10 transgenic flies, collected at opposite ZTs (ZT12 and ZT24), were stained in a per+background, no differences in staining intensities could be observed. At both time points, strong staining in PR and glial cells was observed, the only difference being a generally weaker signal in theper+ SG10 flies (Fig. 5,middle and bottom rows). In contrast, PER protein shows its maximum abundance at ∼ZT24 and at most ∼20% of that expression level at ZT12 (Zerr et al., 1990; Zeng et al., 1994). Thus, the SG fusion protein (or at least its β-GAL activity) does not undergo circadian fluctuations after all. Note that in this regard it is possible to detect a mere twofold difference in perexpression levels using X-gal staining on head sections ofper–lacZ transgenics (Cooper et al., 1994) and that the PER protein cycles with a ∼10-fold amplitude in biochemical experiments (Zeng et al., 1994). In agreement with the earlier study and as expected from the results just described, no cycling of the SG fusion could be detected in a per01background (Fig. 5, top row) (Zwiebel et al., 1991).

Temporal expression in heads of SG transgenic flies. Pairs of males carrying the same per allele were sectioned and stained with X-gal at opposite ZTs. In contrast to PER, which is highly abundant late at night (ZT24) and nearly undetectable by the end of the day (ZT12), the SG fusion protein shows no such fluctuations (compare ZT12 with ZT24). The reporter activity was at a constantly high level in PR cells, glia, and LNs inper+ andper01 genetic backgrounds, for both the SG3 and SG10 transgenic flies (data not shown forper01 SG10). The same results were obtained after staining SG transgenics with anti-β-GAL antibody (data not shown).
To quantify the staining data, sections of fly pairs with the same genotype, but opposite ZTs, were ranked blindly by three different observers (see Materials and Methods). After decoding these results, each pair was classified either as “equal staining at both ZTs,” “higher staining at ZT24,” or “higher staining at ZT12” (Fig.6). Cycling seemed to occur only in one case (open bar), but this was in a per01background, and the phase was opposite to that of PER cycling in wild type. In all other cases, the majority of the pairs showed equal staining intensities at both time points (Fig. 6). We also performed anti-β-GAL antibody stainings at different ZTs on SG3 flies (in aper+ genetic background); again, the results indicated noncycling (data not shown).
In the case of the BG fusion protein, oscillations in the reporter signals were clearly detectable in a per+background (Figs. 7, 8, 9). Strong staining in PRs, glia, and LNs was observed in BG/TM2 flies at ZT3 and ZT21, whereas only weak signals in these tissues were observed at ZT9 and ZT15 (Fig.7, left column). Interestingly, it seemed that the signal intensity in the LNs of per01BG/TM2 flies was also cycling; whereas prominent staining in the eyes and in glia was observed at all times, neuronal staining was clearly reduced at ZT9 (Fig. 7, right column). To confirm these observations, coded sections were scored blindly by three observers according to the strength of the staining signal in the three differentper-expressing cell types. The result of this quantification revealed robust cycling in all three cell types in theper+ genetic background (Fig.8A,C,E) and appreciable (but relatively low-amplitude) fluctuations of LN expression in the per01 background (Fig. 8B). The peaks of expression in all three cell types (in the per+ background) were at ZT21 and ZT3, whereas the trough values were observed at ZT9 and ZT15. This is in good agreement with PER’s immunohistochemically determined cycling in wild type; Zerr et al. (1990) reported peak expression at ∼ZT24 and minimal expression at ∼ZT12. Inper01, the weakest BG-mediated staining in the LNs was observed at ZT9; but in contrast to the results from per+ BG flies, staining was again prominent at ZT15 (Figs. 7 and 8B). In PR and glia cells, the staining intensities in per01 BG were constantly high (∼three-fourths of the peak values from theper+ flies) (Fig.8D,F).

Cycling immunoreactivity of the BG fusion protein. Males carrying this transgene heterozygous with theTM2 balancer and, expressing either per+ orper01, were sectioned and stained with anti-β-GAL antibodies. All sections shown are at the level of the esophagus, where strong staining of the ventral group of LNs (LNv) can be observed at a high time point (compare Fig. 3). LNv are marked by arrows, glia cells by arrowheads. The left column shows staining in a per+ background at four different ZTs; at ZT3, strong staining of the LNv, glia, and PR cell nuclei can be observed. Scale bar, 20 μm. At ZT9, only weak staining in all three cell types is detectable. Scale bar, 40 μm. At ZT15 staining is still weak in the LNv and glia cells, although the signal in the cytoplasm of the PRs seems stronger compared with ZT9 (the magnification for both of these time points is the same); staining in all three cell types is again very prominent at ZT21. Scale bar, 12.5 μm. The temporal pattern in theper01 background (right column) differs from that just described. At ZT3, prominent staining in the LNv, glia, and nuclei of the PRs is visible, in contrast to the per+-expressing flies, and the staining intensity in the PRs and glia remains at a high level at ZT9. Only the LNv show a decrease in signal strength at that time point. At ZT15, the staining became stronger again in the LNv and remained high in PRs and glia. At ZT21, staining intensities in all three cell types was as high as in the per+ background. Magnifications for allper01 time points are as inper+ at ZT3.

Temporal staining pattern of another BG transgenic strain. Males from the BG6 line (see Materials and Methods) for which the genetic backgrounds were either per+ orper01 were sectioned and stained with anti-β-GAL. In per+, only weak staining of the LNv (arrow) and PRs was observed at ZT9. Staining in glia was nearly undetectable at this time point. At ZT21, strong staining in the LNv(arrow) and PRs, as well as weak staining in glia (in the lamina and bordering the medulla), can be observed. Inper01, only light staining of the LNv is observed at ZT9 (arrow). In contrast to the expression of BG6 in theper+ background, there is also prominent staining in the nuclei of the PRs and glia cells (arrowhead). At ZT21, LNv are strongly labeled, whereas the signal intensities in the PRs and glia seem to be only slightly stronger compared with ZT9. Scale bar, 25 μm.
To ask whether fusion protein cycling apparently can be controlled by BG itself or is attributable to position effects (i.e., operating in the BG/TM2 strain), additional experiments were performed using an independent transgenic line (BG6) in bothper+ andper01 backgrounds. The fusion protein expression pattern was very similar to that described for BG/TM2 except for the reduced number of glial cells that were stained in the BG6 line (compare ZT21 in Figs. 7 and9). Temporal expression analysis revealed clear differences in staining intensity between flies sectioned at ZT9 and ZT21 (Fig. 9). In the per+ background, staining was stronger at ZT21 in all three cell types (Fig. 9, left column). Inper01, cycling of the BG fusion protein was detectable in the LNs; in addition, and unlike what was observed in the experiments using the BG/TM2strain, the signal appeared to fluctuate in the PRs as well (Fig. 9,right column).
We conclude that the additional 230 amino acids present in BG are sufficient to drive rhythmic oscillations of that fusion protein in a PER-like manner. In a per+ background, cycling seems to occur in the same cells and with similar phase as for PER fluctuations in wild-type flies. Cycling in aper01 background is less robust and may be restricted to neurons; yet, the BG fusion protein fluctuates in a circadian fashion, independently of PER function.
To determine whether the additional per-coding sequences that are present in XLG flies influence protein cycling, the polypeptide encoded by this fusion gene was monitored temporally. First we stained sections from both XLG transgenic lines (XLG-A and XLG-B) at ZT9 and ZT21. As expected, a strong increase in staining intensity could be observed in the LNs late at night (Fig.10A). Staining in the PRs was weak at ZT9 and increased only slightly at ZT21 (note also that the staining is not restricted to the PR nuclei; compare Fig. 4). Glial staining was not detectable at the low time point and was faintly visible at ZT21; this was expected, given the expression pattern of this transgene late at night (Fig. 4). In a per01background, cycling occurred in the LNs in both transgenic lines. In the weaker-expressing XLG-A line, no staining was detectable in the LNs at ZT9 (Fig. 10B). In contrast to theper+ background, there appeared to be more robust fluctuations of staining intensity in the PRs; in addition, staining of glia in the outer rim of the medulla became clearly detectable at ZT21 (Fig. 10B, bottom row). Thus, it seems as if the general expression level might be higher in the mutant genetic background. The fact that this fusion protein consistently cycled in PR and glia cells in aper01 background (in contrast to BG) suggests that the additional C-terminal sequences are necessary to achieve a rhythmic expression pattern that better reflects the wild-type pattern.
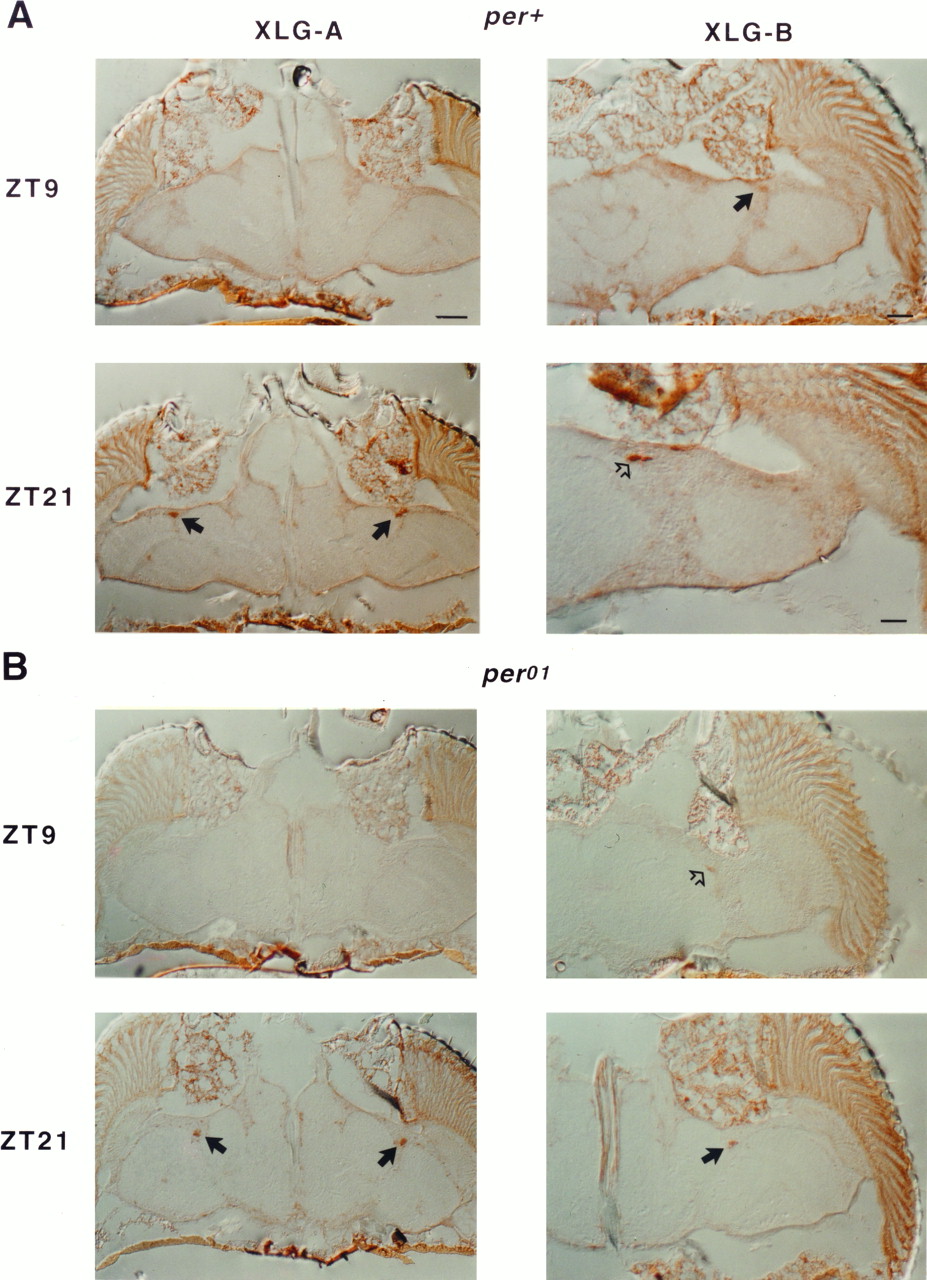
Temporal expression pattern of XLG transgenic flies. Males carrying the XLG construct (lines XLG-A and XLG-B) each with per+ (A) orper01 (B) were sectioned and stained with anti-β-GAL. A, In XLG-A, only weak cytoplasmic staining in the PRs is visible at ZT9. Scale bar, 40 μm. At ZT21, prominent staining in the LNv(arrows) is detectable, whereas staining in PRs seems only slightly increased compared with ZT9 and is mainly cytoplasmic. Glia staining at this high time point is just above the limit of detection. Magnification is as at ZT9. For the XLG-B line, similar expression patterns were observed. In LNv at ZT9, the signal was barely detectable (solid arrow), whereas prominent staining of the dorsal group of LNs (LNd) appears at ZT21 (open arrow). Scale bars: ZT9, 25 μm; ZT21, 12.5 μm. B, In theper01 background, no XLG-A-mediated expression was detectable in LNs and glia at ZT9. As inper+, there was only weak cytoplasmic PR staining at this time point. At ZT21, strong staining in the LNv (arrows) as well as in glia and PRs is visible. Magnifications are the same as for XLG-A (per+). For the XLG-B line, similar signal fluctuations were observed, although weak staining of the LNd (open arrow) was detectable at ZT9. Thesolid arrow at ZT21 points to a group of LNvshowing strong expression of the XLG-B fusion protein. Magnifications are as in XLG-B (per+) at ZT9.
To quantify XLG-encoded protein levels, we performed immunoblottings with head extracts from both transgenic strains. XLG-A and XLG-B flies, carrying per+ orper01 in their genetic backgrounds, were collected at six different ZTs. Head protein extracts were separated on polyacrylamide gels. The ensuing Western blots, to which an anti-PER antibody was applied, were developed and the signals quantified (see Materials and Methods). This anti-PER reagent revealed circadian fluctuations of endogenous PER protein in abundance in both XLG transgenic lines. As has been reported for wild-type flies, maximum amounts of PER were detected between ZT18 and ZT22, and minimal levels were present between ZT6 and ZT10 (Fig.11A,C,D) (cf. Zeng et al., 1994). Temporally dependent protein mobility shifts were also observed, again as reported previously (Edery et al., 1994). These shifts are caused by phosphorylation; the faster-migrating form (∼155 kDa) becomes phosphorylated, resulting eventually in the most slowly migrating one (∼190 kDa) (Edery et al., 1994). In agreement with the earlier study, only the faster migrating form of PER is present at the beginning of the accumulating phase (ZT10–ZT14) (Fig.11A). At ZT18, the first slower-migrating (phosphorylated) forms become visible, becoming predominant at ZT22. At ZT2, only the phosphorylated forms are present and at ZT6, both forms are present at very low levels (Fig. 11A).
The PER antibody also detected the XLG fusion protein, which is expressed at similar levels and shows circadian fluctuations in abundance as PER in both per+ andper01 genetic backgrounds (Fig.11A,C,D). In addition to cycling with identical phase, the turnover of XLG occurs with a PER-like amplitude in a per+ background (see legend to Fig. 11C,D). In contrast, the amplitude is reduced by >50% in a per01background (XLG-A, 1.5-fold; XLG-B, twofold) (Fig.11D), indicating that endogenous PER is necessary to achieve full-amplitude cycling of the XLG fusion protein. The lower amplitude is attributable to higher protein concentrations at trough times of expression rather than lower levels at peak times (compare ZT2 and ZT6 of per+ with the sameper01-based time points) (Fig.11A). Mobility shifts of the XLG proteins were also detectable in both genetic backgrounds, similar to those described for PER (Fig.11A). The shifts were not as drastic as observed for PER, perhaps because the resolution of small mobility differences for the ∼300 kDa XLG fusion protein is not as good as for the smaller PER polypeptide. (However, the shifts were still obvious; compare ZT2 and ZT14 in Fig. 11A; the faster-migrating form is clearly absent at ZT2 in both genetic backgrounds.)
When the same blots were incubated with anti-β-GAL antibodies, similar fluctuations in abundance and mobility shifts of the fusion protein were observed (Fig. 11B). For unknown reasons, the amplitude of the molecular rhythm was higher in both genetic backgrounds, compared with those resulting from application of anti-PER (see legend to Fig. 11E). Nevertheless, the reduction of amplitude in theper01 background was in the same range as observed with anti-PER antibody (>50%) (Fig.11E), indicating that the differences obtained with both antibodies were only relative. To confirm these results, a second, independent experiment was performed using a different collection of flies and anti-β-GAL antibody. In this experiment, cycling in XLG-A (XLG-B) flies occurred with eightfold (ninefold) amplitude inper+ and twofold (threefold) amplitude in aper01 genetic background; thus, the amplitude reduction observed in aper01 background is real (Fig.11F).
In addition to the ∼300 kDa XLG fusion protein band, a smaller ∼116 kDa band was present in blots incubated with anti-β-GAL antibody. These smaller band comigrates with the actual Escherichia coli β-GAL protein, included as a molecular weight marker (Fig.11B). Because this band is present in all lanes containing extracts from XLG transgenic flies, but absent inper+ andper01 control flies, it is very likely derived from the fusion protein. It is possible that the 116 kDa band is a degradation product resulting from the cyclical turnover of the PER–β-GAL fusion protein. As expected from the long half-life of β-GAL activity in Drosophila (Monsma et al., 1988), no daily fluctuations of its abundance could be observed (Fig.11B; also data not shown). Note also that the relatively small polypeptide is more abundant than suggested by the blot shown in Figure 11B; to transfer the large XLG proteins quantitatively, unusually long protein transfers were necessary, resulting in a substantial loss of the smaller β-GAL protein (data not shown) (see also Materials and Methods). High amounts of this protein are usually present in protein extracts of flies carrying fusion genes encoding PER–β-GAL fusion proteins that undergo circadian fluctuations (e.g., in BG flies). In contrast, in transgenics for which the fusion proteins do not cycle the relative abundance of β-GAL is much lower (e.g., SG), indicating that rhythmic fluctuations of PER–β-GAL fusion proteins result in increased amounts of free β-GAL, probably attributable to circadianly regulated protein degradation (Dembinska et al., 1997).
Given these results, the anti-β-GAL antibody stainings might not reveal the intracellular distribution of the fusion proteins, because the observed staining patterns probably result from detection of both the intact fusion proteins and β-GAL, which would not necessarily be co-localized. To address this matter, we performed stainings of BG and XLG flies (in which the β-GAL is abundant on Western blots) with anti-PER antibodies in aper01 mutant background, detecting only the intact fusion proteins.per01 XLG-B males were stained at ZT15 (n = 4) and ZT21 (n = 4) andper01 BG/TM2 males at ZT16 (n = 3) and ZT20 (n = 2), respectively. The results of these preliminary experiments indicate that the fusion proteins were present in both the cytoplasm and the nucleus at times when staining should be restricted to either one of these compartments (cytoplasmic at ZT15/ZT16, nuclear at ZT20/ZT21) (Curtin et al., 1995). Therefore, we conclude that the anti-β-GAL stainings performed in this study reflect (at least qualitatively) the intracellular distribution of the intact BG and XLG fusion proteins and that this distribution is different from that of PER; for example, the fusion proteins do not exhibit obvious circadianly regulated shifts from the cytoplasm into the nucleus (cf. Curtin et al., 1995).
Locomotor activity behavior
To test whether the observed cycling or noncycling of the different per–lacZ fusion proteins has biological consequences, we studied the locomotor activity ofper+ andper01 flies that carried either an SG, BG, or XLG transgene. Because the histological and immunoblot experiments were performed exclusively on flies kept under LD cycling conditions (see above), we focused especially on the locomotor behavior recorded from (male) flies kept under the same 12:12 hr LD regime. In LD, wild-type flies show increasing locomotor activity before lights on in the morning and especially before lights off in the evening, whereasper01 flies simply react to the environmental changes by increasing their activity after the lights go on or off (Hamblen-Coyle et al., 1992; Wheeler et al., 1993) (Fig.12A,G,insets).
SG and BG transgenics
As expected, both SG transgenic lines showed clear anticipation of the morning and evening light transitions when tested in theper+ background (Fig.12A,B). The phase of the morning activity peak was in both cases in the range of the wild-type controls. Interestingly, the phase of the evening peak differed significantly from control values in both SG3 and SG10; the transgenics’ phase for the evening activity peak was 2.0 and 1.1 hr earlier, respectively, when compared with the relevant controls (Fig.12A,B; Table 1).
The two BG transgenic lines exhibited a behavior similar to that just described for SG. In the per+ background, BG flies anticipated the environmental changes and also showed an earlier than normal phase of the evening peak. The phase advance associated with the BG-lacZ transgene was not as extreme as in SG, being 1.1 hr (BG/TM2) and 0.8 hr (BG6) earlier compared with the wild-type controls; but the transgenics values were still significantly different from the controls (Fig.12C,D; Table 1). The fact that all SG and BG transgenic strains tested manifest a clear phase advance of their evening activity peaks shows that these fusion proteins influence behavior, possibly by interfering with the product of the endogenousper gene or with a PER protein partner (cf. Vosshall et al., 1994; Gekakis et al., 1995; Zeng et al., 1996). The cyclical expression of the BG fusion protein, in contrast to SG’s temporal constancy, might explain BG’s milder impact on behavior.
Despite the fact that both the SG and BG transgenics manifest significant phase advances of their evening activity peaks, their free-running locomotor activity periods were close to that of the relevant controls. Under DD conditions, the periods of SG10 and SG3 transgenic flies were 1.3 and 0.3 hr shorter compared with their controls (the difference was significant) (Table 1). In the case of BG/TM2 and BG6, periods were significantly shortened by 0.4 and 0.8 hr, respectively, compared with the period of theper+ (ry506-marked) control (Table 1). These weak effects on free-running behavior contrast with those of the perS mutation; compared with wild-type, this mutant shows a phase advance of 2.6–2.9 hr (Hamblen-Coyle et al., 1992), similar to the earlier than normal evening peak in per+ SG flies (Table 1); butperS’s free-running locomotor activity period is 5 hr shorter than normal (Konopka and Benzer, 1971).
SG and BG transgenics did influence wild-type free-running behavior in addition to the mild period-shortening effects; only ∼70-80% of the two SG transgenics and the BG/TM2 flies were rhythmic in aper+ genetic background, whereas in all theper+ controls, 100% of the individuals were rhythmic (Table 1). The transgenes’ impact on normal behavior was especially prominent in one experiment, in which the flies were kept for 14 d in LD (instead of 7 d in all other experiments) before the transition to DD occurred. In this prolonged behavioral test, 43% of the SG3 transgenics and 56% of the BG/TM2flies were arrhythmic in DD, suggesting that older flies are more sensitive to the presence of the SG and BG fusion proteins. SG10 and BG6 transgenics were only tested after 7 d of LD entrainment, and their percentages of rhythmicity in subsequent DD were 83 and 100%.
In a per01 background, SG3 and SG10 transgenic flies did not anticipate the LD transitions and, like the per01 controls, showed increases in locomotor activity that seemed to be mere responses to the environmental transitions (data not shown) (Fig. 12G,inset). In the same mutant background, the BG fusion protein is rhythmically expressed in the per LNs in both BG transgenic strains (see above); and rhythmic expression of the complete PER protein (encoded by a promotorless 7.2 kb genomic perconstruct) in these pacemaker neurons is sufficient to restore free-running rhythmic locomotor behavior inper01 flies (Frisch et al., 1994). However, no such (behavioral) rescue was observed in the case of the two lines transformed with the BG construct. As was found for SG, both BG/TM2 and BG6 flies simply reacted to the environmental changes (Fig. 12C,D, insets). Thus, rhythmic expression of the truncated, β-GAL-carrying PER protein is not sufficient to restore normal LD behavior to the arrhythmic per01 mutant.
As expected from these results, both SG and BG transgenic strains also did not rescue arrhythmic locomotor activity behavior under free-running (DD) conditions; all animals that were tested under these conditions were as arrhythmic as theper01 controls (Table 1).
XLG transgenics
In contrast to the SG and BG transgenic types described above, the XLG transgene encodes for the whole PER protein with exception of the last 10 amino acids (see Materials and Methods). Here, the rhythmic expression of this PER–β-GAL fusion protein in bothper+ andper01 backgrounds (see above) is correlated with the behavioral results; per+ XLG flies, tested under LD conditions, anticipated the light regime changes in the morning and evening, as normal flies do. But, as noted previously for the SG and BG strains, the XLGs showed a phase advance of the evening activity peak of 0.6 hr (XLG-A) and 0.8 hr (XLG-B), respectively, compared with the control flies (Fig.12E,F; Table 1). This difference was significant for both XLG lines (see legend to Table 1). These mild phase advances (in LD conditions) were loosely correlated with an effect on free-running behavior; the periods observed under DD were 0.3 hr (XLG-A) and 0.7 hr (XLG-B) shorter than in theper+ (nontransgenic) control. (Both strains were in fact significantly different from Df(1)w control; see Table 1.) In addition, a mild impact on general rhythmicity was observed in one of these strains; 91% of the XLG-A flies were rhythmic under free-running conditions (Table 1).
To determine whether the XLG transgenics could restore rhythmic behavior in per01 flies, we first tested the locomotor activity behavior ofper01 XLG in LD conditions; wild-type-like anticipations of the environmental changes were observed in both of the XLG lines (in XLG-A flies, however, only anticipation of the LD transition in the evening was observed) (Fig. 12G). Interestingly, the phase of the evening peaks was even more advanced than it was for the same transgenes in a per+background: 2.1 hr earlier forper01 XLG-A and 2.6 hr earlier in the case of per01 XLG-B (Fig.12G,H; Table 1). In addition, these transgenic adults showed a second and rather striking increase in locomotor activity just after the lights went on in the morning and off again in the evening; this is what occurs inper01 (Fig.12G,H). Therefore, it appears as if the LD behavior of per01 flies, influenced by the XLG transgene, consists of two components: a “rescued” component, revealed by the anticipation of (at least) the LD transition, and a “mutant” component, reflected by the prominent reaction to the LD and LD transitions. It is important to note that these complex behavioral patterns were observed for individual flies (Figs. 12H, inset, 13) and are not a reflection of two XLG subpopulations in a given experiment (one acting quasi-normally, the other acting likeper01).

Entrained and free-running behavior ofper01 XLG flies. Rhythmic and arrhythmic individuals are exemplified. Each panel (in itsleft side) shows a double-plotted actogram (successive days of activity are displayed horizontally and vertically) for a fly that was monitored in 12:12 hr LD conditions for 7 d, followed by ≥10 d of additional monitoring in DD. The transition to DD is marked by an arrow. Activity plots (averaged per day; compare Fig. 12) for the time the fly was in LD accompany the actograms, as do plots of χ2 periodograms (Sokolove and Bushell, 1978; Hamblen et al., 1986) computed for the DD portion of the run. Peak values indicate the best estimate of the flies’ free-running periods; the periodogram allows an estimation of the “power” (difference between the peak and the 5% significance line, measured in arbitrary units) and “width” (number of the 0.5 hr time bins at the sloping line that defines the 5% significant level). These metrics are indicators of the strength of a given fly’s rhythm (cf. Liu et al., 1991; Ewer et al., 1992). A, A rhythmicper01 XLG-A male, showing complex LD behavior, as depicted for the population average of this genotype (Fig. 12G); a power of 36.9 and a width of 4 classified this fly as rhythmic (period = 18.5). B, An arrhythmic per01 XLG-A male. This individual was classified arrhythmic in this manner, because the power and width were each 1 where the χ2 line hit the 5% significance level. C, A rhythmicper01 XLG-B male (period = 22.5) with a power of 63.8 and width of 9; the strength of this rhythm is close to that of wild-type flies (cf. Ewer et al., 1992).D, A per01XLG-B male, classified as arrhythmic in that the χ2 periodogram led to neither a positive power nor width value.
The LD behavior of the per01 XLG flies just described is most likely the result of the weak, hence, incomplete rescue that was effected by the XLG transgenes. This was also concluded from analyzing the free-running behavior ofper01 mutants carrying thisper–lacZ construct. Only 24% of theper01;XLG-A and 20% of theper01;XLG-B males tested were significantly rhythmic in DD (e.g., Fig. 13), with average periods of ∼25 and 22 hr, respectively. The variations in these mean values were large (Table 1). Reasons that might explain the poor rescue qualities of this fusion protein are discussed below.
DISCUSSION
The spatial expression of the SG, BG, and XLG fusion proteins is mainly restricted to per-expressing cells or to a subset of them. Only the SG transgenics show expression in some glia cells that have not been described to express per (Fig. 2). A reason for detection of these additional cells might be the generally higher expression level (compared with PER) of SG in glia cells; thus, these cells could express per in wild-type but were not identified in anti-PER antibody stainings owing to naturally low expression levels. It is not known why SG appears at relatively low levels in the LNs; a possible explanation is that this fusion protein is distributed throughout the neurons, including nucleus, soma, and axonal processes. Nevertheless, expression in SG neurons is likely to be reduced, compared with the strong expression in the PR cells, in which the signal is indeed spread through the cells and their processes (Fig. 2). Expression of the BG fusion protein most closely reflects the spatial expression pattern of PER as well as its staining intensity in the different cell types.
The prominent BG expression in per neurons at ZT21 is not restricted to the nucleus, indicating that the intracellular localization of this fusion protein does not reflect that of PER (cf.Curtin et al., 1995). This difference is not the result of free β-GAL in addition to the full-length fusion protein, because anti-PER stainings of transgenics (in aper01 background) gave similar results. Because the XLG fusion protein shows the same intracellular distribution as BG, the failure to move completely into the nucleus is not attributable to the missing one-third of PER residues in the latter. Instead, we suggest that the β-GAL portion of the fusion protein interferes with the ability to translocate efficiently into the nucleus, probably by faulty protein–protein interactions.
All three fusion genes analyzed in this study contain the PAS domain, shown to be an important element for PER–TIM dimerization (Gekakis et al., 1995). The PER–TIM complex is present between ZT16 and ZT20, and the whole complex shifts into the nucleus at ∼ZT18 (Lee et al., 1996;Zeng et al., 1996). Removal of either PER or TIM from the complex leads to predominantly cytoplasmic distribution of the respective partner (Vosshall et al., 1994; Hunter-Ensor et al., 1996; Myers et al., 1996). The SG fusion protein is located in the cytoplasm of PR and glia cells of tim01 flies; it is partly nuclear intim+, indicating that SG, and therefore probably the bigger BG and XLG fusion proteins as well, can interact with thetim gene product (Fig. 2) (Vosshall et al., 1994). Nevertheless, these putative interactions are not sufficient to translocate the fusion proteins into the nucleus efficiently. The mobility shifts we observed suggest that the XLG fusion protein is phosphorylated in a PER-like manner. This makes it unlikely that increasing phosphorylation is crucial for nuclear entry; thus, other mechanisms would be disrupted with respect to the fusion proteins’ subcellular behavior.
The SG fusion protein is expressed in a constant manner. Yet, it has been reported that the β-GAL activity of this protein cycles in aper+ background (Zwiebel et al., 1991). This previous observation was incorrect (Fig. 5) (Dembinska et al., 1997). The mRNA coding for the SG protein does undergo per-like circadian fluctuations (Zwiebel et al., 1991), suggesting that the protein is synthesized in a periodic manner. The fact that we observe constant SG protein expression is probably attributable to the missing PER sequences in SG; that is, the absence of C-terminal residues make this protein more stable than PER.
The BG fusion protein, which contains an additional 230 amino acids, cycles in both genetic backgrounds in the LNs, and in PR and glia cells in per+. The robust cycling observed in aper+ background implicates the following two features of the BG fusion gene: (1) its RNA should cycle (as does the shorter SG fusion transcript), which could contribute to rhythmic expression of the protein, and (2) the BG protein must be able to turn over in a PER-like manner, owing to the additional 230 amino acids (compared with SG). These residues seem to contain sequences that permit the fusion protein to be degraded in a relatively rapid manner, such that its half-life is short enough for the protein to exhibit troughs in its cycling (cf. Wood, 1995). For example, BG contains two possible PEST sequences, whereas SG contains only one. (PER contains four possible PESTs, which are all included in the XLG construct; Fig.1.) PEST sequences have been implicated in fast protein degradation (Rogers et al., 1986) and do seem to function in this manner inDrosophila (Belvin et al., 1995).
That BG cycles in a per01background indicates some per-independent function of this protein. But why is it cycling less robustly and only in the LNs? The fact that BG is expressed at high levels in all other cells throughout the circadian cycle suggests that the molecular feedback loop, in which PER is thought to repress its own transcription (Hardin et al., 1990), is not functional in per01 BG flies. Indeed, no RNA cycling could be observed inper01 flies transformed with a BG–luciferase transgene (R. Stanewsky, unpublished observations). The BG protein cycling in LNs therefore is most likely a consequence of rhythmic protein degradation in these cells. One factor responsible for this turnover might be the light-induced degradation of the TIM protein (Hunter-Ensor et al., 1996; Lee et al., 1996; Myers et al., 1996; Zeng et al., 1996). TIM continues to cycle (with a low amplitude) in aper01 background under LD conditions (Zeng et al., 1996); this is probably the driving force for the BG turnover in that mutant background, given that TIM is necessary to stabilize PER. It is also possible that the molecular feedback loop is functional only in the LNs and that rhythmic RNA expression remained undetected because the majority of transcripts (in PRs and glia) do not cycle. In any case, our results indicate another special feature of the LNs (cf. Frisch et al., 1994): these cells uniquely allow this PER fusion protein to undergo daily oscillations in its abundance.
The XLG fusion protein cycles robustly (Figs. 10, 11). In contrast to BG, it also cycles in PR and glia cells in aper01 background, which might explain the high amplitude of cycling observed in Western blots. A reason for the robust (PER-independent) cycling could be that XLG is more degradable because of the additional C-terminal sequences, which include two additional PEST sequences (including the most conserved one; see Fig. 1). But the fact that both BG and XLG show the same robust cycling in our histochemical experiments in aper+ background and that XLG (inper+) cycles with the same amplitude as endogenous PER (Fig. 11) indicate that both fusion proteins are equally degradable. This suggests that the robust cycling of XLG (compared with BG) in a per01 background is attributable to functional elements associated with the additional amino acids contained in XLG, which allow this protein to regulate its own transcription and, therefore, be synthesized in a rhythmic manner. We therefore expect that XLG RNA cycles in aper01 background and, given the PER-like temporal mobility shifts, believe that this transgene can at least partially fulfill PER’s function in the molecular feedback loop.
Consistent with this hypothesis, XLG is able to mediate a biological clock function in per01 flies, although only in a mediocre manner (Figs. 12, 13). The behavioral phase advances observed for per01;XLG flies (Table 1) indicate that XLG is not able to control locomotor behavior properly. This is also indicated by the prominentper01-like increase of locomotor behavior observed in the same individuals at the times of LD transitions (cf. Wheeler et al., 1993). The same has been observed in certain other per mutants associated with weak clock function, such as perL (cf. Dowse and Ringo, 1987). perL flies show a prominent increase in locomotor activity after the environmental transitions, in addition to their characteristic evening activity peak 5–6 hr after the lights go off (Hamblen-Coyle et al., 1992). Thus, one aspect of “strong” clock function (newly revealed here) is to suppress the rapid increases in locomotion that accompany these environmental transitions.
As expected from the LD behavior of XLG flies, only a low percentage of these transgenic individuals showed rhythmic behavior under free-running conditions; the periods were spread over a wide range and were associated with a weak overall rhythmicity (Figs.12G,H, 13; Table 1).
Two possibilities could explain the poor rescue qualities of the XLG construct. First, the XLG protein, although it exhibits most of the PER attributes thought to be important in establishing a molecular feedback loop, may possess anomalies (inadequacies, or malfunctions, stemming from the fused β-GAL part of the protein or the C-terminal truncation) that lead to a poor function of that loop. Second, XLG may function well to establish the cycling molecular oscillator but functions subnormally in regulating clock-controlled genes (genes for which the expression cycles are per-dependent and may be within output pathways to locomotor behavior) (for review, see van Gelder and Krasnow, 1996).
All three fusion proteins influenced normal locomotor behavior (Fig.12; Table 1), indicating that they interfere with the endogenous PER protein function. During the accumulating phase of the PER–TIM complex (between ZT16 and ZT20), twice as much TIM as PER is present in head extracts (approximately half of it bound to PER), indicating that there is a substantial amount of free TIM present at this cycle-time (Zeng et al., 1996). Because the fusion proteins probably interact quasi-normally with TIM (see above), it is possible that inper+ SG, BG, or XLG flies, the sum of PER–TIM and SG/BG/XLG–TIM complexes is at higher level than that of PER–TIM complexes in wild-type flies. In other words, biological relevant complex concentration would be reached earlier in the transgenic flies compared with genetically normal ones. The earlier accumulation of TIM complexes could cause the phase advances and period shortenings that were observed in the transgenics. This hypothesis can also explain why the phase advances in SG flies are more substantial compared with BG and XLG. SG does not cycle and does not have to undergo a rise in its level to form an inappropriately high concentration of SG–TIM complexes. These phenomena and suppositions could be related to the fact that extra copies of functional per alleles result in period shortenings (Smith and Konopka, 1982; Rutila et al., 1992).
In summary, our study has allowed us to map certain functions ofper to specific sequences of this clock gene. The fusion gene containing the smallest amount of per gives a quasi-normal spatial expression, but the fusion protein is not expressed in a rhythmic manner. The fusion containing an additional 230 amino acids exhibits a normal spatial expression pattern, and this protein undergoes PER-like circadian changes in abundance inper-expressing cell types, which occur independent of PER in the LNs. The fusion gene containing nearly all of per’s coding sequence shows rhythmic expression in allper-expressing cells, independent ofper+’s presence. Uniquely, the expression of this fusion gene’s products is correlated with rhythmic behavior, including that of flies otherwise lacking a functional form ofper.
Footnotes
This work was supported by National Institutes of Health Grant GM-33205 to J.H. and a postdoctoral fellowship from the Deutsche Forschungsgemeinschaft to R.S. We thank Maki Kaneko and Creston Jamison for assistance with the scoring of staining intensities and for comments on this manuscript, Jill Lefferson for helping to produce germline transformants, Neal White for behavioral analysis, and Ed Dougherty for photographic assistance.
Correspondence should be addressed to Dr. Jeffrey C. Hall, Department of Biology, 235 Bassine Building, Brandeis University, 415 South Street, Waltham, MA 02254-9110.
Dr. Brandes’ current address: Biozentrum der Universität Wien, 1030 Wien, Austria.


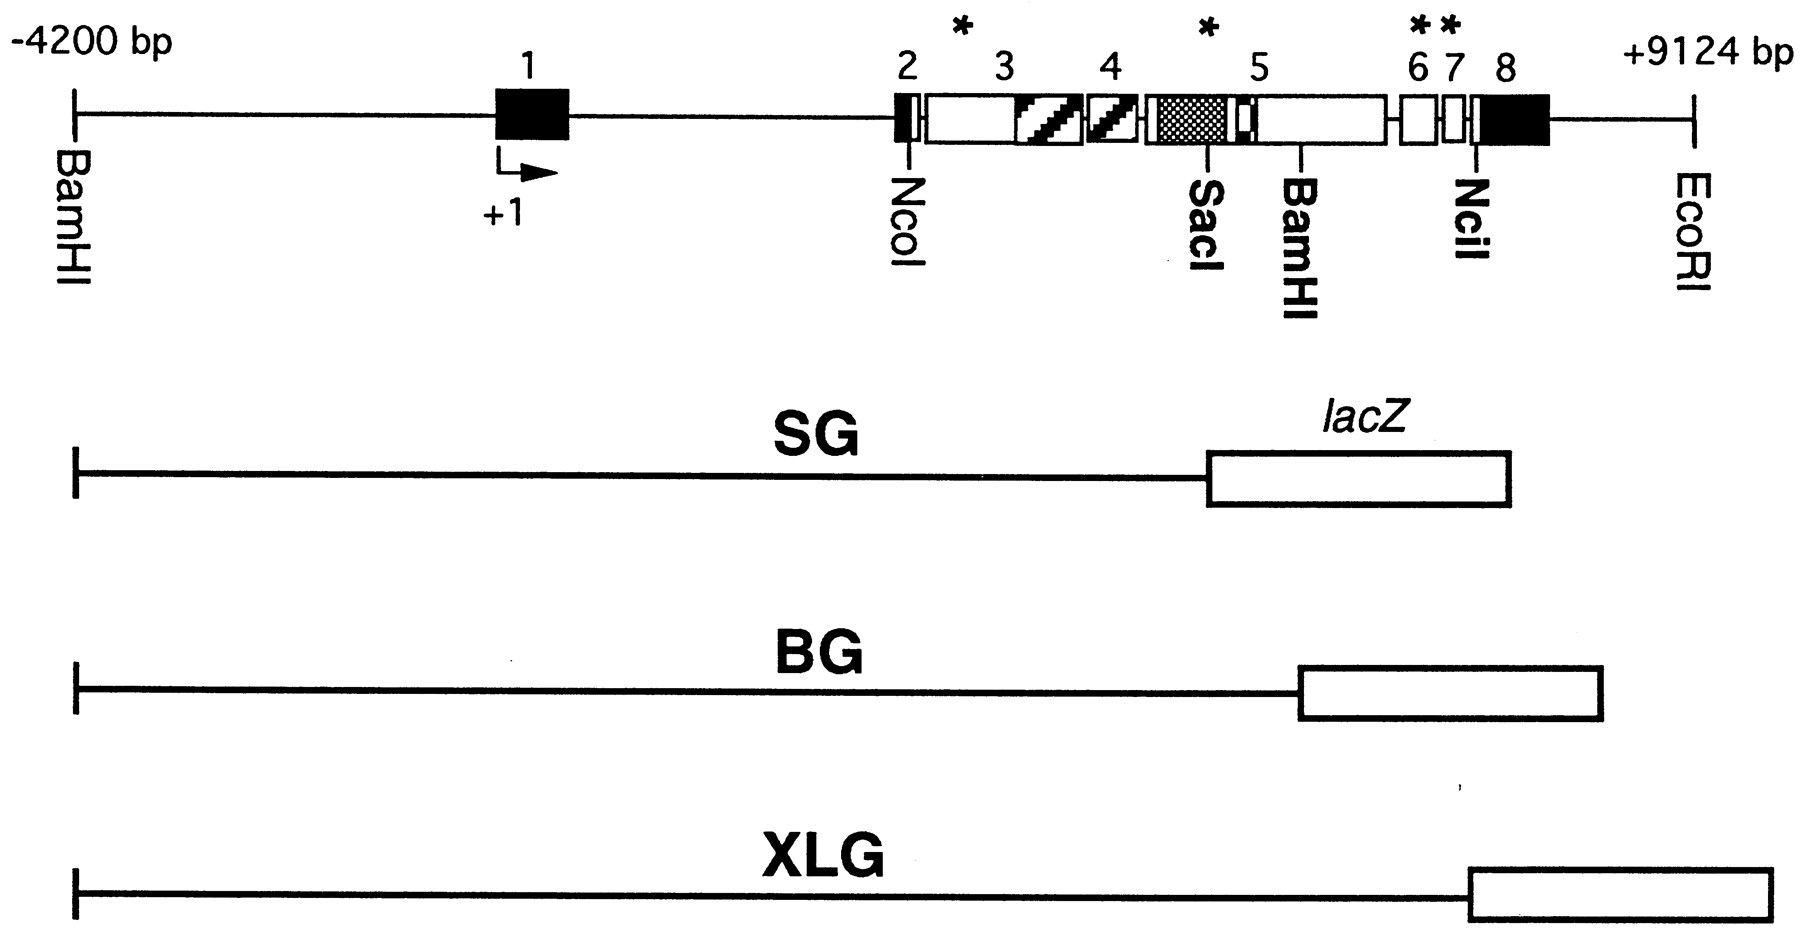