

Article Figures & Data
Figures
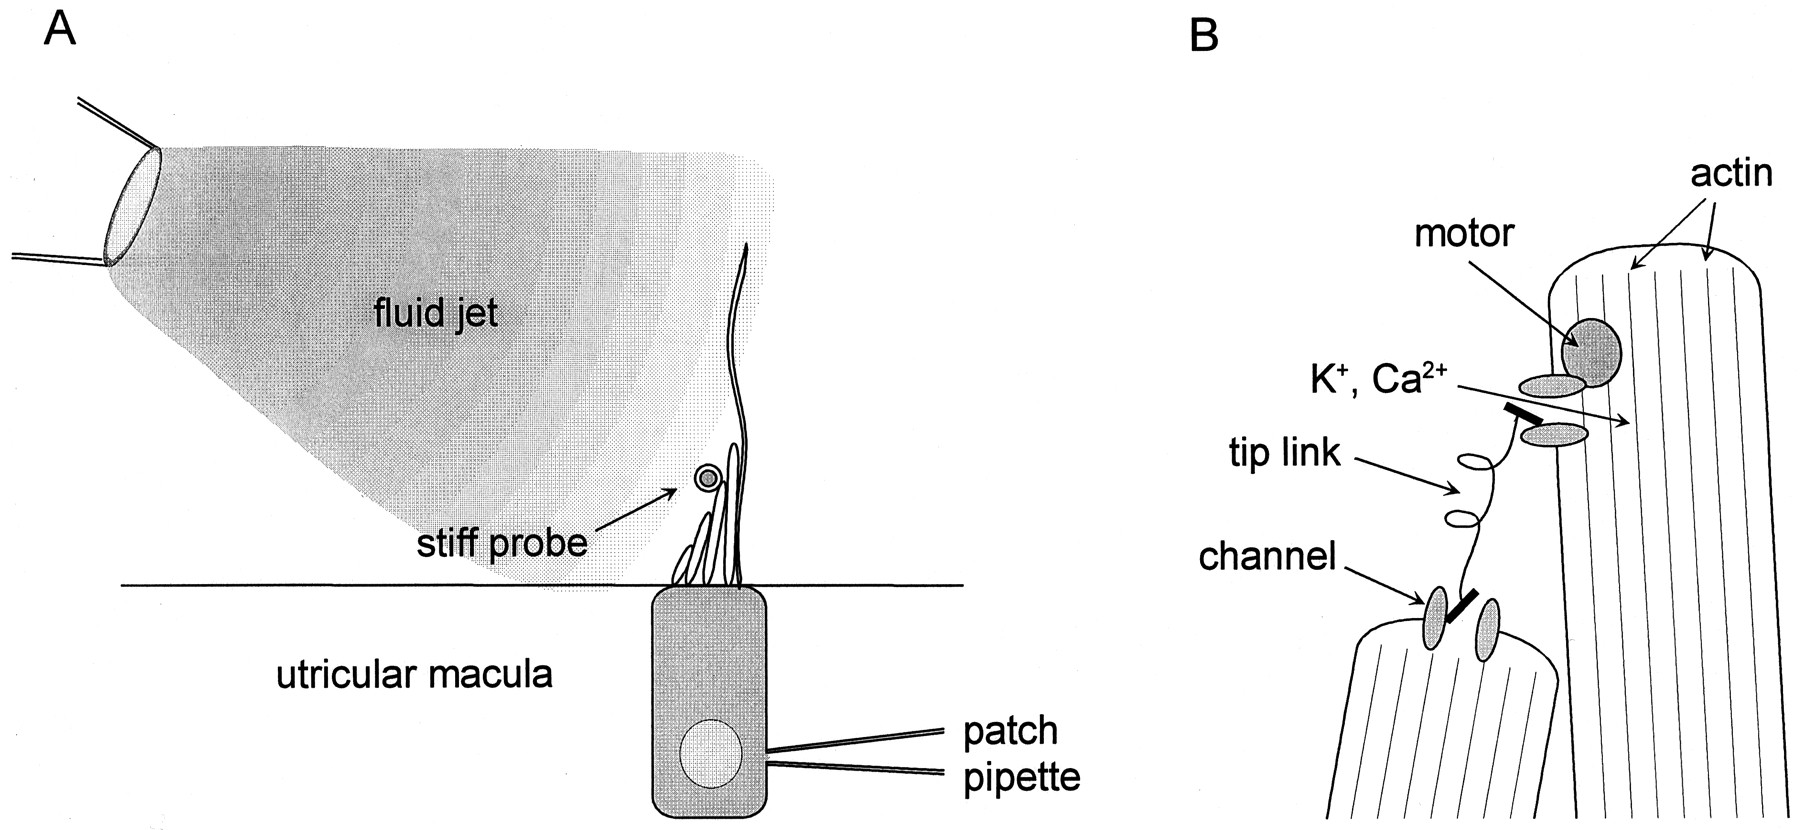
- Fig. 1.
Schematic diagrams of experimental configuration and model of transduction. A, Mouse utricular hair cells were recorded from in the intact epithelium. Hair bundles comprise several rows of stereocilia and a single kinocilium. On average, bundles were 13 μm tall at the tip of the tallest stereocilia. The kinocilia were often 20–30 μm long and lacked a kinociliary bulb. There were ∼60 stereocilia per bundle. The fluid jet was positioned ∼50 μm from the hair bundle. For some experiments a stiff glass probe, positioned near the tip of the stereocilia on the tapered side, was used to deflect the bundle. In this view the stiff glass probe is aligned perpendicular to the plane of the image. B, Expanded view of the tips of two stereocilia showing the transduction elements as envisioned in the motor model of adaptation. This model is based on work from other types of hair cells (for review, see Corey and Assad, 1992; Hudspeth and Gillespie, 1994).
- Fig. 2.
General features of transduction in mouse utricular hair cells. Data are from four different cells. Bundles were deflected by a fluid jet under pressure-clamp control. Traces are averages of 6–20 records. Scale bars apply to all data sets.A, Single trace evoked by a 0.9 μm bundle deflection. The dashed line shows the current on at the resting position of the bundle. Cell B970404, P4, unclassified.B, Family of currents evoked by the step stimuli shown in the bottom set of traces. These data are most representative in terms of the rate and extent of adaptation, maximum current (Imax), and the current on at rest (Irest) as a percentage ofImax. Cell A961127, P7, type II.C, Family of transduction currents chosen to illustrate the fastest adaptation we observed. Cell C961209, P8, type II.D, Family of currents with the slowest adaptation in our sample. Cell D970404, P4, unclassified.
- Fig. 3.
Current–deflection (I(X)) relations obtained with the fluid-jet stimulus. Peaks from current families like those of Figure 2B–D are plotted versus bundle deflection. The curves through the data are best fits of a second-order Boltzmann function (Eq. 1). Data are from three different cells.A, Of the 12 cells from which we obtainedI(X) relations, these data are most representative of the mean. The 10–90% operating range (OR) for this cell was 1.7 μm. Maximum current (Imax) was −118 pA, and the current on at rest (Irest) was 3.7% ofImax. Fit parameters wereP1, 0.37;P2, 0.88;A1, 3.07;A2, 2.07. Cell A970117, P9, type II.B, Data from the cell with the narrowestI(X) relation. OR, 0.68 μm; Imax, −125 pA;Irest, 3.0% ofImax. Fit parameters wereP1, 0.17;P2, 0.28;A1, 13.8;A2, 4.47. Cell F970114, P6, unclassified. C, Data from the cell with the broadestI(X) relation. OR, 2.3 μm; Imax, 229 pA;Irest, 7.0% ofImax. Fit parameters wereP1, 0.78;P2, 0.38;A1, 2.63;A2, 1.06. Cell C970404, P4, unclassified.
- Fig. 4.
Effects of adaptation on theI(X) relation obtained with fluid-jet stimuli. A, Two series of 10 msec test steps were delivered, one before and one 125 msec after the onset of a +1.3 μm conditioning step. The peak currents evoked by each series are plotted in B versus deflection. Traces are averages of five records. Cell A961127, P7, type II. B,I(X) curves generated from the data shown in A and additional traces not shown inA. The arrow indicates the size of the conditioning step. Parameters for the nonadaptedI(X) relation (circles) were OR, 1.0 μm;Imax, −97 pA;Irest, 5.9% ofImax;P1, 0.16;P2, 0.38;A1, 8.71;A2, 3.16. Parameters for the adaptedI(X) relation (squares) were OR, 1.4 μm;Imax, −64 pA;P1, 8.75;P2, 0.14;A1, 0.43;A2, 2.69. C, Protocol was identical to that of Fig. A except that the conditioning step was −0.9 μm. Peak currents are plotted inD versus deflection. Average of nine records. Cell C961209, P8, type II. D,I(X) curves generated from data of C. The arrow indicates the size of the conditioning step. Parameters for the nonadaptedI(X) relation (circles) were OR, 2.1 μm;Imax, −141 pA;Irest, 11%;P1, 0.72;P2, 1.19;A1, 3.61;A2, 1.57. Parameters for the adaptedI(X) relation (squares) were OR, 1.8 μm;Imax, −144 pA;P1, 7.4;P2, 10.8;A1, 1.14;A2, 0.29.
- Fig. 5.
Currents andI(X) relations recorded in response to stiff-probe stimulation. A, The trace is an average of 20 current records evoked by a +1.0 μm step. The rapid onset, adaptation, and rebound are qualitatively similar to that of Figure 2A. The dashed line shows the resting transduction current. Cell D970212, P7, type II.B, I(X) relations generated by a protocol similar to that in Fig.4A,B. The arrow indicates the size of the conditioning step. Current scale bar of A also applies to B. The nonadaptedI(X) curve (circles) was fit with a second-order Boltzmann function (Eq. 1) and had the following parameters: OR, 0.75 μm;Imax, −94 pA;Irest, 0.7% ofImax;P1, 0.25;P2, 0.39;A1, 14.5;A2, 4.05. The Boltzmann curve through the adapted I(X) relation (squares) was identical to the one used to fit the nonadapted I(X) relation except that it was shifted +1.2 μm along the deflection axis. Cell D970206, P1, unclassified. C, Rate of shift of theI(X) relation. TheI(X) relation was sampled at 5, 10, 20, 30, and 50 msec after onset of a conditioning step of +1.3 μm (arrow). Data points reflect the shift of the midpoint of each I(X) curve relative to the midpoint of the nonadaptedI(X) curve. A single-exponential function with a τ of 11.5 msec provided the best fit to the data. Cell D970212, P7, type II.
- Fig. 6.
Rate and extent of adaptation as measured by the inferred shift of the I(X) relation. Stiff-probe stimuli. Same cell throughout. Cell A970212, P7, type II. A, The shift required to align the nonadaptedI(X) relation with each data point of the current record is plotted versus time. The stimulus waveform is shown for comparison. B, Inferred shifts such as those in A are shown for step stimuli of 0.78, 1.05, and 1.31 μm. The data have been normalized to step size.C, Inferred shifts were calculated for a family of transduction currents. The steady-state inferred shift (measured at 250 msec) was plotted against deflection (circles). A linear regression was fit to the data with a slope of 0.73 (r = 0.98; solid line). Thedashed line indicates a slope of 1, i.e., a complete adaptive shift.
- Fig. 7.
Calcium dependence of adaptation. A +1.0 μm deflection evoked by a fluid jet. The hair cell was superfused with an external solution containing 100 μmCa2+, released by a wide-mouth pipette positioned ∼100 μm from the hair cell. The positive deflection was superimposed on a steady negative deflection of ∼500 nm, which closed all the transduction channels. The low Ca2+ solution nearly abolished adaptation. The videotaped images of bundle motion showed no effect of the superfusate on the fluid-jet stimulus. The return to 1.3 mm external Ca2+ restored adaptation. Cell A970403, P1, unclassified.
- Fig. 8.
Voltage-dependent bundle movement. A hair cell was held at −80 mV and stepped to +80 mV for 500 msec. Images focused near the tip of the bundle were recorded at each potential.A, A line scan across two bundles plots image intensity versus position. The peaks on the right are from the bundle of the voltage-clamped hair cell. The peaks on theleft (control) are from a nearby hair bundle in a cell that was not voltage-clamped. The thick line was recorded at −80 mV, and the thin line was recorded at +80 mV. Cell C970318, P8, type II. B, C, Expanded views of the control bundle (B) and the test bundle (C). The line is at −80 mV, and the symbols are at +80 mV.
- Fig. 9.
Transduction currents and receptor potentials evoked by sinusoidal stimuli. The top row of traces shows transduction currents evoked by 2.5 μm peak–peak sinusoidal stimuli. The frequency of stimulation is shown below. The bottom row of traces shows receptor potentials recorded in current-clamp mode in response to the same series of stimuli. Traces are averages of 2–16 records. Cell C970404 P4, unclassified.


