

Abstract
Synaptotagmin I is an abundant synaptic vesicle protein that has an essential function in mediating Ca2+-triggered neurotransmitter release. We have analyzed the distribution of four neural synaptotagmin isoforms during postnatal development of the rat CNS by in situ hybridization. Synaptotagmin I, II, III, and IV genes have distinct patterns of spatiotemporal expression except in cerebellum granule cells, where the four transcripts were detected during the formation of parallel fiber/Purkinje cell synapses. Throughout development synaptotagmin I mRNAs were widely expressed in brain, whereas synaptotagmin II transcripts were predominant in spinal cord. At all stages synaptotagmin III mRNAs were expressed uniformly in most neurons examined, although at a low level. Synaptotagmin I, II, and III gene expressions mainly increased during development and persisted in adulthood, mirroring neuronal differentiation. Conversely, synaptotagmin IV transcripts were predominant during perinatal development in a heterogeneous population of neurons and subsequently were expressed uniformly at a low level. Intense labeling was observed in the hippocampal CA3 field and in the subiculum, but not in the CA1 field, of the newborn rat. In cerebral cortex, lamina-specific labeling was detected with a high expression in cell layer V. Only a small number of Purkinje cell clusters were labeled in the flocculus and paraflocculus of the cerebellum. Heterogeneous sets of neurons expressing synaptotagmin IV gene also were observed in spinal cord. We thus speculate that synaptotagmin IV may a play a role in the development of the mammalian nervous system.
Calcium entry through voltage-gated channels triggers exocytosis of neurotransmitters from nerve terminals with millisecond latency. This implies the presence of sensor proteins that detect a rise in cytoplasmic calcium concentration and, consequently, promote the fusion of synaptic vesicles at the presynaptic plasma membrane. Persuasive evidence has been obtained that the synaptotagmins play a crucial role in the Ca2+-dependent regulation of neurosecretion (Geppert et al., 1994) (for review, see Littleton and Bellen, 1995).
Nine synaptotagmin isoforms have been reported in mammals (Perin et al., 1990; Geppert et al., 1991; Mizuta et al., 1994; Craxton and Goedert, 1995; Hudson and Birnbaum, 1995; Li et al., 1995; Vician et al., 1995). Current understanding of the biochemical properties and physiological role of the neural forms relies heavily on studies of synaptotagmin I. Synaptotagmin I is an abundant intrinsic membrane protein of synaptic vesicles. It possesses a short intravesicular N-terminal region, a single transmembrane segment, and a larger cytoplasmic C-terminal region that carries two C2 domains. The cytoplasmic domain can be phosphorylated by protein kinase C, calmodulin kinase II, and casein kinase (Takahashi et al., 1991;Davletov et al., 1993). The first C2 (C2A) domain displays low micromolar calcium-dependent phospholipid binding (Davletov and Südhof, 1993), whereas the second (C2B) binds inositol polyphosphates (Fukuda et al., 1995).
Synaptotagmins interact with multiple proteins implicated in synaptic vesicle trafficking. These include the neurexins (Petrenko et al., 1991; Hata et al., 1993), the AP2 adaptor protein complex (Zhang et al., 1994), and calcium-dependent binding to syntaxin (Li et al., 1995), a protein that with SNAP 25 (synaptosome-associated protein of 25 kDa) and synaptobrevin/VAMP (vesicle-associated membrane protein) forms the trimeric “core complex” thought to be involved in synaptic vesicle docking and fusion (Söllner et al., 1993). Synaptotagmin and core complexes also can associate with N-type (Bennett et al., 1992; Lévêque et al., 1992; Yoshida et al., 1992) and P/Q-type (Martin-Moutot et al., 1996) calcium channels, which optimally may locate low-affinity calcium binding sites that regulate exocytosis within restricted domains of voltage-dependent calcium influx.
Whether the other isoforms also can mediate Ca2+-regulated exocytosis remains to be established, although they display many similar biochemical properties to synaptotagmin I. Synaptotagmins II, and III have been detected in fractions enriched in synaptic vesicles (Ullrich et al., 1994). Furthermore, the C2A domain of synaptotagmins I, II, and III exhibits similar affinities for Ca2+ in a phospholipid binding assay and binds to syntaxin in the presence of Ca2+ (Li et al., 1995). The properties of recombinant synaptotagmin IV differed from those of the other isoforms, because in the presence of Ca2+ no syntaxin or phospholipid binding was detected. However, Fukuda et al. (1996) have reported that synaptotagmin IV interacts with Ca2+ in the presence of phosphatidylserine or phosphatidylinositol. Fusion proteins containing both C2 domains of synaptotagmins I, III, and IV interact with AP-2 (Ullrich et al., 1994; Zhang et al., 1994).
We present a detailed direct comparison of the spatial and temporal expression patterns of synaptotagmin I, II, III, and IV mRNAs in the developing mammalian brain using the in situ hybridization technique, which suggests distinct functional roles for the gene products.
MATERIALS AND METHODS
Oligonucleotide probes. Oligonucleotide probes [44–45 base pairs (bp)] of unique sequence were synthesized (CIML, France) and purified by ethanol precipitation. The probe sequences for rat synaptotagmin I (Perin et al., 1990), synaptotagmin II (Geppert et al., 1991), synaptotagmin III (Mizuta et al., 1994), and synaptotagmin IV (Vician et al., 1995) cDNAs are compiled in Table 1. Sense probes TgIs, TgIIs, TgIIIs, and TgIVs exactly complementary to TgIa, TgIIa, TgIIIa, and TgIVa antisense probes, respectively, were used as negative controls. Probes were 3′ end-labeled with 5′-[α-35S]-dATP (>1000 Ci/mmol; Amersham, Arlington Heights, IL) to similar specific activities in the range from 0.5 × 10⁹ to 1.5 × 10⁹ dpm/μg, using terminal deoxynucleotidyl transferase (Boehringer Mannheim, Mannheim, Germany) with a 30:1 molar ratio of dATP/oligonucleotide. Unincorporated nucleotides were removed by a spin column procedure using Sephadex G-25 (Pharmacia, Uppsala, Sweden).
5′-3′ sequences of oligodeoxyribonucleotide probes used for in situhybridization
Tissue preparation. Nonperfused rats of different ages were decapitated. Brains or cervicothoracic regions of the spinal cord were removed and frozen on dry ice. Cryostat sections (12 μm) were cut, mounted onto poly-l-lysine-coated slides, and dried at room temperature. Experiments were performed on horizontal, coronal, and sagittal brain sections of newborn and 2-, 4-, 6-, 10-, 13-, 15-, 20-, and 30-d-old and adult rats. Sections were stored at −80°C until required. On the day of the experiment, sections were fixed in 4% paraformaldehyde, rinsed in PBS, dehydrated into 95% ethanol, and dried.
In situ hybridization. Radiolabeled probe was dissolved in hybridization buffer [50% (v/v) formamide, 4× SSC (0.15m NaCl and 0.015 m Na-citrate), and 10% (w/v) dextran sulfate] at final concentrations of 0.14–0.5 nmand applied to sections. Hybridization was performed at 42°C under a Parafilm cover. Sections were washed to a final stringency of 1× SSC at 55°C and exposed to Kodak X-Omat or Biomax film at room temperature or dipped in Ilford K5 emulsion. Slides were developed in D-19 (Eastman Kodak, Rochester, NY) and counterstained with toluidine blue. To examine the specificity of the signals observed, we hybridized sections at each stage with two independent antisense oligonucleotides complementary to different regions of each transcript. Only TgIIIa antisense oligonucleotide was used on sections that were dipped in emulsion. Control experiments with the sense oligonucleotide probes TgIs, TgIIs, TgIIIs, and TgIVs were performed at all ages, as detailed above. The anatomy of sections and autoradiographs was determined by using the atlas of the adult (Paxinos and Watson, 1986) and developing (Paxinos et al., 1991) rat brain. Rat brain section autoradiographs were scanned, and digitalized images were printed on a Codonics photographic printer that used thermal dye sublimation technology (see Fig. 1). Relative expression levels were estimated by visual comparison of exposed x-ray films and emulsion-coated slides.

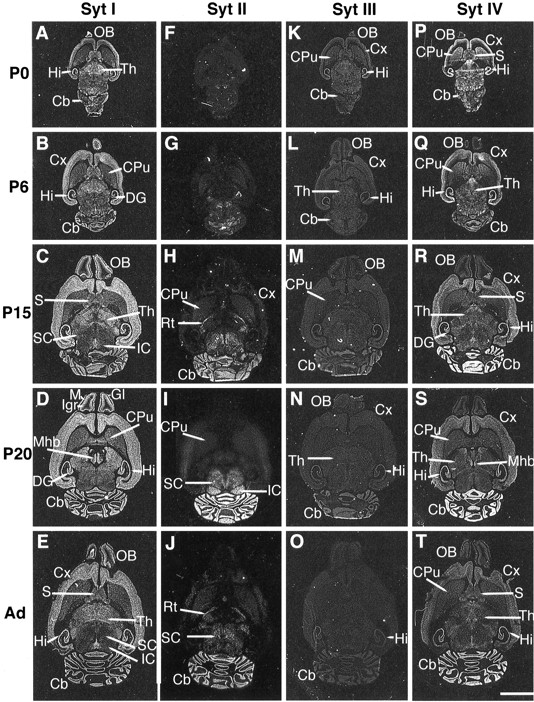
Overview of postnatal expression of synaptotagmin I, II, III, and IV transcripts in rat brain. In situhybridization of synaptotagmin I (A–E), II (F–J), III (K–O), and IV (P–T) mRNAs in horizontal sections of newborn (P0), 6- (P6), 15- (P15), and 20-d-old (P20) and adult (Ad) rat brain. Exposure was on Kodak Biomax film for 2 weeks with synaptotagmin I and IV probes, 5 weeks with synaptotagmin II, and 6 weeks with synaptotagmin III probes. Negative digitalized images were produced by scanning autoradiographic films. Synaptotagmin I, II, and IV mRNA distributions were obtained in the same experiment. Cb, Cerebellum; CPu, caudate putamen; Cx, cortex; DG, dentate gyrus; Gl, glomerular layer; Hi, hippocampus; IC, inferior colliculi; Igr, internal granule cell layer; M, mitral cell layer;Mhb, medial habenula; OB, olfactory bulb;Rt, reticular thalamic nucleus; S, septum; SC, superior colliculi; Th, thalamus. Scale bar, A–T, 5 mm.
RESULTS
Specificity of probes
To assess the expression of synaptotagmin I, II, III, and IV transcripts in the developing rat CNS, we used specific oligonucleotide probes corresponding to distinct nucleotidic sequences. Synaptotagmin I, II, and III oligonucleotides were identical to those used in our previous study on adult rat tissues (Marquèze et al., 1995). To control the specificity of hybridization, we applied two probes complementary to different regions of each cDNA to tissue sections from all areas and developmental stages examined. In each case, both members of the pair displayed identical patterns of hybridization at both regional and cellular levels. For cellular exploration of synaptotagmin III mRNA distributions, only one antisense oligonucleotide was used (data not shown). Background levels were established using a sense probe specific to each transcript that failed to hybridize to mRNAs on sections from all ages and regions (data not shown). To compare the level of hybridization of each probe during development, we performedin situ hybridization on sections from different stages under identical conditions in the same experiment.
Figures 1 and 2 provide an overview of synaptotagmin expression from birth (P0) until adulthood in brain and spinal cord. Because of the broad spatiotemporal areas studied and the nonlinear response of film to radioactivity, results shown in these figures should be considered as semi-quantitative. However, cellular localizations of synaptotagmin transcripts were characterized in different areas of the brain (Figs. 3-7) in conditions of a more linear dose–response scale. Table 2summarizes synaptotagmin mRNA levels in the CNS obtained by evaluating both x-ray films and emulsion-coated slides.

Overview of postnatal expression of synaptotagmin I, II, III, and IV transcripts in rat spinal cord. In situ hybridization of synaptotagmin I (A–C), II (D–F), III (G–I), and IV (J–L) mRNAs on newborn (P0), 6- (P6), and 20-d-old (P20) sections. Exposures were on Kodak Biomax film for 7 weeks. The dorsal horns are oriented toward the top of each photomicrograph. Scale bar, A–L, 1 mm.

Differential distributions of synaptotagmin I, II, and IV transcripts in the developing olfactory bulb. High-power bright-field photomicrographs of 6- (P6), 15- (P15), and 20-d-old (P20) rat brain sections show the distribution of synaptotagmin I (A–C), II (D–F), and IV (G–I) mRNAs. Exposure times of the emulsion-coated slides were 6 weeks. Gl, Glomerular layer; Igr, internal granule cell layer.Arrowheads point to the mitral cell layer (M). Scale bar, A–I, 35 μm.
Relative distribution of synaptotagmin I, II, III, and IV mRNAs in different regions of the rat CNS during postnatal development
Regional distribution in brain and spinal cord
Synaptotagmin I
The distribution of synaptotagmin I transcripts in adult rat brain was similar to those previously described (Ullrich et al., 1994;Marquèze et al., 1995). Through most developmental stages and in the adult, synaptotagmin I mRNAs were the major form in the cerebrum. Transcripts levels increased steadily, paralleling neuronal differentiation. In the cerebellum, mRNAs reached maximum levels at ∼20–30 postnatal days, at the time of granule cell differentiation. In spinal cord, synaptotagmin I mRNAs were distributed mostly in the dorsal horn (Fig. 2A–C) throughout development, as reported in the adult (Ullrich et al., 1994; Marquèze et al., 1995).
Synaptotagmin II
Synaptotagmin II mRNA levels were very low in the forebrain at all stages (Fig. 1F–J), except in restricted areas such as the reticular thalamic nucleus (Fig.1H). In contrast, transcripts were very abundant in the cerebellum from postnatal day 15 (P15; Fig.1H) until adulthood (Fig.1J) at the time of major synaptogenesis. From P6, they were the major forms in most neurons of the spinal cord (Fig.2E,F).
Synaptotagmin III
Synaptotagmin III transcripts were distributed widely at a low level in most neurons throughout the postnatal development of the brain (Fig. 1K–O) and spinal cord (Fig.2G–I).
Synaptotagmin IV
Synaptotagmin IV mRNAs were the major forms at P0 in certain neurons of the brain (Fig. 1P) and spinal cord (Fig.2J). From P6 through the adult stage, the level of synaptotagmin IV mRNAs in these cells decreased in the brain (Fig. 1R–T) and in spinal cord (Fig.2K,L), with the exception of the granule cells of the cerebellum where the level of expression was high from P15 to adulthood (Fig. 1R–T).
Cellular distribution
The distribution of synaptotagmin mRNAs is described below in greater detail in four brain regions that highlight the distinct ontogenetic expression patterns. Because of the uniform low level of synaptotagmin III transcripts in the brain, their cellular distribution is not shown in Figures 3, 5, and 7.

Distinct distributions of synaptotagmin I, II, and IV transcripts in the developing rat hippocampus. High-power bright-field photomicrographs through the CA3 cell layer illustrate the distribution of synaptotagmin I (A–C), II (D–F), and IV(G–I) on 4- (P4), 13- (P13), and 20-d-old (P20) rat brain sections. Exposure times were 6 weeks.Arrowheads highlight labeled CA3 cells. Scale bar,A–I, 23 μm.

Differential distributions of synaptotagmin I, II, and IV transcripts in the developing cerebellum. High-power bright-field photomicrographs display the distribution of synaptotagmin I (A–C), II (D–F), and IV (G–I) transcripts on 6- (P6), 15- (P15), and 20-d-old (P20) rat brain sections. Exposure times were 6 weeks.EGL, External germinal layer; mol, molecular layer; Pj, Purkinje cell layer;Gr, granule cell layer. Arrowheads point to some highly labeled cells in the granule cell layer.Arrows show the labeling of the premigratory zone of the external plexiform layer. Scale bars: A, D, G, 14 μm;B, C, E, F, H, I, 23 μm.
Olfactory bulb
Synaptotagmin I transcripts predominated at all stages in most neurons
Labeling of synaptotagmin I mRNAs was already intense in the mitral cell layer (Fig. 1A) in newborn rats and persisted in adulthood. The level of hybridization was also important in the glomerular and internal granule cell layers from P6 (Fig.3A–C). The distribution of synaptotagmin III and IV (Fig.3G–I) transcripts resembled those of synaptotagmin I, but the levels of hybridization were low at all stages examined. The level of labeling obtained with synaptotagmin II antisense probes in Figure 3D–F corresponded to the level of nonspecific hybridization obtained with the sense probe (data not shown).
Neocortex
Synaptotagmin IV transcripts were the most abundant at early stages of postnatal development
In newborn rats, cortical neurons mainly expressed synaptotagmin IV transcripts (Fig. 1P; data not shown on emulsion-dipped sections). A high level of hybridization was maintained during the first week. In 4-d-old rats, signals were restricted to several layers, possibly layers II–III and V (Fig.4D), whereas synaptotagmin I transcripts were present at a lower level in all laminas explored (Fig.4A).

Distinct expression of synaptotagmin I and IV transcripts at P4 in cortex (A,D), hippocampus (B, E), and cerebellum (C, F). Bright-field photomicrographs of coronal sections display the distribution of synaptotagmin I (A–C) and synaptotagmin IV (D–F) transcripts. Exposure times were 6 weeks. A, D, Cortex; B,E, hippocampus; C, F, cerebellum. An arrowhead points to some highly labeled cells in F. CA1, CA1 cell layer;CA3, CA3 cell layer; DG, dentate gyrus;EGL, external germinal layer (arrowheadsin C and F); Fl, flocculus. Ventral side of the cerebellum is oriented toward theleft of photomicrographs C andF. Scale bars: A, D, 135 μm; B, C, E, F, 240 μm.
Expression of synaptotagmin I transcripts reached a maximum on sections from 15- to 20-d-old rats (Fig. 1C,D), whereas signals with synaptotagmin IV probes diminished (Fig.1R–T).
As previously described in the adult (Ullrich et al., 1994;Marquèze et al., 1995), labeling of synaptotagmin II transcripts was confined to a few cells of layers V to VI (data not shown) in 13-d-old animals.
Hippocampus
Synaptotagmin IV transcripts were predominant during the first week after birth
Synaptotagmin IV transcripts were already highly expressed in the newborn rat. A heterogeneous distribution was observed in the hippocampus. The labeling was intense in the CA3–CA4 area and in the subiculum (Fig. 1P; data on emulsion-dipped sections not shown) but not detectable in the CA1 field and in the para- and presubiculum. At stages P4–P6 the level of hybridization of synaptotagmin IV was still very pronounced in the CA3–CA4 field (Figs.4E, 5G), whereas synaptotagmin I transcripts were mostly present in the CA1 area (Fig.4B).
Synaptotagmin I transcripts increased steadily from P0 through adulthood (Figs. 1A–E, 5A–C) while the level of synaptotagmin IV mRNAs decreased (Figs. 1Q–T,5G–I).
A subpopulation of CA1–CA3 neurons expressed synaptotagmin II transcripts
As previously observed on adult hippocampal sections (Ullrich et al., 1994; Marquèze et al., 1995), 13- and 20-d-old rat sections hybridized with synaptotagmin II probes already exhibited a pattern of labeling confined to a number of scattered cells in the CA4 to CA1 pyramidal cell layer (Fig. 5F).
Cerebellum
During perinatal development, the synaptotagmin IV gene was highly expressed in clusters of Purkinje cells
Synaptotagmin IV gene expression was detected as early as P0 (data not shown) and became pronounced at P4 only in the most rostral part of the cerebellum, essentially deep in the fissure closest to the fourth ventricle between the parafloccular and floccular lobes, as seen on several sagittal, horizontal, and serial coronal sections (Fig.4F). A striking segregation of the labeling was observed in clusters of putative Purkinje cells. On Figure6B a section of the flocculus hybridized with the synaptotagmin IV sense probe is displayed. Unlabeled Purkinje cells are clearly distinguished by their more intense staining with toluidine blue. In the same area of the cerebellum hybridized with the antisense probe (Fig.6A), the labeled cells showed the same morphology and localization as Purkinje cells. A temporal expression pattern was established by comparing the hybridization pattern at P0, P2, P4, and P6 (data not shown). The highest level of expression in the clusters was observed at P4.

Cellular expression of synaptotagmin IV transcripts at P4 in the flocculus of the cerebellum. Shown are bright-field photomicrographs of sagittal sections hybridized with the synaptotagmin IV antisense (A) and sense (B) probes. Exposure times were 6 weeks.EGL, External germinal layer; Pj, Purkinje cell layer. Scale bar, A, B, 17 μm.
At P6, the level of labeling of synaptotagmin IV transcripts in the Purkinje cell clusters was decreasing. Previously unlabeled neurons began to express synaptotagmin IV transcripts at a low level (Fig.7G), thus giving a more uniform pattern of expression among Purkinje cells. These neurons also expressed synaptotagmin I (Fig. 7A), whereas no hybridization was detected with synaptotagmin II (Fig. 7D) and III probes (data not shown).
From P15, synaptotagmin I mRNAs (Fig. 7B,C) were no longer detectable in Purkinje cells, whereas synaptotagmin II (Fig.7E,F) and synaptotagmin IV (Fig.7H,I) mRNAs were expressed uniformly.
Postmitotic premigratory granule cells expressed the synaptotagmin I gene
Granule cells already express synaptotagmin I at P0. Strikingly, synaptotagmin I mRNAs also were found in the premigratory zone of the external granular layer occupied by postmitotic neurons migrating from the germinative layer to the internal cell layer through the Purkinje cell layer (see arrows, Fig. 7B,C).
At later stages of differentiation, granule cells expressed the four synaptotagmin genes
At ∼P15–P20 (Figs. 1, 7B,C,E,F,H,I) expression of the four synaptotagmin transcripts reached its highest level in the granular cell layer. Also, a strong level of synaptotagmin I hybridization, which attained a peak of intensity ∼P15–P20, was observed on discrete neurons in the granular cell layer that were possibly Golgi cells (see arrowheads, Fig. 7B,C), as previously described in adult tissue (Marquèze et al., 1995).
DISCUSSION
As a basis for further functional studies, we have analyzed the distribution of four synaptotagmin isoforms during postnatal development in a major period of synaptogenesis in the CNS. In this discussion we assume that the observed changes in mRNA levels induce parallel changes in the biosynthesis of the various protein components. A very distinct spatial regulation of synaptotagmin I, II, and III mRNAs has been described in the adult brain (Ullrich et al., 1994;Marquèze et al., 1995). Ullrich and Südhof (1995) also have characterized strong expression of synaptotagmin I transcripts in the brain and synaptotagmin II mRNAs in the medulla oblongata of embryonic day 21 embryos. We report that differential distributions of the expression of synaptotagmins I, II, and III as well as synaptotagmin IV were found in the developing CNS. Throughout the greatest part of postnatal development, synaptotagmin I transcripts were prominent in the brain and synaptotagmin II mRNAs in the spinal cord. The distribution of synaptotagmin III transcripts appeared uniform and ubiquitous throughout postnatal development. We observed two different patterns of distribution of synaptotagmin IV transcripts. During early development high but transitory gene expression was detectable in a limited set of neurons, whereas subsequently lower expression was maintained uniformly in most neurons. The level of hybridization was superior to those of synaptotagmin III mRNAs at all stages, which differs from the findings of Ullrich and coworkers (1994) in the adult brain. This discrepancy could be explained by differences in the choice of oligonucleotide probes.
The temporal regulation of the four transcripts was very distinct. The overall levels of synaptotagmin I mRNAs in brain and synaptotagmin II in spinal cord steadily increased, whereas synaptotagmin IV mRNAs in these regions decreased through adulthood. Synaptotagmin III gene was expressed at a low level at all stages.
Ontogeny of synaptotagmin I transcripts
The upregulation of synaptotagmin I gene expression in brain correlated with neuronal differentiation. Synaptotagmin I transcripts were present in most neurons, which is compatible with a general role of the protein in the release of neurotransmitters from nerve terminals.
In the olfactory bulb, the level of synaptotagmin I transcripts was already very high in the newborn rat. In the mouse, all types of synapses are already present in the newborn animal, which is a sign of the precocity of the olfactory system (Jacobson, 1991). This would suggest that synaptotagmin I expression mirrors synaptogenesis.
This should be compared with the delayed postnatal synaptogenesis in the neocortex. At a time of dramatic increase in the connectivity of the mammalian cerebral cortex, which occurs during the early postnatal development (from P2 to P25), an increase of the level of synaptotagmin I mRNA was observed.
In cerebellum, our in situ developmental studies show that granule neurons express messages for synaptotagmin I immediately before migrating to their final anatomical destination. Immunoreactivity of synaptophysin, a transmembrane protein of synaptic vesicles, also has been described in immature granule cells (Leclerc et al., 1989) as well as transcripts coding for the glutamate receptor subunit GluR-4c (Gallo et al., 1992). Also, N-type calcium channel activity has been detected and seems to be essential for granule cell migration (Komuro and Rakic, 1992). Synaptotagmin I transcripts also were observed in the granule cell layer. The intensity of labeling in granule cells reached a maximum ∼P15–P20 at a time when a large number of synapses are established between parallel fibers and Purkinje cell dendrites (Jacobson, 1991). Identical patterns of labeling were observed in granule cells with synaptotagmin II, III, and IV probes, which suggest that in these neurons the four synaptotagmins may have redundant functions. Also, a strong level of synaptotagmin I hybridization, reaching a peak of intensity ∼P15–P20, was observed on discrete neurons in the granular cell layer that were possibly Golgi cells. At P15–P20 Golgi cells are known to form synapses on granule cell dendrites (Altman, 1972).
In the spinal cord, synaptotagmin I transcripts were confined to the dorsal horn except at early stages of differentiation when labeling was observed also in the ventral horn. Synaptotagmin II mRNAs were predominant and displayed a uniform distribution. The level of labeling steadily increased during synaptic maturation (Jacobson, 1991).
Ontogeny of synaptotagmin IV transcripts
However, important differences were seen in the ontogenesis of synaptotagmin IV in the CNS. A transitory high expression was noticeable during the first week after birth in restricted cells, which were mostly efferent neurons that transmit information from one brain region to another. Subsequently, the intensity of labeling in these cells diminished and a low level was observed in most neurons.
Our data show that in developing neocortex synaptotagmin IV gene expression is most pronounced in layer V. The outgrowth of axons from layer V neurons starts during the final days of the prenatal period. They reach their targets in the mid- and hindbrain in early postnatal life (De Carlos and O’Leary, 1992). Therefore, the period of axonal outgrowth and subsequent refinement of the projections of the pyramidal neurons coincides with the period in which the synaptotagmin IV gene is heavily expressed, suggesting that the protein may play a role in the establishment of subcortical projections.
In the hippocampus, synaptotagmin IV expression was, strikingly, confined to the CA3 area and not detectable in CA1 cell layer during the first week. There is a “rhinal to dentate” gradient of neurogenesis in the hippocampus. The entorhinal cortex starts to differentiate first; next is the subiculum, then the CA3 field of Ammon’s horn, and, finally, the dentate gyrus. Two structures are exceptions to this gradient. The para- and presubiculum are formed significantly later than the subiculum, and CA1 differentiates significantly later than adjacent CA3 cells (Bayer, 1980). Thus, the pattern of synaptotagmin IV gene expression could be linked to the level of neuronal maturation attained.
A high transitory level of synaptotagmin IV gene expression was observed in very restricted patches of neurons identified as Purkinje cells. Evidence for biochemical heterogeneity in adult Purkinje cells has been provided for different neuropeptides, enzymes, and various molecular markers such as zebrins (Hawkes et al., 1992; Wassef et al., 1992). Transient Purkinje cell heterogeneity during perinatal development also has been described. Expression in patches of synaptotagmin IV mRNAs is reminiscent of the expression of cyclic guanosine 3′:5′-phosphate-dependent (cyclic GMP) protein kinase by clusters of Purkinje cells (Wassef and Sotelo, 1984), which occurs several days earlier. Different lines of evidence have been presented (Wassef et al., 1992) in favor of the hypothesis that, during development, the cerebellar cortex develops an intrinsic topographic map through its subdivisions into small sets of biochemically different Purkinje cells. Compartments could permit the precise correlation of afferent and efferent projections. The elevated transitory expression of synaptotagmin IV, which was detected only in the late-maturing flocculus could coincide with the time at which some Purkinje cell axons establish connections with their target nuclei. Interestingly, an elevated expression of synaptotagmin IV mRNAs also was seen in the inferior olive (data not shown) at a time when climbing fibers that project from these nuclei establish multiple synaptic contacts with Purkinje cells (Crepel et al., 1976). Increased synaptic activity on Purkinje cell soma could modulate synaptotagmin IV gene expression, because Vician and coworkers (1995) have reported that synaptotagmin IV is an immediate early gene induced in the brain by depolarization.
Interestingly, in spinal cord a high transitory and heterogeneous expression of the synaptotagmin IV gene also was observed in dorsal and ventral horns during the first week of life (data not shown).
Thus, in several regions of the CNS a subtle regulation of the synaptotagmin IV gene expression was observed at a time that could coincide with the establishment and maturation of certain synapses. This suggests that synaptotagmin IV could be involved in early neuronal differentiation such as axonal growth or the formation and consolidation of synapses. In addition to genetic determinants, activity-dependent processes play a major role in forming neural networks. Because synaptotagmin IV expression may be regulated by elevation of Ca2+ (Vician et al., 1995), synaptotagmin IV could link electrical activity with the development of connectivity. Therefore, it will be important to determine the localization of the protein and study its regulation in development and neural plasticity.
Footnotes
Correspondence should be addressed to Dr. Béatrice Marquèze, Institut National de la Santé et de la Recherche Médicale U 374, Institut Jean Roche, Faculté de Médecine-Secteur Nord, Boulevard Pierre Dramard, 13916 Marseille Cedex 20, France.


