

Article Figures & Data
Figures
- Fig. 1.
PCR analysis of D2-like receptors in PC12 cells. RT-PCR analysis indicates that PC12 cells display message for D2 (long and short forms) and D4 DA receptors at the expected molecular weight (Materials and Methods). No D3 message was observed. Ventral striatum (postnatal day 1) displays message for all three D2-like receptors. The ladders on either side indicate 100 bp intervals for scaling. The 200 and 400 bp bands are indicated byasterisks.
- Fig. 2.
Effect of quinpirole on TH activity. PC12 cultures were exposed to tyrosine (100 μm for 40 min) in the presence of the DOPA decarboxylase inhibitor brocresine (500 μm). After incubation and extraction, l-DOPA was measured by HPLC. Quinpirole decreased l-DOPA synthesis to 59% of controls. The inhibition was blocked by coincubation with the D2-like antagonist sulpiride (40 μm).n = 5 for each condition; error bars indicate SEM; *p < 0.0001 by one-way ANOVA.
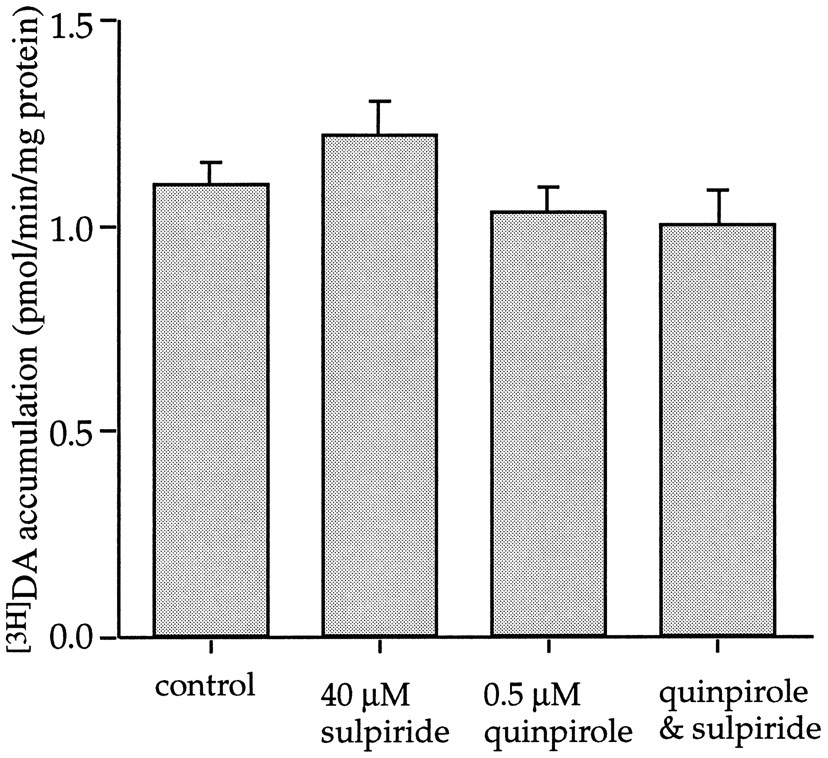
- Fig. 3.
Effect of quinpirole on DA uptake. PC12 cultures were exposed to a combination of unlabeled and [3H]DA (300 fmol) in physiological medium for 5 min. DA uptake was halted by replacing with ice-cold physiological medium, and the cells were solubilized with PCA. Background DA uptake was determined in saline in which choline replaced sodium. Exposure to either sulpiride or quinpirole did not alter specific DA uptake.n = 5 for each condition; error bars indicate SEM.
- Fig. 4.
Depolarization by high potassium elicits quantal release in PC12 cells. A, Amperometric spikes after PC12 stimulation with 80 mm KCl for 6 sec (applied atarrow). This representative control trace represents 15 spikes (Imax > 4.5 rms noise), ranging from 1.25 to 14.0 pA with a mean amplitude of 4.8 ± 1.0 pA and quantal size of 201,000 ± 39,400 molecules. B, The portion above the broken line in A is displayed with an expanded time resolution. The quantal size (#molecules), peak amplitudes (Imax; in picoamperes), and width at half height (t½; in milliseconds) are displayed under four corresponding events. C, For the sample event indicated with the asterisk inB, the maximal amplitude is indicated by the top broken line, and the half height is indicated by themiddle broken line. The foot, filled by an array of points, is estimated by integrating the portion of the event preceding the slope (broken line) between the 60 and 90% rise-times (Chow and von Ruden, 1995). D, For control cells (events in Table 1), the interspike intervals (intspike; in milliseconds) are displayed in 100 msec bins on the x-axis. The percentage of intervals within each bin (n/N) is labeled on the y-axis. The decreased representation at longer interval values is approximated by an exponential decay (see Materials and Methods).
- Fig. 5.
Effects of quinpirole on quantal release. Examples of traces recorded from (A) a control cell and (B) a cell exposed to 0.5 μmquinpirole for 40 min. Cells were stimulated by 6 sec applications of 80 mm KCl at the arrow. Quinpirole decreased the mean quantal size of individual release events (Table 1).C, Distribution of mean quantal size values for all cells that displayed more than five events within 20 sec of stimulation (controls, n = 34; quinpirole,n = 18; sulpiride, n = 30; quinpirole/sulpiride, n = 13).D–G, The cumulative frequencies of interspike intervals are compared between treatments. Quinpirole shifted interspike values to longer durations. The effect was blocked by sulpiride (B).H–K, For each group, the distribution of quantal sizes (#molecules/1000) is indicated as a histogram of the untransformed quantal sizes (left column) and the log values of those quantal sizes (right column). Quinpirole shifted the frequency distribution of quantal sizes to the left. The lower limit of each bin size is displayed on the x-axis. The distribution of log transformations in each case is closely approximated by a normal distribution (r2 ≥ 0.987; Table2).
- Fig. 6.
Effect of l-DOPA on quinpirole action. Examples of traces recorded from a cell exposed to l-DOPA (50 μm for 40 min) (A) and a cell that has undergone identical l-DOPA exposure in the presence of quinpirole (0.5 μm for 40 min) (B). Cells were stimulated by 6 sec applications of 80 mm KCl at the arrow. C, Distribution of mean quantal size values for cells that displayed more than five events within 20 sec of stimulation (controls,n = 34; quinpirole, n = 18;l-DOPA, n = 25;l-DOPA–quinpirole, n = 19). The control and quinpirole-only groups are the same as those represented in Figure 5. l-DOPA increased the mean quantal size of both control and quinpirole-treated release events to a similar degree (Table 1). D–F, Cumulative frequencies of interspike intervals are compared between treatments.l-DOPA blocked the effect of quinpirole on interspike intervals. G–J, Distribution of quantal sizes indicated as histograms of log transforms of the quantal size as in Figure 5. For comparison, the control and quinpirole-treated groups are also shown. l-DOPA shifted the frequency distribution of quantal sizes to the right.


Tables
Quantal size Imax t1/2 intspike % with foot Foot size n N Control 173,300 ± 8700 5.4 ± 0.2 6.7 ± 0.2 598 ± 43 3.1% 30,600 ± 5100 2316 48 0.5 μm quinpirole 88,600 ± 3200 4.7 ± 0.2 5.7 ± 0.2 827 ± 65 3.3% 17,600 ± 3700 718 24 40 μm sulpiride 183,400 ± 8400 6.8 ± 0.4 6.8 ± 0.2 566 ± 41 6.8% 39,000 ± 7900 1270 30 Quinpirole/sulpiride 157,000 ± 9600 6.8 ± 0.7 6.4 ± 0.3 551 ± 79 8.2% 22,600 ± 3900 821 15 50 μm l-DOPA 428,000 ± 22,500 9.8 ± 0.5 7.2 ± 0.2 562 ± 56 7.1% 59,300 ± 16,000 1329 26 Quinpirole/l-DOPA 368,700 ± 17,900 6.7 ± 0.2 7 ± 0.3 557 ± 59 3.2% 126,000 ± 64,300 840 24 Quantal size refers to the number of molecules per event,Imax to the maximum amplitude (in picoamperes),t1/2 is the duration at half maximum amplitude (in milliseconds), intspike is the interval between events (in milliseconds), % with foot is the percentage of events that display a detectable foot (minimum 1000 molecules), and foot size is the number of molecules represented within the foot. The number of events per group (n) and number of cells recorded per group (N) are shown. Experimental groups were exposed to 0.5 μm quinpirole, 40 μm sulpiride, or 50 μm l-DOPA as indicated for 40 min before recording. Mean ± SEM are reported. For sulpiride treatments, events from cells that exhibited more than one spontaneous quantal event before stimulation were excluded from the analysis (434 events from 9 cells) so that the total data recorded in this category representedn = 1704 events from 39 cells. If the additional data from these spontaneously releasing cells is included in the analysis, the quantal size, Imax,t1/2, % with foot, and foot size are nearly identical (data not shown).
Lognormal Cubed root Untransformed Controls 0.987 0.831 0.318 0.5 μm quinpirole 0.998 0.951 0.680 40 μm sulpiride 0.996 0.905 0.462 Quinpirole/sulpiride 0.997 0.949 0.688 50 μm l-DOPA 0.994 0.880 0.416 Quinpirole/l-DOPA 0.997 0.925 0.553 Linear best fit regressions were calculated for normal probability distributions of raw values and cubed root and log transformations of the quantal sizes. The population distributions are shown in Figures 5 and 6. In each case, the data points were better fit by a lognormal transformation than a cubed root transformation.


