

Abstract
We measured brain activity, perceptual thresholds, and reading performance in a group of dyslexic and normal readers to test the hypothesis that dyslexia is associated with an abnormality in the magnocellular (M) pathway of the early visual system. Functional magnetic resonance imaging (fMRI) was used to measure brain activity in conditions designed to preferentially stimulate the M pathway. Speed discrimination thresholds, which measure the minimal increase in stimulus speed that is just noticeable, were acquired in a paradigm modeled after a previous study of M pathway-lesioned monkeys. Dyslexics showed reduced brain activity compared with controls both in primary visual cortex (V1) and in several extrastriate areas, including area MT and adjacent motion-sensitive areas (MT+) that are believed to receive a predominant M pathway input. There was a strong three-way correlation between brain activity, speed discrimination thresholds, and reading speed. Subjects with higher V1 and MT+ responses had lower perceptual thresholds (better performance) and were faster readers. These results support the hypothesis for an M pathway abnormality in dyslexia and imply strong relationships between the integrity of the M pathway, visual motion perception, and reading ability.
Developmental dyslexia can be defined as an unexpectedly low reading ability relative to IQ. The reduced reading performance cannot be explained by a lack of motivation, inadequate learning opportunity, abnormal sensory acuity, or an acquired brain lesion. Estimates of its prevalence range from 3 to 9% (Rutter and Yule, 1975; Shaywitz et al., 1990).
Several cognitive, sensory, and motor deficits have been correlated with dyslexia (Tallal et al., 1993; Shaywitz et al., 1995, 1998;Heilman et al., 1996; Stein and Walsh, 1997). The goal of the present study was to test whether dyslexia is correlated specifically with a deficit in one of the major visual pathways between the retina and cortex: the magnocellular (M) pathway (Livingstone et al., 1991).
To test this hypothesis, we have relied on several of the main anatomical and functional features of the M pathway. Anatomically, the M pathway includes the retinal ganglion cells that project to the M layers of the lateral geniculate nucleus (LGN) of the thalamus, the M-layer LGN cells that project to primary visual cortex (V1), and the V1 cells that project to the extrastriate area MT and adjacent motion-sensitive areas (MT+) (Merigan and Maunsell, 1993). Hence, M pathway deficits should be evident in several sites within the visual pathways. In support of this hypothesis, Livingstone et al. (1991)conducted an anatomical postmortem study of LGN cell size in five dyslexic brains and found that cell bodies in the M layers of the LGN, but not other layers, were 27% smaller than matched controls.
Functionally, lesions to the M layers of monkey LGN reduce behavioral sensitivity to lower spatial and higher temporal frequencies. The same lesions also impair performance on motion discrimination tasks (Merigan and Maunsell, 1990; Schiller et al., 1990; Merigan et al., 1991). Correspondingly, psychophysical studies with dyslexics have demonstrated reduced sensitivity to lower spatial and higher temporal frequencies at low mean luminance (Lovegrove et al., 1982; Martin and Lovegrove, 1984, 1987; Evans et al., 1994; Felmingham and Jakobson, 1995; Borsting et al., 1996) and impaired perceptual performance in various motion discrimination tasks (Cornelissen et al., 1995; Eden et al., 1996; Demb et al., 1998).
Physiological studies have also provided evidence for visual deficits in dyslexia. First, visual evoked potentials (VEP) in dyslexics were reduced or delayed for stimuli with low spatial and high temporal frequencies (Livingstone et al., 1991; May et al., 1991; Lehmkuhle et al., 1993; Kubova et al., 1996). Second, in a functional magnetic resonance imaging (fMRI) study, Eden et al. (1996) failed to find significant activity in MT+ during the perception of moving dots in dyslexic subjects, suggesting a possible developmental lesion in MT+.
Some of these physiological and psychophysical findings have not been replicated (Victor et al., 1993; Walther-Muller, 1995; Hayduk et al., 1996; Johannes et al., 1996; Vanni et al., 1997). Consequently, the hypothesis for an M pathway deficit in dyslexia remains controversial.
To further test the hypothesis for an M pathway deficit in dyslexia, we have performed several new experimental tests. First, we compared fMRI responses from dyslexic and control groups using novel visual stimuli and viewing conditions that were designed to evoke relatively strong responses from the M pathway. Second, we compared individual differences in brain activity with reading ability and motion discrimination performance. Third, we have made measurements in previously untested cortical areas. Both our group and individual differences analyses supported the M deficit hypothesis.
Short descriptions of some of these and related results have been published previously (Demb et al., 1997a, b, c, 1998).
MATERIALS AND METHODS
Blood oxygenation level-dependent fMRI was used to measure brain activity in response to visual stimuli (Ogawa et al., 1990, 1992; Kwong et al., 1992; for a review, see Moseley and Glover, 1995). Each subject participated in several scanning sessions: one to obtain a standard, high-resolution, anatomical scan, one to functionally define the early visual areas including V1, and several sessions to measure fMRI response amplitude as a function of stimulus contrast for different sinusoidal grating stimuli.
In addition to the fMRI procedures, subjects were administered several reading tests, and a psychophysical speed discrimination threshold was measured [Demb et al. (1998) and see below]. All experimental procedures were reviewed and approved by the Internal Review Board at Stanford University.
Subjects. Five dyslexic subjects (two females) were solicited from the Stanford Disabilities Resource Center. All were Stanford students (mean age = 22.2 years; SD = 2.9) and were assumed to be of above-average intelligence. All had a childhood history of dyslexia and were diagnosed with dyslexia as adults. These students were in normal classes but were allowed extra time on course testing. Five control subjects (two females) were solicited from the Stanford population (mean age = 26.8 years; SD = 6.1). None had a history of reading difficulty. All subjects were right-handed, except one control who was left-handed. Two of the dyslexic subjects (one female) were co-diagnosed with attention deficit disorder and were taking Ritalin but did not take it before neuroimaging or behavioral testing. None of the other subjects were taking medication or had a neurological or psychiatric illness that would interfere with the study. Subjects were paid or volunteered without pay, all gave informed consent, and all had normal or corrected-to-normal visual acuity.
Reading measures. Subjects were administered five reading measures: the Wide Range Achievement Test (WRAT 3) reading and spelling tests, which require subjects to read or spell words of increasing levels of difficulty (e.g., cat to synecdoche); the Word Attack subtest of the Woodcock-Johnson educational battery, which requires subjects to sound out nonsense-word letter strings (e.g., raff, monglustamer); and the Nelson-Denny reading rate and comprehension measures, which require subjects to answer questions about a series of paragraphs (similar to the Scholastic Aptitude Test or Graduate Record Exam). After the first minute of the Nelson-Denny test, subjects were asked to mark the line they were reading to measure reading rate (words per minute). For all tests, percentile scores were derived for each subject by looking up raw scores in tables that accompanied the tests.
Psychophysical methods. Visual stimuli were displayed on a Radius high-resolution, monochrome monitor. Although the psychophysical and fMRI experiments were performed in separate sessions using different stimulus displays, the psychophysical and fMRI stimuli were similar in terms of mean luminance, spatial frequency, and speed. The stimuli, like those used in the fMRI experiments, were moving sine-wave gratings at a low mean luminance (0.4 c/°, 20.8°/sec, 5 cd/m2). Although the stimuli in the psychophysics experiment were smaller than those in the fMRI experiments (10° diameter circular aperture versus 14 × 14° square), previous psychophysical studies have shown that speed discrimination thresholds do not depend significantly on stimulus size (De Bruyn and Orban, 1988;Verghese and Stone, 1995).
The psychophysical paradigm was modeled after that used by Merigan et al. (1991) in M pathway-lesioned monkeys. Speed discrimination thresholds were measured using a two-interval forced-choice design. On each trial, subjects viewed two stimuli in succession, each preceded by an auditory beep. One of the stimuli on each trial was a baseline stimulus moving at 20.8°/sec. The other was a test stimulus with a variable speed, always faster than 20.8°/sec. The subject’s task was to report which of the two stimuli appeared to move faster. Subjects were instructed to indicate whether the first or second stimulus in each trial moved faster (i.e., had a higher speed) and that they should ignore other properties of the stimulus such as contrast or duration, which would be randomly varied (see below). Subjects were given feedback (“yes” or “no”) after each trial.
The speed of the test stimulus was adjusted, from trial to trial, using a double-random staircase procedure. After three correct responses in a given staircase, the test speed was decreased (i.e., moved closer to that of the baseline stimulus), making the task more difficult. After one incorrect response, the test speed was increased, making the task easier. The two staircases were randomly interleaved so that subjects would not be able to remember whether a staircase had just moved up or down, even though they were given feedback. The initial speed increment was chosen to be very large (20% of the baseline speed) to allow naive subjects to understand the task. Therefore, it was expected that all subjects would perform perfectly on the initial three trials of each staircase, and the task would become more difficult after the first downward step. The initial downward step was large (12% of the baseline speed); thereafter, the step size was 2% of the baseline speed.
As in previous studies, stimulus contrast and duration were randomized to force subjects to base their responses only on stimulus speed (McKee et al., 1986; Merigan et al., 1991), and subjects were informed of this. Specifically, stimulus contrast was varied randomly between 16 and 24% so that subjects could not use the alternate cue of apparent contrast to perform the task, and stimulus duration was varied randomly (average of 450 msec ± 20%) so that subjects could not count the number of cycles as they moved past.
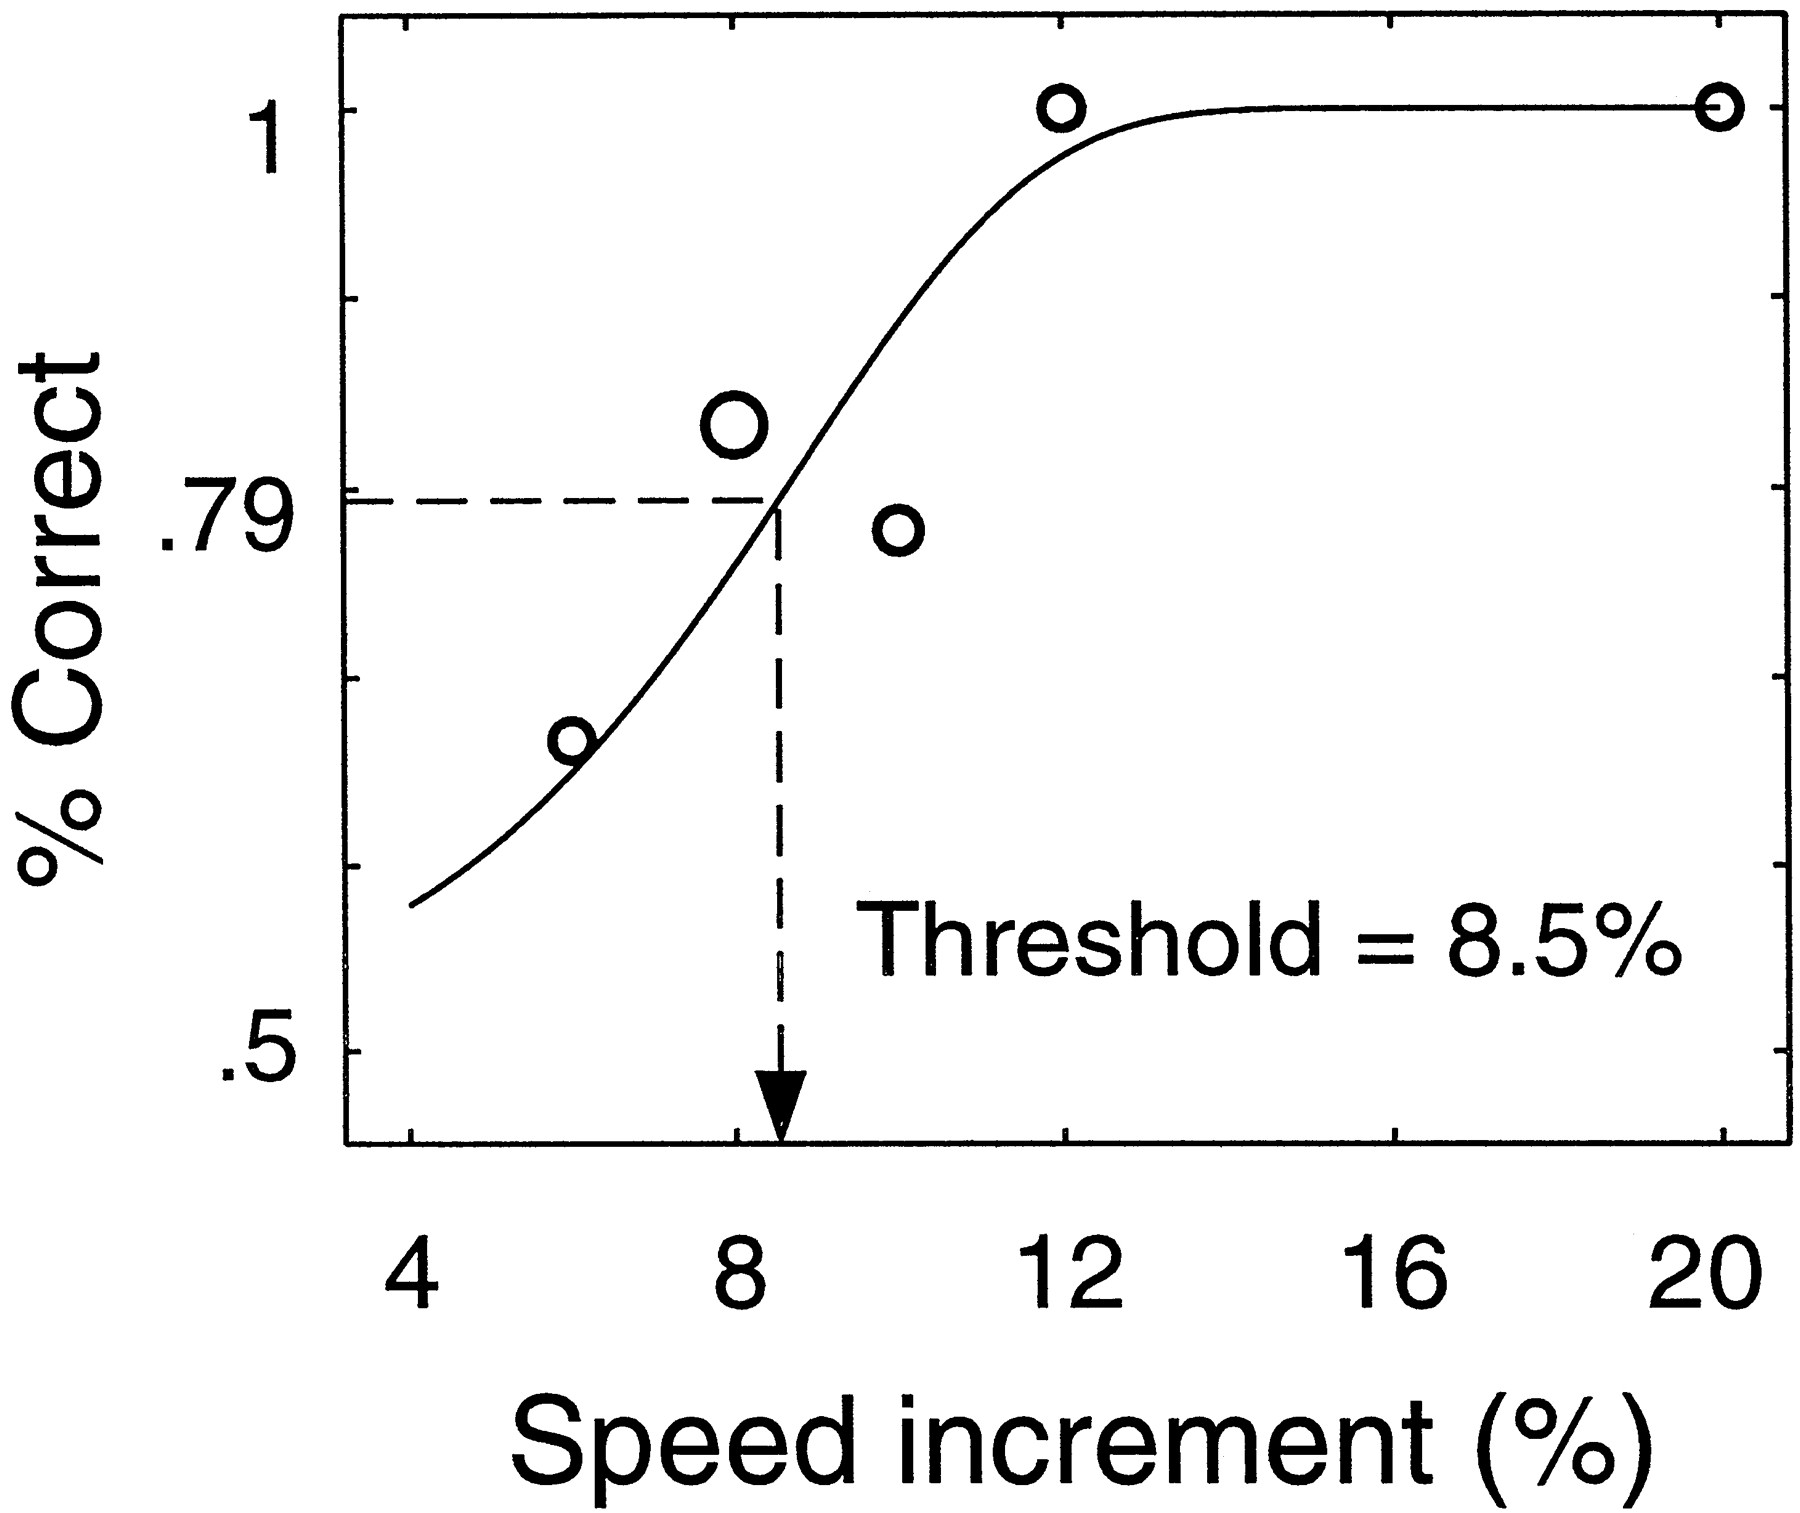
Figure 1 shows an example of a psychometric function (percent correct versus test speed). Performance was perfect when the test stimulus was moving much faster (20%) than the baseline stimulus, and performance was near chance levels when the test stimulus was moving only slightly faster (6%) than the baseline stimulus. A threshold was reached (8.5% faster) at the point where the subject’s performance was 79% correct. After 50 trials of the staircase procedure, the subject’s responses were compiled in this way and fit with a Weibull function using a maximum likelihood fitting procedure (Watson, 1979). The speed discrimination threshold was defined as the test speed that yielded 79% correct performance (that is, the performance level to which the three-down, one-up staircase converges).

Psychometric function (percentage correct versus test speed) in a two-interval forced-choice speed discrimination experiment. Dashed line indicates the threshold speed increment that yielded 79% correct performance. Speeds are expressed as Weber fractions, i.e., as percentage increases over the baseline speed. Symbol size is proportional to the number of trials at a given test speed.
Typically, a subject’s threshold would decrease with practice at the task. Subjects completed between 4 and 10 repeats of the staircase procedure, until their performance appeared to asymptote three times in a row. We report the mean of those three measurements as a Weber fraction, i.e., as the percent increase over the baseline speed. In the five control subjects, thresholds (mean Weber fraction = 5.6%; SD = 1.8) were similar to previous reports (DeBruyn and Orban, 1988; McKee, 1981; McKee et al., 1986).
fMRI visual stimuli. fMRI response versus contrast functions were measured using two sets of stimuli: (1) test stimuli designed to elicit relatively large responses from the M pathway, and (2) control stimuli designed to elicit strong responses from multiple pathways. Lowering the mean luminance of a visual stimulus increases the responsiveness of the M pathway relative to other visual pathways, especially at low mesopic and scotopic luminances (Purpura et al., 1988; Lee et al., 1997). Test stimuli, therefore, had low mean luminance (2 cd/m2), whereas control stimuli had higher mean luminance (36 cd/m2).
Test stimuli were 0.4 cycle/° sinusoidal gratings that moved (20.8°/sec) with low mean luminance (2 cd/m2). We recorded brain activity in response to five stimulus contrasts (3, 6, 25, 50, and 100%). The orientation and direction of motion of the moving gratings changed every 500 msec to minimize visual adaptation in orientation- and direction-selective neurons. The gratings were oblique (rightward and leftward diagonal), and the stimuli in the two halves of the screen on either side of the diagonal simultaneously moved toward or away from a fixation point to minimize eye movements (i.e., repeating the sequence: leftward diagonal, outward; rightward diagonal, outward; leftward diagonal, inward; rightward diagonal, inward). Control stimuli were 0.4 cycle/° flickering sinusoidal gratings (contrast-reversing at 8.3 Hz) at higher mean luminance (36 cd/m2), and we recorded brain activity in response to five stimulus contrasts (6, 12, 25, 50, and 100%). Orientation remained constant throughout the scan.
We ran a separate experiment to measure activity during a moving dot condition, similar to a previous fMRI study of dyslexia by Eden et al. (1996). The dots were 1° in diameter, and their intensity was 34.2 cd/m2, a 5% decrement below the 36 cd/m2 gray background. The dots moved in and out from the fixation point at a speed of 10°/sec, alternating direction once every second. This stimulus was presented for 18 sec alternating with 18 sec of a uniform gray field.
Visual stimuli were generated on a Macintosh computer that transmitted a high-resolution RGB signal to a Sanyo PLC-300M LCD video projector (66.7 Hz refresh). The stimuli were projected through a lens and focused onto a screen, made of rear-projection material, positioned at the opening of the bore of the magnet near the subject’s knees.
The subjects lay on their backs and looked directly up into an angled mirror to see the rear-projection screen. The display subtended 14 × 14° of visual angle. A small high-contrast square in the center of the stimulus served as a fixation mark to minimize effects of eye movements. Subjects were instructed to fixate this mark during the duration of the functional scans and were alerted before the beginning of each scan. A bite bar was used to stabilize the subject’s head. Several of the contrast conditions for some subjects were repeated and replaced because we suspected head movements, either between anatomical and functional scans (i.e., causing misalignment of structural and functional images) or within a functional scan (i.e., causing large artifacts in the time-course of the fMRI signal).
fMRI data acquisition. fMRI was performed on a standard clinical GE 1.5 T Signa scanner with a custom-designed head coil (low mean luminance test conditions and moving dots conditions) or a 5-inch-diameter surface coil (high mean luminance control conditions and retinotopy measurements). We used a T2*sensitive gradient recalled echo pulse sequence with a spiral readout (Noll et al., 1995, Glover and Lai, 1998). Parameters for the surface coil protocol were 750 msec repetition time (TR), 40 msec echo time (TE), 70° flip angle (FA), four interleaves, in-plane resolution = 0.94 × 0.94 mm, slice thickness = 4 mm. Parameters for the head coil protocol were 1500 msec TR, 40 msec TE, 90° FA, two interleaves, in-plane resolution = 1.02 × 1.02 mm, slice thickness = 4 mm. In all experiments, eight adjacent planes of fMRI data were collected either perpendicular to the calcarine sulcus and beginning at the occipital pole (surface coil experiments; see Fig.4A) or parallel to the calcarine sulcus with the lowest slice near the ventral surface of the occipital lobe (head coil experiments; see Fig. 5A). Because of the slice orientation, MT+ responses were not recorded in the surface coil experiments (i.e., in the control conditions).
During each scanning session, structural images were acquired using a T1-weighted spin echo pulse sequence (500 msec TR, minimum TE, 90° FA) in the same slices and at the same resolution as the functional images. These in-plane anatomical images were registered to a standard anatomical scan of each subject’s brain so that all MR images (across multiple scanning sessions) from a given subject were aligned to a common three-dimensional coordinate grid.
fMRI data analysis. fMRI responses to each visual stimulus were recorded in separate scans that each lasted 254 sec. The first 36 sec of data were discarded to minimize effects of magnetic saturation and visual adaptation. During the remaining 216 sec of each scan, a test stimulus alternated six times (once every 36 sec) with a uniform gray field of equal mean luminance. A sequence of 72 functional images (one every 3 sec) was recorded for each slice and for each stimulus contrast.
For a given fMRI voxel, the image intensity changed over time, comprising a time-series of data. This time series was periodic, with a period equal to the 36-sec-stimulus temporal period (Fig.2A). We quantified the fMRI response by (1) removing any linear trend in the time series, (2) dividing each voxel’s time series by the voxel’s mean intensity and subtracting the mean, (3) averaging the time series over a set of voxels corresponding to a particular brain region (e.g., V1 or MT+), and then (4) calculating the amplitude and phase of the (36 sec period) sinusoid that best fit the average time series.

fMRI response variability. A, Average time series (averaged within MT+), from one subject for a 50% contrast moving grating stimulus, superimposed with the best fitting sinusoid (dashed line). B, Amplitude of Fourier transform of A. The signal frequency (6 cycles/scan) and its harmonics are represented by triangles. Filled circles correspond to nonharmonic frequencies. Solid curve is an exponential function fit that was used to estimate the noise amplitude at the signal frequency (dashed line).
To improve signal-to-noise in the response versus contrast measurements, the least responsive voxels (e.g., voxels that contained a high proportion of white matter) were removed from the region of interest, based on responses to reference stimuli, run at the beginning of each session. The reference stimulus for all areas, except MT+, was a contrast-reversing 8.3 Hz 1 cycle/° checkerboard that alternated with a mid-gray field of equal mean luminance (36 cd/m2). The reference stimulus for MT+ alternated in time between moving and stationary dot patterns (see below). For all regions, voxels with correlations above a liberal threshold (r > 0.23 with 0–9 sec time lag) were included in further analyses. This correlation threshold of r > 0.23 corresponds to a p < 0.025 (one-tailed) significance level with n = 72, given that the points in the time series are independent. The independence assumption is obviously violated in an fMRI time series (attributable to the sluggishness of the hemodynamic response), and so the threshold would have to be raised considerably to achieve the desired significance level. However, this threshold was chosen only to remove the least responsive voxels from the analysis, not to test whether the stimulus was evoking activity.
The reference scan was also used to determine the sign of the responses. Responses within ±90° of the reference response phase were considered positive; otherwise they were considered negative. Note that in this way the expected value for a scan with no visual stimulus was zero.
Because the speed discrimination thresholds were measured at 20% contrast (see above), we fit the fMRI response versus contrast data and calculated the fitted response at 20% contrast (Fig.3). Specifically, the response versus contrast measurements were fit with a power function:
 Equation 1where R̂ is the fitted fMRI response amplitude,c is contrast, and A and p are free parameters that characterize the amplitude and shape, respectively, of the curves. A numerical search determined the A andp that minimized the following weighted least-squares error function:
 Equation 2where Ri
is the measured response to theith stimulus contrast andR̀i
(A, p) is the fitted response using parameters (A, p). The ςi2 in the denominator is an estimate for the variance of the response. In this way, the fitted responses most closely match data points with the smallest estimated variance. We used a power function for several reasons. First, it is a simple function with only two parameters. Second, we empirically determined that it provided a good fit across subjects and across visual areas. Third, we recently related the shape of the power function to human perception (contrast increment thresholds) at the high-contrast range used in this study (Boynton et al., 1998). Finally, the average single-unit response in monkey primary visual cortex is approximately shaped like a power function at these high contrasts (Albrecht, 1995).
Equation 2where Ri
is the measured response to theith stimulus contrast andR̀i
(A, p) is the fitted response using parameters (A, p). The ςi2 in the denominator is an estimate for the variance of the response. In this way, the fitted responses most closely match data points with the smallest estimated variance. We used a power function for several reasons. First, it is a simple function with only two parameters. Second, we empirically determined that it provided a good fit across subjects and across visual areas. Third, we recently related the shape of the power function to human perception (contrast increment thresholds) at the high-contrast range used in this study (Boynton et al., 1998). Finally, the average single-unit response in monkey primary visual cortex is approximately shaped like a power function at these high contrasts (Albrecht, 1995).

fMRI response versus contrast. MT+ responses as a function of stimulus contrast in a dyslexic subject. Thecontinuous curve is a fitted power function, and the error bars represent estimates of the noise in the fMRI responses (see Materials and Methods). Dashed line indicates the fitted response at 20% contrast.
The SD of the noise in the fMRI responses (ςiin the above equation) was estimated separately for each scan (i.e., for each stimulus contrast). The noise in the fMR images was highly correlated in adjacent voxels. It would have been incorrect, therefore, to simply compute the SD of the responses across voxels and divide by the square root of the number of voxels. Instead we noted that the (Fourier) amplitude spectrum of the time series was a smooth function of frequency, and we used the components that were not driven by the stimulus to estimate the noise in the stimulus-driven responses. Figure2A, for example, plots the average time series (averaged across MT+ in one subject) in response to a 50% contrast drifting grating stimulus. Figure 2B plots the Fourier transform of this time series. Triangles correspond to the signal frequency (six cycle/scan) along with its higher harmonics (integer multiplies of six cycles/scan). A decreasing exponential function was fit to the other (nonharmonic) frequency components (filled circles), and as illustrated in Figure 2B, the fitted value at the signal frequency (dashed line) was used as our estimate of response variability (ςi).
For the group analyses in Figures 6, 8, and 9, the fMRI response amplitudes and phases were vector-averaged across subjects. The error bars in these figures were computed as the SEM across subjects.
Defining visual brain areas. The fMRI data were analyzed separately in each of several identifiable visual areas. fMRI methods for defining the retinotopically organized visual cortical areas (V1, V2v, V2d, V3v, V3d, V3A, and V4v) are now well established (Engel et al., 1994, 1997; Sereno et al., 1995; Deyoe et al., 1996; Wandell, 1998). We used these methods as described in detail elsewhere (Engel et al., 1997) to measure both the angular (i.e., vertical to horizontal meridian) and radial dimensions (i.e., fovea to periphery) of these areas.
To determine area boundaries, we visualized these retinotopy measurements on computationally flattened representations of each subject’s brain. First, the occipital lobe gray matter was semiautomatically identified in images from a standard volume anatomy MRI scan, using a Bayesian classification algorithm (Teo et al., 1997). Second, a multidimensional scaling algorithm was used to flatten the cortical sheet in each hemisphere (Engel et al., 1997; Wandell, 1998). Third, the retinotopy measurements were projected into the flattened representation. Fourth, the locations of visual area boundaries were drawn by hand on the flattened representation as curved lines that ran along the reversals in the angular component of the retinotopic map, and that ran orthogonal to the radial component of the retinotopic map. Area boundary definitions are agreed on for the areas under study by several laboratories (Sereno et al., 1995; Deyoe et al., 1996; Engel et al., 1997; Wandell, 1998). We tried to be conservative in the process of area definition by selecting areas slightly within the area boundaries. Finally, the selected areas were projected back to three-dimensional coordinates within the gray matter of the brain. The locations of these areas in three representative dyslexic and control subjects are shown in Figure 4. We did not notice any systematic differences in the size or position of these areas between groups.

Top. Visual area locations. A, Parasagittal anatomical image from one subject indicating the slice selection (perpendicular to the calcarine sulcus) for the retinotopy measurements and the control conditions. B–D, Visual areas V1, V2, V3, V3A, and V4v depicted on in-plane anatomies from a similar location (near the middle of the 8 in-planes) in three control subjects. E–G, Visual areas depicted on in-plane anatomies from a similar location in three dyslexic subjects. Figure 5. Bottom. Location of area MT+. A, Parasagittal anatomical image from one subject indicating the slice selection (parallel to the calcarine sulcus) for the moving dots and the test conditions. The blue lines were slices that contained the MT+ region of interest (ROI) in this subject. B–D, Brain activity in one slice containing the MT+ ROI from three control subjects. Reddish voxels show regions with greater response to moving versus stationary dot patterns. Images were chosen to optimally show MT+ in the right hemisphere (arrows), although activity from left hemisphere MT+ and V1 are also present in some cases. The image in B is from the same brain as the sagittal image in A and corresponds to the most inferior of the three blue slices. The MT+ ROI was defined by outlining (dotted line in B) the strongest area of activity that was approximately lateral to the junction between the calcarine sulcus and the parieto-occipital sulcus, and beyond the retinotopically organized visual areas (see Materials and Methods). E–G, Slices with MT+ ROIs in three dyslexic subjects.
Several lines of evidence suggest that a lateral region of the occipital lobe of the human brain, human MT+, may be homologous to monkey MT+. Human and monkey MT+ appear to be similar anatomically (Tootell and Taylor, 1995) and functionally (Zeki et al., 1991, 1993;Watson et al., 1993; McCarthy et al., 1995; Tootell et al., 1995a, b;Sereno et al., 1995; Deyoe et al., 1996; Heeger et al., 1998). Area MT+ was defined, following previous fMRI studies (McCarthy et al., 1995;Tootell et al., 1995a; Sereno et al., 1995; Deyoe et al., 1996), on the basis of both anatomical and functional criteria. Anatomically, area MT+ was selected in an inferior region in the lateral occipital lobe, approximately lateral to the junction between the calcarine sulcus and the parieto-occipital sulcus, and beyond the retinotopically organized visual areas. Functionally, area MT+ was defined on the basis of fMRI responses to stimuli that alternated in time (one cycle every 36 sec for six cycles) between moving and stationary dot patterns. The dots (small white dots on a black background) moved (10°/sec) radially inward and outward for 18 sec, alternating direction once every second. Then the dot pattern was stationary for the next 18 sec. We computed the cross-correlation between each fMRI voxel’s time series and a sinusoid with the same (36 sec) temporal period. We drew (liberally) MT+ regions of interest around contiguous areas of strong activation (r > 0.35) where the response was within a 0–9 sec time lag with respect to the temporal alternation of the stimulus. Area MT+ was localized in a similar position in each subject’s brain and typically spread across two or three slices in each hemisphere. Figure 5 shows examples of three dyslexic and control subject MT+ regions.
These procedures to define the various visual brain areas were performed only once per subject. Because the fMRI data recorded during successive scanning sessions in a given subject were all aligned to a common three-dimensional coordinate grid (see above), we could localize the previously labeled visual areas across scanning sessions.
Correlations between brain activity and behavioral performance were tested for statistical significance. We used one-tailed statistical tests to test hypotheses that higher levels of brain activity in the fMRI test conditions (low mean luminance, moving) would be associated with (1) lower speed thresholds (i.e., better performance) and (2) higher reading scores. Critical values for the significance of the correlation coefficient (n = 10, df = 8) are ‖r‖ > 0.549, p < 0.05 and ‖r‖ > 0.716, p < 0.01.
RESULTS
Behavioral group differences
The control group scored higher on all reading tests and had better psychophysical thresholds than the dyslexic group (Demb et al., 1998). The reading percentile scores were significantly higher (one-tailed t tests, df = 8) for four of the five tests: spelling (control mean = 83.4, SE = 5.9; dyslexic mean = 50.0, SE = 14.7; p < 0.05); nonword reading (control mean = 77.4, SE = 5.9; dyslexic mean = 40.6, SE = 10.0; p < 0.01); reading rate (control mean = 63.4, SE = 6.2; dyslexic mean = 17.2, SE = 6.8; p < 0.005); and comprehension (control mean = 64.8, SE = 3.7; dyslexic mean = 26.0, SE = 7.7;p < 0.005). Single-word reading was only slightly better in controls than dyslexics (control mean = 82.8, SE = 3.2; dyslexic mean = 57.4, SE = 14.6; p < 0.10). Speed discrimination thresholds in controls were similar to previous reports (DeBruyn and Orban, 1988; Mckee et al., 1986), but speed thresholds were significantly elevated (worse) in the dyslexic group (control mean = 5.6, SE = 0.8; dyslexic mean = 8.4, SE = 0.6; p < 0.02).
fMRI group differences
Area MT+ was defined in each subject’s brain by measuring responses to moving versus stationary dot patterns. As mentioned above, a recent fMRI study reported almost no significant MT+ activity in dyslexics (Eden et al., 1996). We, however, found that it was possible to localize area MT+ in each hemisphere of each subject, consistent with a recent study of neuromagnetic recordings in dyslexia (Vanni et al., 1997). Examples are shown for individual control and dyslexic subjects in Figure 5. The discrepancy with the Eden et al. (1996) study might be attributable to differences in the stimuli (e.g., higher contrast) or in the subject populations.
To test for differences in brain activity between the two groups, we computed the average responses, averaged across subjects within a group, as a function of stimulus contrast. These group contrast response functions are plotted in Figures6, 8, and 9. In almost every case, these group contrast response functions increased monotonically with increasing stimulus contrast, as would be expected from previous single-unit physiology and neuroimaging studies of visual cortex (Sclar et al., 1990; Boynton et al., 1996).

Differences in brain activity between dyslexic and control groups. Group average fMRI responses in MT+ and V1 to test stimuli (low mean luminance, moving gratings) as a function of stimulus contrast. Group differences were significant (p< 0.02) in both V1 and MT+ in these test conditions designed to preferentially stimulate the M pathway. Error bars represent ±1 SEM.Continuous curves are fitted power functions.
Group contrast responses in the low mean luminance test conditions are shown for MT+ and V1 in Figure 6. The responses were higher in the control group across the full range of contrasts in both visual areas. Larger group differences are evident at higher contrasts, especially in V1.
We used a bootstrapping statistical analysis to test the hypothesis that group contrast responses were significantly lower in the dyslexic group (Efron and Tibshirani, 1993). Although there is conceptual similarity between this procedure and an ANOVA, we chose to use bootstrapping for two reasons. First, the data are continuous, not categorical. Second, the bootstrapping procedure takes into account the way we used vector averaging to compute the group mean responses (see Materials and Methods).
The bootstrapping procedure consisted of two steps: (1) randomly sample a value from the Gaussian distribution defined by the group mean and SE corresponding to each contrast level; and (2) fit the resampled data with a power function, R̀ =Acp , where R̀ is fMRI response amplitude, c is contrast, and A andp are free parameters that characterize the amplitude and shape, respectively, of the curves. These two steps were repeated 1000 times to form a bivariate distribution of the 1000 pairs of parameter values for each group. This is plotted in Figure7A for the MT+ group data. The 1000 amplitude (A) and exponent (p) parameters are plotted against each other for each group, forming two clouds of data (x = dyslexics; o = controls). We found the best linear discriminator between the two bivariate distributions (Fig.7A, dashed angled line) and projected the points onto an axis orthogonal to this angle (Fig. 7B, tilted axis). Ap value was obtained by testing the null hypothesis that the means of the two resulting univariate distributions did not differ. This was accomplished by randomly pairing and subtracting the values in the two univariate distributions twice and then finding the percentage of values in the difference distribution that fell below zero (Fig.7C). A final correction on this p value was performed given the relatively small sample size, on the basis of simulations of this procedure under the null hypothesis (Demb, 1997). For both MT+ and V1, the control group responses were significantly higher than the dyslexic group responses (Fig. 6) (p < 0.02 for both), consistent with the M pathway deficit hypothesis.
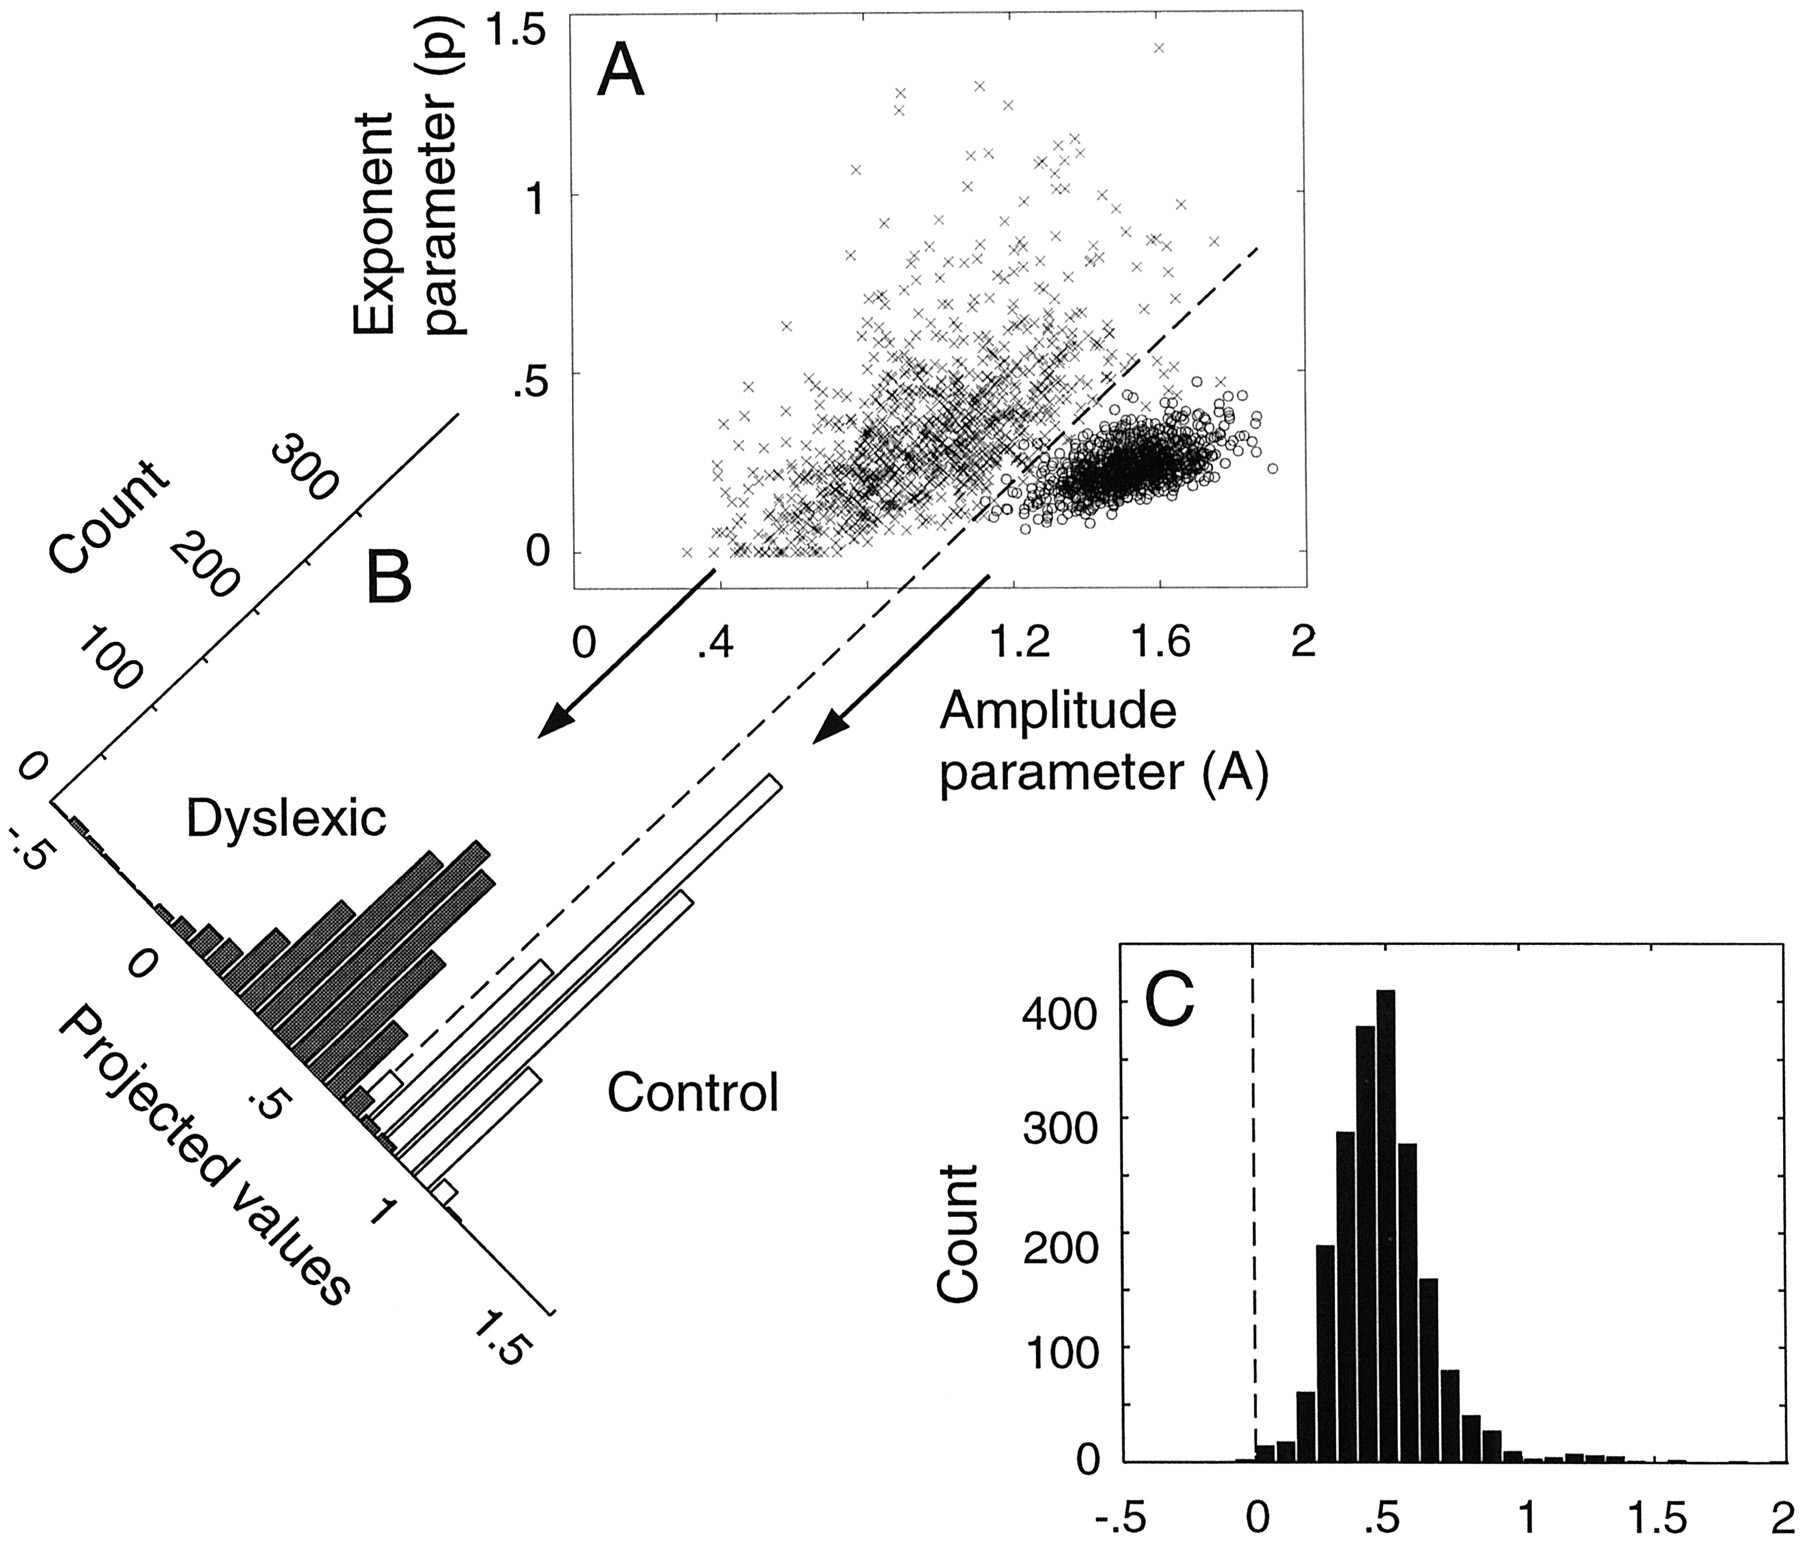
Bootstrapping statistical analysis. A, Bivariate distributions of bootstrapped power function parameters. The amplitude and exponent parameters for the 1000 bootstrapped contrast response functions are plotted for the dyslexic (x) and control (o) groups. Outliers from the dyslexic distribution (extreme exponent values) are omitted from the plot. B, The two bivariate distributions were projected onto an axis orthogonal to the best linear discriminator (dashed line) between the bivariate distributions. The resulting univariate distributions show a count of the points for dyslexic (gray) and control (white) groups. C, The difference distribution was created by randomly pairing the points from the projected univariate distributions twice and subtracting the dyslexic group values from the control group values. A final p value was derived by counting the number of values below zero (dashed line), after correcting for the sample size (Demb, 1997).
A possible alternative explanation is that the observed group differences might have been caused by general attentional or motivational factors. To test whether the effect is specific to the M pathway, we measured responses in control conditions with high mean luminance contrast-reversing gratings. As mentioned earlier, lowering the mean luminance of a visual stimulus increases the responsiveness of the M pathway relative to other visual pathways, especially at low mesopic and scotopic luminances (Purpura et al., 1988; Lee et al., 1997). In the high mean luminance control conditions, the responses in the two groups were well matched in V1 (Fig.8) (p > 0.10), again consistent with the M pathway deficit hypothesis.

Similar brain activity in dyslexic and control groups. Group average fMRI responses in V1 to control stimuli (high mean luminance, contrast-reversing gratings) as a function of stimulus contrast. Group contrast responses were well matched (p > 0.10) in these control conditions designed to stimulate other pathways in addition to the M pathway. Error bars represent ±1 SEM. Continuous curves are fitted power functions. (MT+ activity was not recorded in this condition.)
Group fMRI response amplitudes are plotted as a function of contrast for areas V2, V3, V3A, and V4v in Figure9. The dyslexic group responses were lower than the control group responses in all four extrastriate areas for the low mean luminance test conditions (Fig. 9, top row). These group differences were statistically significant at the p < 0.02 level for all visual areas except V3A; for V3A the effect was significant at the p < 0.05 level. The control group responses were consistently greater at the three highest contrasts (between 25 and 100% contrast) in all six visual areas.

Brain activity in four extrastriate areas.Top row, Group average fMRI responses in V2, V3, V3A, and V4v to test stimuli (low mean luminance, moving gratings) as a function of stimulus contrast. Control group responses were significantly greater than dyslexic group responses in all areas (p < 0.05). Bottom row, Group average fMRI responses to control stimuli (high mean luminance, contrast-reversing gratings) as a function of stimulus contrast. Dyslexic group responses were well matched or slightly higher in all areas. Error bars represent ±1 SEM. Continuous curves are fitted power functions.
The dyslexic group responses in the high mean luminance control condition (Fig. 9, bottom row) were virtually identical to, or actually higher than, the control group responses in V2, V3, V3A, and V4v. Responses were not measured in MT+ to the high mean luminance control conditions, because of the different slice orientations (Figs.4, 5). As described above, a one-tailed statistic was used to test for a stronger response in the control group. Under this hypothesis there were no significant group differences in the high mean luminance control conditions. In fact, in all cases except V1, the dyslexic group had a significantly stronger response under the opposite alternative hypothesis, although in many cases (V3, V3A, V4v) this difference was largely attributable to stronger responses at low contrasts rather than higher maximum amplitudes. The similarity between the group contrast responses in the control conditions suggests that subjects in the dyslexic group were capable of achieving responses as high or higher than those of the control group. Hence, the reduced responses in dyslexics’ brains at low mean luminance are consistent with a specific deficit in the M pathway.
We included a moving dot stimulus similar to the one used by Eden et al. (1996) in a previous fMRI study in dyslexia so that we could compare more directly the two studies. The stimuli were 1° moving dots alternating (every 36 sec) in time with a gray field, although we probably used a higher mean luminance than they did (T. Zeffiro, personal communication). We computed the cross-correlation between each fMRI voxel’s time series and a sinusoid with the same (36 sec) temporal period, which was equivalent to their statistical analysis. Figure 10 plots the maximum of the cross-correlation values from each MT+ region of interest in each subject. A correlation threshold of r = 0.75 (Fig. 10,horizontal line) is sufficient to allow 8 of 10 control hemispheres but only 3 of 10 dyslexic hemispheres to be above threshold. Their study more completely separated the groups, possibly because of differences in the makeup of the dyslexic group or subtle differences in stimulus characteristics (e.g., mean luminance).

Responses were measured to a moving dot stimulus that alternated with a gray field; stimulus parameters were similar to a previous fMRI study of dyslexia (Eden et al., 1996). After their analysis, the maximum correlation of all voxels in the MT+ ROI of each hemisphere is plotted for each subject. A line is drawn atr = 0.75 to demonstrate that under a given correlation threshold, the groups can be somewhat separated (8 of 10 control but only 3 of 10 dyslexic hemispheres above threshold), similar to the results reported by Eden et al. (1996).
Brain activity and psychophysical performance
The hypothesis for an M pathway deficit in dyslexia predicts that dyslexic subjects, on average, should perform below normal on motion discrimination tasks that depend on M pathway signals. Assuming that this M pathway deficit occurs on a continuum, this hypothesis predicts that individual differences in speed discrimination performance should be correlated with individual differences in brain activity under conditions that emphasize M pathway inputs to cortex (i.e., low mean luminance moving gratings).
In each subject, we measured a speed discrimination threshold, or the minimal increase in stimulus speed that is just noticeable (Fig. 1). The psychophysical stimulus was a moving grating, similar to that used in the fMRI experiments, presented (on average) at 20% contrast.
We compared individual differences in speed discrimination thresholds with the fitted fMRI responses at 20% contrast (Fig. 3). The results are plotted in Fig. 11 (dyslexics = black triangles; controls = white circles) with regression lines through the data when there was a significant correlation. There was a very strong negative correlation between MT+ activity and speed discrimination thresholds (r = −0.79;p < 0.005). Subjects with higher MT+ responses had lower psychophysical thresholds (better performance). The correlation was weaker but still significant in V1 (r = −0.65;p < 0.025).

Individual differences in both MT+ and V1 activity predict psychophysical speed discrimination thresholds. fMRI responses are the fitted values at 20% contrast. Psychophysical thresholds are averaged across three repeated measurements for each subject. Solid lines are regression lines through the data. Correlation between speed discrimination thresholds and MT+ activity was very strong (r = −0.79; p < 0.005). Correlation between speed thresholds and V1 activity was weaker, but still significant (r = −0.65;p < 0.025). Brain activity in V2, V3, V3A, and V4v was not correlated with speed discrimination performance.
Brain activity in the other visual areas (V2, V3, V3A, and V4v) was not significantly correlated with speed discrimination thresholds. The data shown were averaged over the dorsal and ventral representations of V2 and V3, but the results were similar when dorsal and ventral subregions were analyzed separately (r values between −0.20 and 0.01 for all).
We considered the possibility that a single datum from one subject might be an outlier, thereby dominating the effect to make an otherwise weak correlation appear strong or to make an otherwise strong correlation appear weak. To test for this possibility, we removed one subject at a time and recalculated the correlations with the remaining nine subjects. For all 10 combinations of 9 subjects, MT+ activity and performance were always significantly correlated at thep < 0.025 level. For 9 of the 10 combinations, V1 activity and performance were significantly correlated at thep < 0.05 level. For 1 of the 10 combinations, the correlation between the V3A activity and behavior was just barely significant (r = −0.59; p < 0.05). In no other visual area was activity significantly correlated with motion discrimination performance, under any of the circumstances tested.
Brain activity and reading performance
The M deficit hypothesis predicts that reading ability is strongly related to measures of M pathway integrity. Thus, individual differences in reading skills should be correlated with individual differences in brain activity under our low mean luminance moving grating conditions that emphasize M pathway inputs to cortex.
We measured the correlation between fMRI activity in the test (low mean luminance, moving grating) condition in each visual area and reading performance on the five reading tests. Scatter plots showing fitted fMRI activity versus reading rate performance are presented in Figure12 (dyslexics = black triangles; controls = white circles) with regression lines through the data. There was a very strong correlation (r = 0.80;p < 0.005) between individual differences in MT+ activity and reading rate. This plot shows the correlation between reading rate and MT+ activity at 30% contrast, where the correlation was strongest. However, the correlation was significant (p < 0.01) for contrasts ranging from 4 to 90%.

Individual differences in brain activity are strongly correlated with individual differences in reading rate.Solid lines are regression lines through the data. The responses corresponding to contrasts that produced the highest correlations are shown (MT+, ct = 30%, r = 0.80; V1, ct = 85%, r = 0.68; V2, ct = 100%,r = 0.80; V3, ct = 100%, r = 0.77; V3A, ct = 53%, r = 0.60; V4v, ct = 100%, r = 0.80), although the correlations were significant across a wide range of contrasts in all areas (see Results). Reading rates are reported as percentile scores. The dyslexic subject with a high reading rate scored quite poorly on other reading measures, including the reading comprehension score of the Nelson-Denny reading test.
The correlation between individual differences in brain activity and reading rate was weaker in V1 than in MT+. Even so, there was a range of contrasts (from 31 to 100%) for which the correlation was significant at the p < 0.05 level, consistent with the hypothesis that the M deficit is precortical (Livingstone et al., 1991). Correlations were significant for the four other visual areas as well. For all areas, there was a range of contrasts for which the correlations were significant at p < 0.05 (MT+ range, 3 to 100%; V1 range, 31 to 100%; V2 range, 54 to 100%; V3 range, 52 to 100%; V3A range, 14 to 92%; V4v range, 70 to 100%). MT+ response amplitudes at the lowest contrasts were higher than the other areas. This may explain why the correlation with reading rate could be observed at lower contrast levels in MT+.
Correlations between brain activity and reading comprehension were significant in V2 (r = 0.65), V3 (r = 0.78), V3A (r = 0.58), and V4v (r = 0.72) (data not shown). The correlations in V1 and MT+ increased to become significant with one of the subjects removed. This subject was a dyslexic with strong V1 and MT+ activity who read quickly but did not do well on the comprehension questions. The only other significant correlation between reading ability and brain activity was between V3 activity and non-word reading (r = 0.58; data not shown). Scores on the single-word reading and spelling tests were not correlated with activity in any of the brain areas. The correlation with spelling might have been expected based on reports of impaired spelling, in addition to impaired reading speed, in compensated dyslexics (Lefly and Pennington, 1991).
Additional findings
We ran an additional set of conditions in all subjects in which we presented a contrast-reversing grating instead of a moving grating. This stimulus had the same spatial frequency (0.4 cycle/°) and low mean luminance (2 cd/m2) as the moving grating, and we measured responses at several contrasts (6, 12, 25, 50, and 100%). However, the signal from these conditions was quite low across both groups of subjects (data not shown). There was a trend toward a significant group difference in V1 (p < 0.10), but there was no group difference in V2, V3, V3A, or V4v (MT+ responses were not measured in these conditions). The overall amplitudes of the moving test stimuli and the high mean luminance control stimuli were much stronger and more similar in magnitude to one another, and so we focused on those two conditions. We did not observe a group difference in the low mean luminance, contrast-reversing conditions for two possible reasons. First, the weak signals evoked by this condition may have been too noisy to see a reliable group difference statistically. Second, moving stimuli may be better than contrast-reversing stimuli for assaying M pathway integrity. Indeed, Merigan and Maunsell (1990)reported that M pathway-lesioned monkeys were more impaired at contrast sensitivity measured with moving gratings than with contrast-reversing gratings.
We checked to see whether activity related to the control stimulus (high mean luminance, contrast reversing) was correlated with the speed thresholds or any of the reading tests in any of the brain areas. There were no significant correlations in any of these comparisons (although MT+ responses were not measured in these conditions), consistent with the M deficit hypothesis.
DISCUSSION
Group differences
The first main finding of this study was that fMRI responses in a group of dyslexic subjects were significantly lower than control group responses in V1 and several extrastriate areas (MT+, V2, V3, V3A, V4v) in response to low mean luminance, moving grating stimuli of various contrasts (test conditions). However, dyslexic group responses were similar or actually higher than controls in response to higher mean luminance, contrast-reversing grating stimuli (control conditions). This implies that the dyslexic group was capable of achieving the same response amplitudes as the control group in certain conditions, and that general attentional or motivational factors cannot explain the group differences in the low mean luminance test conditions. Using a low mean luminance emphasizes M pathway inputs to cortex (Purpura et al., 1988; Lee et al., 1997). Therefore, our results are consistent with a specific M pathway deficit in dyslexia.
A previous fMRI study in dyslexia reported a difference in MT+ during perception of moving dots, but they did not report responses in V1 during this condition (Eden et al., 1996). Previous VEP studies have suggested that differences between dyslexic and control groups arise from differences in signals at V1 (e.g., Livingstone et al., 1991), but exact localization of these VEP signals is not possible. Our study is the first to show conclusively that there is a physiological group difference as early as V1. This is consistent with the hypothesis, based on anatomical data from LGN, that the M deficit is precortical (Livingstone et al., 1991).
Brain activity and psychophysical performance
The second main finding of this study was that brain activity in visual areas V1 and MT+ was correlated with individual differences in motion discrimination performance. Subjects with stronger fMRI responses in these brain areas had lower speed discrimination thresholds, suggesting that neuronal signals in these brain areas support visual motion perception. These results are consistent with studies of the monkey brain, which have shown that monkey V1 and MT+ play prominent roles in the “motion pathway” (Merigan and Maunsell, 1993). Our study is the first to show a link between individual differences in brain activity and human motion perception. Indeed, it is one of relatively few studies showing a correlation between individual differences in brain and behavior of any kind (Britten et al., 1992; Recanzone et al., 1992; Logan and Grafton, 1995; Cahill et al., 1996; Kosslyn et al., 1996; Nyberg et al., 1996; Pugh et al., 1997).
The role of human MT+ in motion perception has been addressed by previous studies using complementary techniques. Patients with lesions that include this brain area show deficits in motion perception (Zihl and Cramon, 1983; Zihl et al., 1991), and transcranial magnetic stimulation near MT+ in healthy volunteers interferes with motion perception (Beckers and Homberg, 1992; Hotson et al., 1994; Beckers and Zeki, 1995). Functional neuroimaging studies have shown that MT+ is active when subjects perceive illusory motion in stationary displays (Zeki et al., 1993; Tootell et al., 1995b), that activity in MT+ can be modulated by instructing subjects to selectively attend to moving stimuli (Corbetta et al., 1991; Beauchamp et al., 1997; O’Craven et al., 1997), and that MT+ activity exhibits motion opponency that is believed to reflect mutual suppression between populations of neurons sensitive to motions in opposite directions (Heeger et al., 1998).
In the monkey, MT+ is also widely viewed as the cornerstone of a “motion pathway” because a strong empirical link has been established between neural activity in MT+ and the perception of motion (Siegel and Andersen, 1986; Newsome and Pare, 1988; Logothetis and Schall, 1989; Newsome et al., 1989; Salzman et al., 1990, 1992; Britten et al., 1992; Celebrini and Newsome, 1994, 1995; Pasternak and Merigan, 1994; Orban et al., 1995).
We found that speed discrimination thresholds were not correlated with brain activity in several other cortical areas. In the monkey, some of these cortical areas (e.g., V2 and V3) are known to contain direction-selective neurons (Levitt et al., 1994; Gegenfurtner et al., 1997), and they are known to be anatomically connected in the motion pathway (Maunsell and VanEssen, 1983; Deyoe and VanEssen, 1985; Shipp and Zeki, 1985; Livingstone and Hubel, 1987; Felleman et al., 1997). There are four obvious possible explanations for why activity in these areas was not correlated with behavior in our experiments. First, correlations might have been higher if we had been able to resolve and measure signals within the subdivisions of these areas (e.g., thick stripe subdivision of V2) that are known in the monkey to receive M pathway input and project to MT+. Second, the physiology and anatomical connections of V2 and V3 could be different in humans and monkeys. Third, these cortical areas may not be involved in speed perception judgments, even though they are involved in some other aspects of motion perception, e.g., detecting motion boundaries (Reppas et al., 1997). Fourth, these areas may be more involved in speed discrimination under different stimulus conditions, e.g., slowly moving isoluminant gratings (Gegenfurtner et al., 1997).
The observed negative correlation between (V1 and MT+) brain activity and speed discrimination thresholds has implications for theories about the neural computations underlying motion perception. Subjects with higher levels of brain activity would presumably have better signal-to-noise and hence better discrimination performance; however, a specific model of speed discrimination performance has yet to be developed.
Brain activity and reading performance
The third main finding of this study was that brain activity in V1 and all of the identified extrastriate areas was correlated with individual differences on a measure of reading speed. In fact, brain activity elicited by our simple visual paradigm could explain up to 64% of the variance on this particular measure of reading ability. Many bright, motivated dyslexic university students compensate for reading difficulties by bringing other cognitive abilities to the task, but they appear to do so at the cost of reading slowly (Shaywitz et al., 1995). Dyslexic subjects in the present study took regular classes but required extra time on course testing because of their slow reading. A study of compensated dyslexics found that reading speed was still affected, even when all or most other reading skills were normal (Lefly and Pennington, 1991). Thus, reading rate may be the most sensitive marker of dyslexia in adults with a childhood history of dyslexia and some level of compensation in adulthood.
In addition, reading rate was strongly correlated with motion discrimination performance, a psychophysical measure of M pathway integrity. The correlation between individual differences on reading speed and the speed discrimination threshold in these subjects wasr = 0.84 (Demb et al., 1998). Thus, there was a strong three-way correlation between V1 and MT+ brain activity, speed discrimination thresholds, and reading speed.
The M pathway deficit in dyslexia
Although it is possible that an M deficit is only acorrelate of dyslexia, it is difficult to imagine that an abnormality in such a significant visual pathway would fail to have consequences for a complex visual behavior like reading. One hypothesis is that a transient visual pathway (i.e., the M pathway) normally inhibits activity in a sustained visual pathway (i.e., the parvocellular pathway) during a saccade. A disruption of this transient-on-sustained inhibition in dyslexia would result in a blurring of the visual input across successive fixations, resulting in a confusion about the order of letters on a page (Williams and Lovegrove, 1992; Breitmeyer, 1993). However, more recent evidence suggests that the M pathway, rather than the parvocellular pathway, is normally inhibited during saccades (Ross et al., 1996). Thus, this theory will require modification to adequately explain how a deficient M pathway could result in reading difficulty. Another theory, posed by Stein and colleagues (Stein et al., 1987; Stein and Walsh, 1997), suggests that a deficient M pathway could cause destabilized binocular fixation that would result in reading difficulty.
An alternative possibility is that the M pathway deficit is only a marker for a more general deficit in fast temporal processing with no direct causal relationship (Tallal et al., 1993; Farmer and Klein, 1995). Even if there were no causal relationship, psychophysical or neural measures of M pathway integrity could be clinically useful. For example, a measure of M pathway integrity might be used as an objective clinical marker for the disorder, perhaps even in young children before reading age. This would obviously require that our results be replicated on a wider range of subjects (e.g., non-university students, different age groups). Also, measures of M pathway integrity might be used to distinguish subtypes of dyslexia (Borsting et al., 1996; Ridder et al., 1997; Spinelli et al., 1997). Finally, the examination of M pathway integrity in dyslexia could advance our understanding of the disorder at molecular and genetic levels. Prasad et al. (1997), for example, recently reported magnocellular layer-specific genes within a region of human chromosome 6 (6P21.3) that had previously been linked to dyslexia (Smith et al., 1998). Thus even if the visual deficit is not causally related with dyslexia, valuable lessons may be learned from the visual system analyses that could be used to test alternative hypotheses in other neural systems.
Footnotes
This work was supported by a Stanford Graduate Research Opportunities grant to J.B.D.; by a National Institute of Mental Health (NIMH) postdoctoral research fellowship (F32-MH10897) to G.M.B.; by a National Institutes of Health National Center for Research Resources grant (P41-RR09784) to G.H.G.; and by an NIMH grant (R29-MH50228), a Stanford University Research Incentive Fund grant, a grant from the Orton Dyslexia Society, and an Alfred P. Sloan Research Fellowship to D.J.H. Special thanks to B. A. Wandell for generous support and advice and for critically reading an earlier version of this manuscript, G. H. Glover (and the Richard M. Lucas Center for Magnetic Resonance Spectroscopy and Imaging) for technical support, and M. Best for assistance with the reading tests.
Correspondence should be addressed to David Heeger, Department of Psychology, Stanford University, Stanford, CA 94305-2130.
Dr. Demb’s present address: Department of Neuroscience, University of Pennsylvania Medical School, Philadelphia, PA 19104-6058.


