

Article Figures & Data
Figures
- Fig. 1.
Growth factors inhibit Na+currents. A, Representative time course of NGF-induced inhibition of whole-cell Na+ currents in PC12 cells expressing wtPDGF receptors. PC12 cells were differentiated with 20 ng/ml PDGF for a period of 4–6 d. Differentiated cells were then held at −90 mV and given sequential 10 mV steps from −60 to 60 mV in 1.5 sec intervals to determine the voltage of peak current amplitude. Command steps to induce peak current amplitudes (open diamonds) were then given every 5 sec before, during, and after acute application of 100 ng/ml NGF (horizontal bar); *selected current traces shown in theinset. B, Representative time course of 20 ng/ml PDGF-induced inhibition of whole-cell Na+currents in PC12 cells differentiated by chronic treatment with 100 ng/ml NGF. Electrophysiological protocols are identical to those described in A; * indicates selected currenttraces that are shown in the inset.C, Cumulative data for the inhibition and recovery of Na+ currents in response to acute application of either 100 ng/ml NGF or 20 ng/ml PDGF. Whole-cell Na+ currents recorded during or after growth factor treatment were normalized to whole-cell currents recorded before growth factor applications. Error bars represent the mean ± SEM of normalized Na+ currents for the indicated growth factor; †The current after recovery from growth factor inhibition is statistically significant from the fully inhibited current. The values of n for experimental groups are, from left to right, 13, 6, 21, and 12.
- Fig. 2.
Inhibition of Na+currents by NGF (100 ng/ml) or PDGF (20 ng/ml) is reduced by inhibitors specific for the wtPDGF and trkA receptors. A, Representative time courses of NGF- and PDGF-induced inhibition of whole-cell Na+ currents in differentiated cells loaded with either 25 μm AG879 (open diamonds) or 10 μm AG9 (closed diamonds). Differentiation protocols and electrophysiological protocols for determining voltages of peak current amplitudes are identical to those described in Figure 1. After achieving whole-cell access, the intracellular solution containing the indicated inhibitor was allowed to diffuse into the cell for a period of 3–5 min. Peak Na+ current amplitudes were subsequently recorded before and during acute application of the indicated growth factor (horizontal bar). For comparison, currents were normalized to the total whole-cell current recorded before growth factor application. B, Representative currenttraces selected from A.Traces depict total whole-cell current and the total current remaining after the indicated growth factor in the presence of the indicated inhibitor reached its maximum effect. C, Cumulative data from A. Error bars represent mean ± SEM of peak Na+ currents normalized to the total current recorded before indicated growth factor application; † indicates a statistically significant difference from cells that were not subjected to RTK inhibitors. The values of n for experimental groups are, from left toright, 13, 11, 9, 10, 11, and 13.
- Fig. 3.
Activation of either EGF or bFGF receptors inhibits Na+ current. A,B, Results are shown from two PDGF receptor-expressing PC12 cells that had been differentiated by chronic NGF treatment. Peak Na+ current amplitudes (open diamonds) are plotted as a function of time, showing inhibition in response to EGF (A) or bFGF (B) application (horizontal bars). Currents were evoked every 5 sec; *Selection of raw datatraces shown in the insets.
- Fig. 4.
Current–voltage and steady-state inactivation plots for Na+ currents inhibited by growth factor receptor activation. A, Results are shown from two wtPDGF receptor-expressing cells that had been differentiated by chronic application of 20 ng/ml PDGF (left) or 100 ng/ml NGF (right). Cells were held at −90 mV, and command steps from −60 to 60 mV in 10 mV intervals were given every 5 sec before growth factor application (closed diamonds) and after the acute application of the indicated growth factor had reached its maximum effect (open diamonds). B, Results are shown from two wtPDGF receptor-expressing cells that had been differentiated by chronic PDGF (left) or NGF (right) treatment. Cells were sequentially held at each of the indicated potentials for 3 sec before a command step to −10 mV to evoke Na+ current. The protocol was then repeated in the presence of acutely applied NGF (100 ng/ml) or PDGF (20 ng/ml). Peak current amplitudes were normalized to the current obtained from the −110 mV hold. Fitted curves are of the form:I/Imax = 1/1 + exp(Vhold −V1/2/k), whereVhold is the holding voltage from which the command step was evoked, V1/2 is the voltage corresponding to half-inactivation of the current, and kis the slope constant. The mean ± SEM shift inV1/2 in response to NGF was 10.0 ± 1.3 mV (n = 10 cells). The mean ± SEM shift inV1/2 in response to PDGF was 8.5 ± 0.8 mV (n = 6 cells).
- Fig. 5.
NGF- and PDGF-induced Na+ current inhibition are both mutually occlusive, suggesting a common signaling pathway. A, Na+ currents (open diamonds) were recorded from differentiated PC12 cells expressing the wtPDGF receptor. During whole-cell recording sessions, NGF (100 ng/ml) was applied (upper bar). When the NGF response reached a maximum, PDGF (20 ng/ml) was then applied (lower bar).Inset, Representative Na+ currenttraces depicting total current, the current remaining after subsequent application of NGF, and the current remaining after application of PDGF. B, Na+ currents were recorded from differentiated PC12 cells expressing the wtPDGF receptor. During whole-cell recording sessions, PDGF (20 ng/ml) was applied (upper bar). When the PDGF response reached a maximum, NGF (100 ng/ml) was then applied (lower bar). Inset, Representative Na+ current traces depicting total current, the current remaining after subsequent application of PDGF, and the current remaining after the application of NGF.
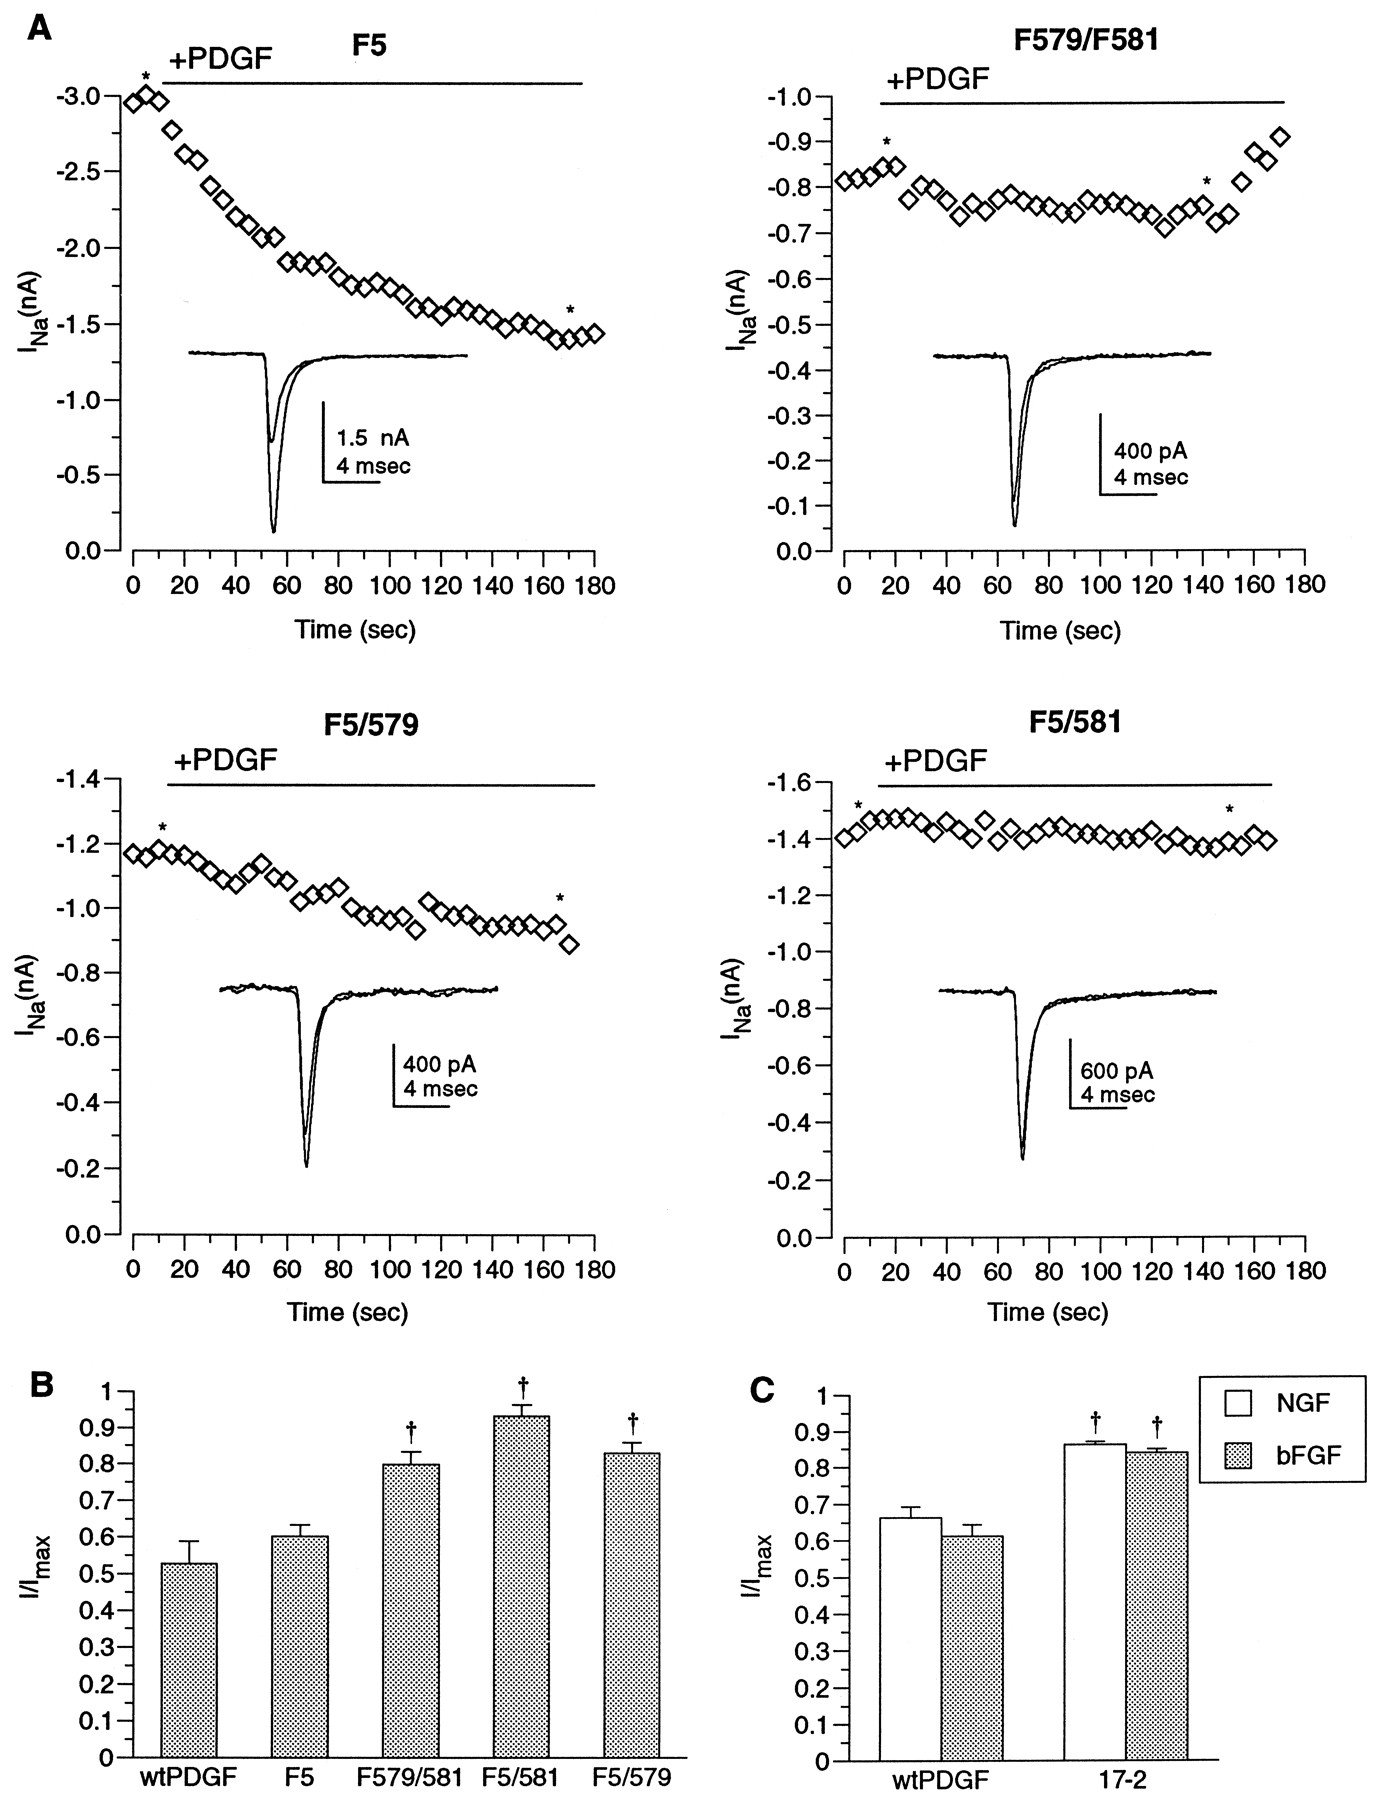
- Fig. 6.
Analysis of growth factor-induced inhibition of Na+ current in PC12 cells expressing mutant PDGF receptors or a dominant-negative Ras mutant. A, PC12 cells expressing either F5, F579/581, F5/579, or F5/581 mutant PDGF receptors were differentiated by chronic treatment with 100 ng/ml NGF. Peak Na+ current amplitudes (open diamonds) are plotted as a function of time, showing inhibition in response to 20 ng/ml PDGF (horizontal bars). Recording protocols are described in Figure 1; *Raw datatraces selected for insets.B, Cumulative data for experiments described inA are shown. Whole-cell currents recorded during growth factor application were normalized to whole-cell currents recorded before growth factor application. Error bars represent the mean ± SEM of normalized Na+ current amplitudes;†Statistically significant difference from PC12 cells expressing the wtPDGF receptor. The values of n for each experimental group are, from left to right, 10, 20, 20, 15, and 14.C, Cumulative data for experiments with 17-2 PC12 cells, which express the dominant-negative mutant N17 Ras, are shown. Error bars represent the mean ± SEM of normalized whole-cell Na+ currents after acute application of 100 ng/ml NGF (solid columns) or 50 ng/ml bFGF (shaded columns) reached its maximum effect in either 17-2 cells or PC12 cells expressing the wtPDGF receptor; †Statistically significant difference from PC12 cells expressing the wtPDGF receptor. The values of n for each experimental group are, from left to right, 10, 8, 10, and 10.


