

Abstract
Increases in astroglial Cl− conductance accompany changes in cell morphology and disassembly of cytoskeletal actin, but Cl− channels underlying these conductance increases have not been described. We characterize an outwardly rectifying Cl− channel in rodent neocortical cultured astrocytes and describe how cell shape and cytoskeletal actin modulate channel gating. In inside-out patch-clamp recordings from cultured astrocytes, outwardly rectifying Cl− channels either were spontaneously active or inducible in quiescent patches by depolarizing voltage steps. Average single-channel conductance was 36 pS between −60 and −80 mV and was 75 pS between 60 and 80 mV in symmetrical (150 mm NaCl) solutions. The permeability ratio (PNa/PCl) was 0.14 at lower ionic strength but increased at higher salt concentrations. Both ATP and 4,4-diisothiocyanostilbene-2,2′-disulfonic acid produced a flicker block, whereas Zn2+ produced complete inhibition of channel activity.
The frequency of observing both spontaneous and inducible Cl− channel activity was markedly higher in stellate than in flat, polygonally shaped astrocytes. In addition, cytoskeletal actin modulated channel open-state probability (PO) and conductance at negative membrane potentials, controlling the degree of outward rectification. Direct application of phalloidin, which stabilizes actin, preserved lowPO and promoted lower conductance levels at negative potentials. Lower PO also was induced by direct application of polymerized actin. The actions of phalloidin and actin were reversed by coapplication of gelsolin and cytochalasin D, respectively. These results provide the first report of an outwardly rectifying Cl− channel in neocortical astrocytes and demonstrate how changes in cell shape and cytoskeletal actin may control Cl− conductance in these cells.
Changes in Cl−conductance are likely to have profound consequences for astroglial function in brain. Cl− serves as an important counter-ion to K+ movement and is a transported species on ion exchangers and transporters carrying H+ equivalents (Kimelberg et al., 1986). Because astrocytes are believed to regulate neuronal activity via active maintenance of interstitial K+ and pH (Orkand et al., 1966; Chesler, 1990), changes in Cl−conductance may be an important means by which astrocytes shape brain cell signaling.
Previously, we have shown that increases in Cl−conductance accompany changes in astroglial morphology and the disruption of the actin cytoskeleton (Lascola and Kraig, 1996). These results suggested that cytoskeletal actin may be part of a novel signaling mechanism in astrocytes, and the results added to the growing concept that cytoskeletal elements can modulate ion channel function (Cantiello et al., 1991; Johnson and Byerly, 1993; Rosenmund and Westbrook, 1993; Suzuki et al., 1993; Haussler et al., 1994; Schwiebert et al., 1994; Levitan et al., 1995; Ismailov et al., 1997). A dynamic cytoskeleton therefore may be one mechanism by which astrocytes couple changes in cell and brain function to the dramatic changes in their morphology accompanying such processes as reactive astrocytosis.
Cl− channels that may be responsible for morphology-dependent Cl− conductance increases in astrocytes have not yet been characterized at the single-channel level. To date, three Cl− channels have been reported in cortical astrocytes, but the activation and kinetic properties of these channels do not match the characteristics of morphology-dependent and actin-dependent whole-cell Cl− currents. Bormann and Kettenmann (1988) have analyzed single Cl−channels activated by GABA in astrocytes that possess kinetic behavior and conductance substates similar to those described for neuronal GABA-activated Cl− channels. Sonnhof (1987), Nowak et al. (1987), and Jalonen (1993) have studied a large conductance astroglial anion channel found in many cell types, the open-state probability of which rapidly declines with polarization to either positive or negative potentials. Finally, Nowak et al. (1987) reported the activation of a small, 5 pS channel in outside-out patches from cultured rat astrocytes that gated at hyperpolarizing potentials. Morphology-dependent whole-cell Cl− currents in astrocytes have either a linear or outwardly rectifying current–voltage relationship, variably express voltage-dependent activation and inactivation kinetics, and do not require GABA (Lascola and Kraig, 1996).
In this paper we characterize an outwardly rectifying Cl−-selective channel (ORCC), previously undescribed in astrocytes, that shares kinetic and pharmacological features with morphology-dependent and actin-dependent astroglial whole-cell Cl− currents. Moreover, the frequency of observing channel activity increases in patches excised from morphologically transformed cells. In addition, we also show that alteration of actin polymerization in membrane patches controls channel rectification by modulating channel PO and conductance, particularly at negative membrane potentials. Because astrocytes are nonexcitable cells within the nervous system and therefore function at membrane potentials exclusively within a negative voltage range, the results described below suggest that cytoskeletal actin may gate ∼80–90% of whole-cell Cl−current caused by ORCCs at membrane potentials physiologically and pathologically relevant to astrocytic function.
MATERIALS AND METHODS
Cell culture preparation. Neocortical type 1 astrocytes were prepared according to the methods of McCarthy and DeVellis (1980), as described previously (Lascola and Kraig, 1996). Recordings were made between days 3 and 7 after secondary plating and before the cells reached monolayer confluence. Both flat, polygonal (control) and stellate astrocytes were examined for Cl− channels. Control cells were introduced directly to recording solutions from DMEM. Control cells were transformed into a stellate morphology by incubation in Ringer’s solution for 2–6 hr (Moonen, 1975; Lascola and Kraig, 1996) at 37°C. Stellate cells had rounded-up cell bodies and multiple cell processes.
Solutions. For most inside-out patch-clamp recordings, the following solutions were used. Bath contained (in mm): 150 NaCl, 2 MgCl2, and 10N-tris(hydroxymethyl) methyl-2-aminoethane-sulfonic acid (TES), pH 7.4. Pipette contained (in mm): 150 NaCl, 2 CaCl2, 10 TES, and 0.1 GdCl3. The choice of TES instead of HEPES as a buffer was based on preliminary experiments demonstrating that HEPES reduced the outward rectifier conductance by ∼25–40%, corroborating the results of Hanrahan and Tabcharani (1990), who showed significant inhibition of an epithelial ORCC by HEPES, but not by TES. Gd3+, a general cation channel blocker, was included in the pipette to block cation and stretch-activated channels (Yang and Sachs, 1989) and to help stabilize the membrane–pipette seal. Gd3+ did not significantly change the open or closed dwell times, burst durations, or open-state probability of the astroglial ORCC.
To examine Cl− selectivity in inside-out patch experiments, we changed Cl− concentrations by isosmotic replacement of NaCl in either the bath or pipette solutions. Patch integrity was stable during solution changes to higher ionic strengths (e.g., 300–600 mm [NaCl]o). Patch instability accompanied the bath NaCl exchange from 150 to 50 mm; therefore, in these experiments 200 mmsucrose was added to the 50 mm NaCl solution to maintain osmolarity.
Electrophysiology. Cl− channel currents were recorded by using the inside-out and cell-attached patch-clamp techniques (Hamill et al., 1981). Pipettes were pulled in four to five stages, heat-polished on a Narishige microforge (model MF-83, Setagaya-KU, Tokyo, Japan), and had resistances of 3–6 MΩ when filled with a 150 mm NaCl solution. The bath was grounded via an agar bridge having the same NaCl composition as the pipette solution. Membrane potential was set manually on the Axopatch 200A (Axon Instruments, Foster City, CA), and neither series resistance nor capacitance compensation was used.
Electrophysiological recordings were performed at room temperature (20–22°C). Currents were recorded directly onto hard disk or optical disk via a Digidata 1200 A/D converter (Axon Instruments) interfaced with an IBM-compatible computer (AST Premmia 486/66d; Irvine, CA). Single-channel currents were low-pass-filtered with an eight-pole Bessel filter (902LPF, Frequency Devices, Haverhill, MA) set at a corner frequency (−3 dB) of 300–600 Hz and sampled at 100 μsec per point. Data were analyzed on a 486/66 computer (AST), using the pCLAMP (Axon Instruments) software suite and ORIGIN statistical software (Microcal Software, Northhampton, MA). Single-channel openings were evaluated by using a threshold method in FETCHAN (pCLAMP) set at 50% of the single-channel open current. A relative measure of time spent in the open state (PO) was calculated quantitatively in pSTAT (pCLAMP) from event list files generated in FETCHAN.
The relative permeability of the channel for Cl−over Na+(PCl/PNa) was calculated from zero current potentials (VO) by using the Goldman–Hodgkin–Katz equation (Goldman, 1943). Single-channel current–voltage (I–V) plots were fit by using a third-order polynomial, and zero current potentials were determined from the abscissa intersections of the polynomials. Cl− and Na+ activities were calculated by the modified Debye–Huckel formula (Robinson and Stokes, 1965). Slope conductances were determined by linear regression over the voltage ranges of interest.
Open and closed time distributions were fit with least-squares fitting routines (Simplex and Levenberg–Marquardt) in pSTAT and ORIGIN. Curve fitting was performed first in pSTAT (Axon Instruments), and then it was performed again in ORIGIN (Microcal); the time and proportionality constants obtained from both fitting algorithms were compared for agreement.
Open, closed, and burst duration histograms were fit according to the methods of Colquhoun and Hawkes (1981). Determination of the interburst interval, the minimum value of a closed duration that separates bursts, was estimated according to the methods of Sigurdson et al. (1987) and was performed in pSTAT.
Statistics. Data were expressed as mean ± SEM. Student’s t test was used to evaluate significance.
Materials. Gelsolin (Sigma, St. Louis, MO) was used at a final activity of 1 U/ml. Gelsolin was made up in a solution of 150 NaCl, 20 mm Tris, 200 μmCaCl2, 200 μm MgATP, and 0.2 mm EGTA (final free [Ca2+] = 45 μm), pH 7.4 (NaOH), and frozen in 5 μl (5 μg/ml protein) aliquots at −70°C until the time of experiment. Gelsolin was introduced directly to the 500 μl recording bath.
Lyophilized actin (Sigma) was dissolved in a low ionic strength buffer (Cantiello et al., 1991) containing (in mm) 0.5 Tris-Cl, 0.2 CaCl2, 0.5 ATP, and 0.5 β-mercaptoethanol, pH 8.0, at a concentration of 50 mg/ml in 10 μl aliquots and rapidly was frozen to −70°C. To make a mixed solution of long actin polymers, short polymers, and monomers, we diluted aliquots into a 100 μl solution containing 150 NaCl, 2 Mg ATP, and 10 TES, pH 7.4 (NaOH), and incubated the solution for 12 hr at 37°C. The mixed polymer/monomer solution was added to the 500 μl recording bath for a final concentration of 1 mg/ml.
Phalloidin and cytochalasin D (both from Sigma) were solubilized in methanol and DMSO, respectively, and stored in stock solutions at −20°C. Fetal calf serum for culture media was obtained from Life Technologies (Grand Island, NY).
RESULTS
Activation in inside-out patches
When inside-out patches were excised from cultured astrocytes, ORCCs either were spontaneously active or were activated by applying depolarizing voltage pulses to ≥60 mV lasting seconds to minutes. Once activated, ORCCs remained active and quickly progressed toward a relatively high open-state probability at both positive and negative membrane potentials (Fig.1A,B). This pattern of either spontaneous activity or activation after depolarizing voltage pulses is characteristic of ORCCs that are observed in epithelial (Tabcharani and Hanrahan, 1991), neuronal (Franciolini and Nonner, 1987, 1994), and muscle cells (Fahlke et al., 1992).

Outwardly rectifying Cl−channel (ORCC) activity in inside-out patches from cultured rat astrocytes. ORCCs either were spontaneously active or required high-voltage pulses for activation (see Results) when patches were excised in symmetrical 150 mm NaCl solutions.A, Noncontiguous current traces of the ORCC at 1 sec intervals at membrane potentials from −60 to 60 mV in 20 mV increments. The channel from which these traces were obtained was activated after the patch potential was stepped to 60 mV for 45 sec. The C adjacent to the dotted lineindicates the closed state of the channel. B, Current traces of 10 sec from which the −40 and 40 mV traces were taken inA are displayed to illustrate channel activity over an extended period of time. C, Single-channelI–V plot demonstrating the outward rectification of the channel. Slope conductance was 36 pS between −80 and −60 mV and was 75 pS between 60 and 80 mV.
To provide a basis with which to compare channel expression and activity in patches excised from different experimental populations of astrocytes, we used a standardized voltage protocol similar to that developed by Welsh et al. (1989) and Tabcharani and Hanrahan (1991) for epithelial cells. After patch excision, patches were held at −30 mV for 2 min. If channel activity was observed, channels were classified as “spontaneous.” The time period of 2 min was established by experiments demonstrating that channels not active within 2 min at −30 mV thereafter would never become “spontaneously” active. Patches without spontaneously active channels were stepped to 60 mV next and held at this potential for 1 min. If no channel activity was observed under these conditions, then the patch was stepped back and forth between 0 and 60 mV for 10 sec at each potential for an additional 1 min. Stepping back to 0 mV was necessary because in ∼20–30% of patches Cl− channels exhibited depolarization-dependent inactivation (Fig.2) at potentials ≥60 mV. If channel activity still was not observed after these steps, the same pattern of voltage pulses was repeated to 90 mV and then to 120 mV. Channels in patches pulsed to ≥60 mV were classified as “voltage-activated.” Patches not demonstrating channel activity after voltage pulses to 120 mV were assumed not to contain Cl− channels.
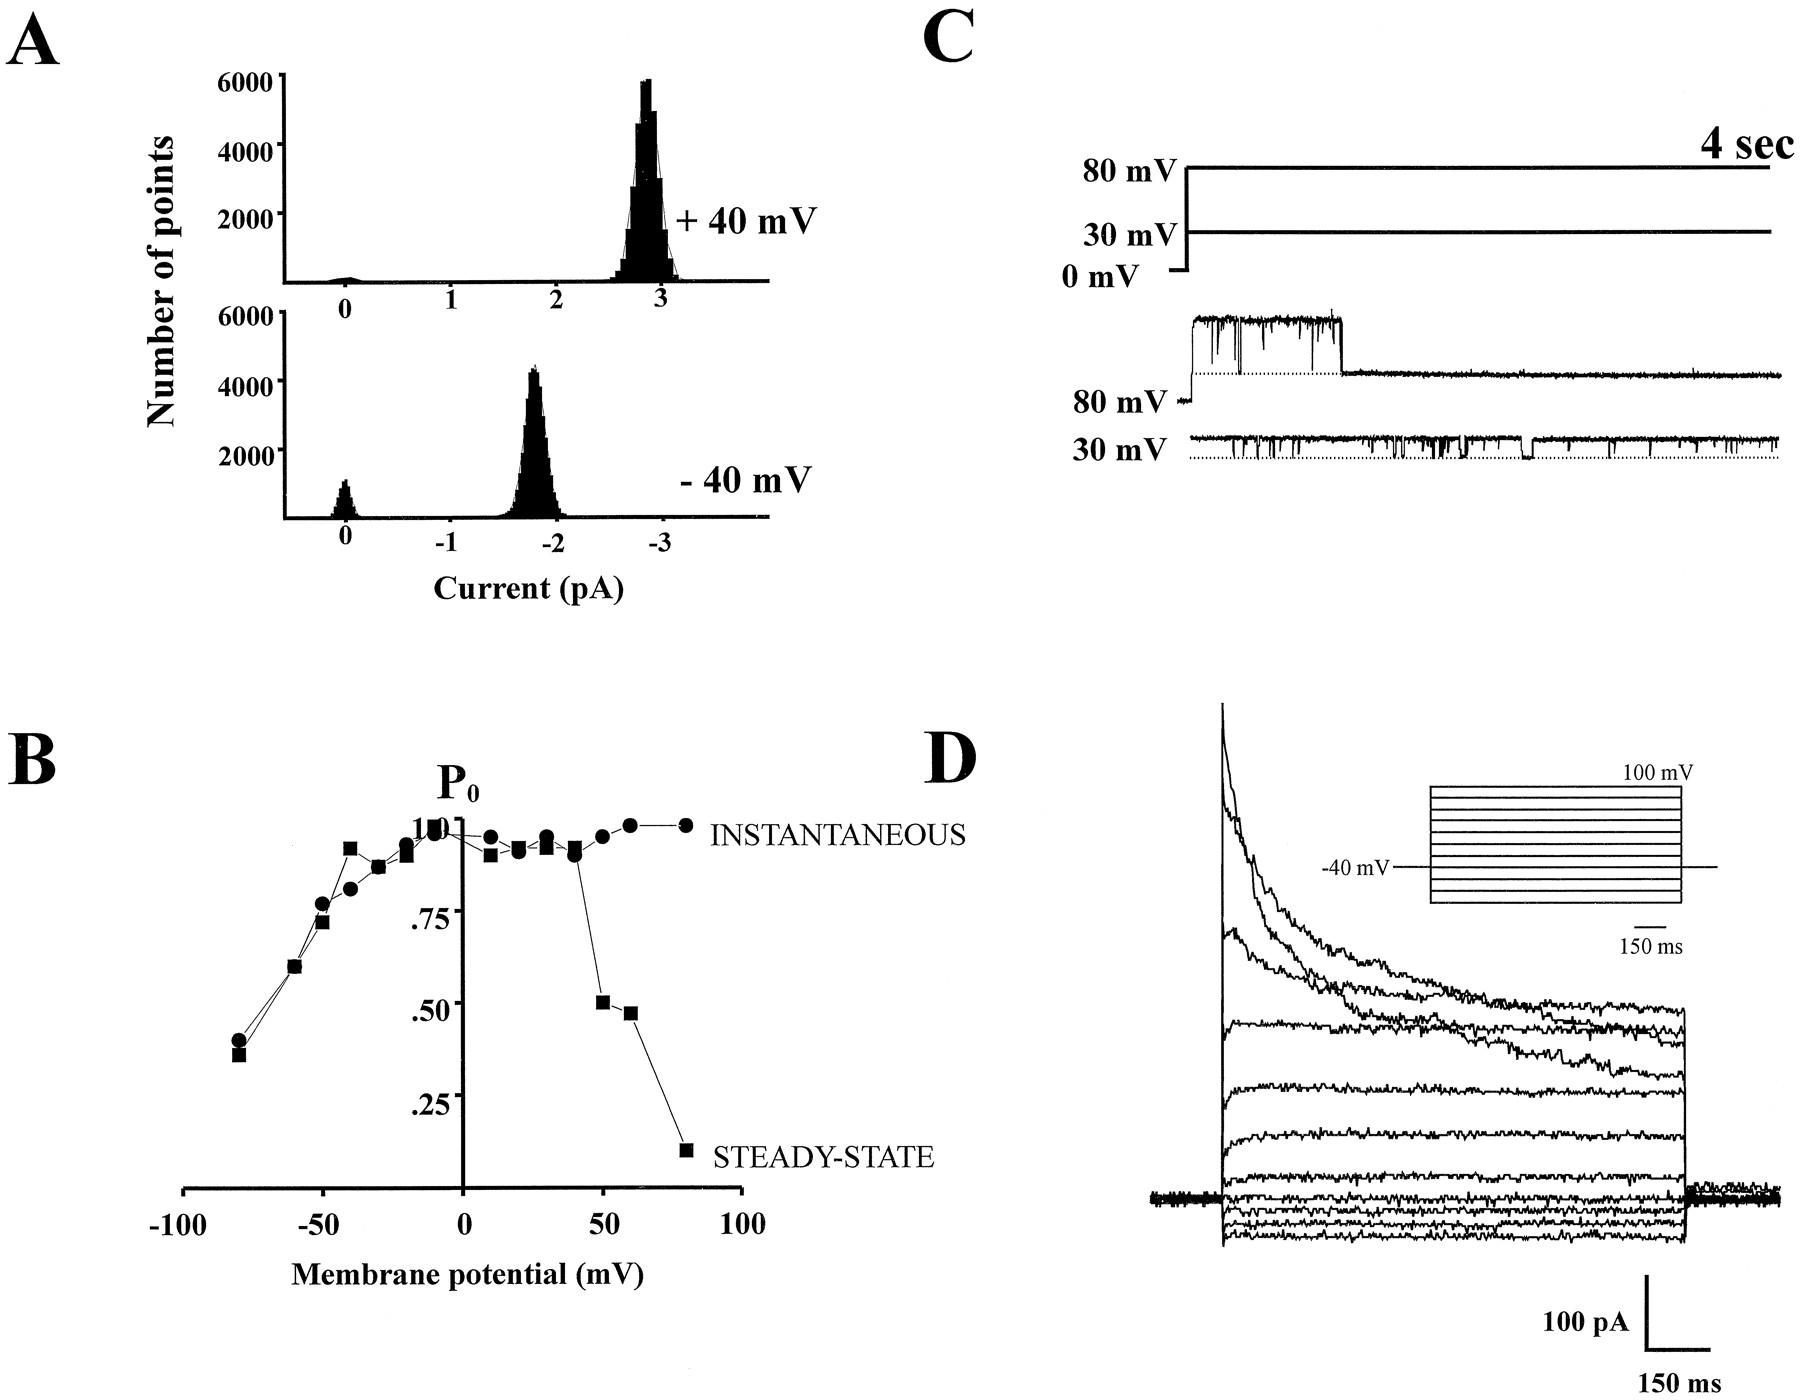
Depolarization-dependent inactivation of the ORCC.A, Amplitude histograms of current traces at −40 and 40 mV that were shown in Figure 1B. The histograms were fit with second-order gaussians. Mean current at 40 mV was 2.9 pA and at −40 mV was 1.75 pA, indicating a single conductance level of 72 and 44 pS at 40 and −40 mV, respectively. B, Depolarization-induced inactivation is shown in a graph ofPO versus membrane potential (mV) for the channel shown in Figure 1. PO within the first second (instantaneous PO) versus mV is shown by the filled circles. Steady-state availability is indicated by the filled squares.C, Current records taken from the channel in Figure 1show the channel first being stepped from 0 to 80 mV and then from 80 to 30 mV. The voltage protocol is shown above the current traces. At 80 mV (the top current trace), the channel at first has high open-state probability (PO) before inactivating <1 sec after the voltage step has been made. The channel thereafter remained inactivated for 30 sec (the remainder of the record is not displayed). Then the patch was stepped from 80 to 30 mV and the channel was reopened, maintaining a high PO.D, Whole-cell Cl− currents in astrocytes transformed in warm Ringer’s solution (Lascola and Kraig, 1996) into a stellate morphology also demonstrate voltage-dependent inactivation at positive potentials.
In most inside-out patches showing Cl− channel activity, only one channel was observed. Occasionally, inside-out patches possessed three or more ORCCs. Because of this and the observation that some channels apparently would enter long closed states of several tens of seconds to several minutes before reactivation, the actual number of channels per patch could not be determined unequivocally.
Under the conditions used in these experiments (i.e., Ca2+-free and K+-free solutions), excised inside-out patches from astrocytes demonstrated little channel activity other than the ORCC. On occasion, we observed a large conductance “maxi” anion channel previously described by several other investigators (Nowak et al., 1987; Sonnhof, 1987; Jalonen, 1993). This channel had a conductance with an order of magnitude larger than the ORCC and rapidly inactivated when the membrane potential was stepped more than ±20 mV away from 0 mV. Although this channel was readily distinguishable from the ORCC, membrane patches containing these channels were discarded.
Conductance and voltage-dependent inactivation
Figure 1A demonstrates 1-sec-long current traces of the ORCC at membrane potentials from 60 to −60 mV (in 20 mV increments). The channel from which these traces were obtained was activated after the patch potential was stepped to 60 mV for 45 sec. At this resolution it is evident that the channel spends most of its time in the open state and that there are both slow and fast closures that occur relatively infrequently. Current traces induced during voltage steps of opposite polarity are displayed alongside each other to emphasize the outward rectification of the channel. Even at ± 20 mV the larger conductance at the positive potential is readily discernible.
Figure 1B demonstrates two 10 sec traces at +40 and −40 mV from which the ±40 mV traces in Figure 1Awere taken. Visual inspection of these traces provides a first indication that the current through the ORCC is modulated by a gating process with complex kinetics. Openings occurred in bursts lasting from several tens of milliseconds to several seconds, and the bursts contained many short closures. Figure 1C is anI–V plot of the channel depicted in Figure 1, Aand B. The slope conductance at negative potentials between −60 and −80 mV was 36 pS in symmetrical 150 NaCl solutions and 75 pS at positive potentials between 60 and 80 mV.
Figure 2A shows representative amplitude histograms of channel activity during the 40 and −40 mV traces shown in Figure1B. The histograms were fit with second-order gaussians. Both plots demonstrate two clearly delineated peaks. The peak at 0 pA in each graph represents closed events, and the other peak represents open events. The current at 40 mV was 2.9 pA, and that at −40 mV was 1.75 pA, indicating conductance levels of 72 and 44 pS at 40 and −40 mV, respectively. Mean conductance in 26 patches at −40 mV was 45 ± 1.0 pS (range, 35–53 pS) and 64 ± 1.2 pS (range, 54–74 pS) at 40 mV in symmetrical 150 mm NaCl solutions, with 10 mm TES as a pH buffer.
The amplitude histograms in Figure 2A provide an indication of the relative PO of the channel at positive and negative potentials. At 40 mV, the channel spent most of its time in the open state, corresponding to aPO of 0.92 for a 30 sec recording at this potential. Mean PO for 26 patches at 40 mV was 0.81 ± 0.04 (range, 0.43–0.97). At −40 mV, a reducedPO of 0.75 was observed. The meanPO for 26 patches at −40 mV was 0.70 ± 0.04 (range, 0.25–0.91). The trend over the course of several recordings showed an increase in PO from negative to positive potentials.
At positive potentials, the reduction in PO is attributable in part to the presence of depolarization-dependent inactivation. Depolarization-dependent inactivation was observed in ∼20–30% of patches (Fig. 2C), greatly reducing open-state probability (PO) at high positive potentials. The range of percentages is approximate, because this inactivation process was highly variable both in the rate of inactivation and the voltage dependence of inactivation, and expression was also variable. If present in inside-out patches, depolarization-dependent inactivation typically was first evident at 60 mV. As patch potential was clamped to increasingly positive membrane potentials, inactivation became progressively faster. In Figure2C, current records are shown in which the patch potential is stepped first from 0 to 80 mV and then from 80 to 30 mV. At 80 mV (the top current trace), the channel first exhibited a high open-state probability before inactivating <1 sec after the voltage step was made. The channel thereafter remained inactivated as the patch potential was held at 80 mV. Then the patch was stepped down to 30 mV. At this potential the channel reopened, maintained a high open-state probability, and did not inactivate. Typically, ORCCs had only to be stepped back to membrane potentials just outside the range at which depolarization-dependent inactivation was observed (i.e., ≤60 mV) to remove inactivation.
An example of time-dependent and voltage-dependent inactivation in a whole-cell recording from a stellate astrocyte is demonstrated in Figure 2D. Depolarization-dependent inactivation in whole-cell recordings showed considerable variability and varied not only across cells but also within recordings (Lascola and Kraig, 1996), paralleling the considerable variability also observed in single Cl− channels from excised patches.
Cl− selectivity
Figure 3A represents an experiment in which an inside-out patch was exposed first to symmetrical 150 mm NaCl solutions, and then the bath solution was switched to one in which 100 mm NaCl was replaced iso-osmotically with sucrose. The reversal potential shift for three patches under these conditions was −20.1 ± 0.7 mV, showing a PNa/PCl of ∼0.14. The predicted shift for a perfectly Cl−selective conductance under these conditions is −28 mV.

Cl− selectivity of the ORCC.A, The selectivity of the ORCC was assessed by varying the internal concentration of Na and Cl ions. Initially, the patch was bathed in symmetrical 150 mm NaCl solutions. TheI–V relationship in these solutions reverses at 0 mV and is indicated by the filled circles. Then the bath was switched to one containing only 50 mm NaCl (unfilled circles) while the patch solution was held constant. The reversal potential for three patches that followed this solution change was −20 ± 0.7 mV (predicted NernstCl= −28 mV), suggesting aPNa/PCl of ∼0.14. B, I–V relationships demonstrating shifts in reversal potential after bath solution changes from 300 to 600 mm NaCl (unfilled circles) and from 300 to 150 mm NaCl (unfilled squares) while holding the pipette constant at 300 mm NaCl. The I–V relationship when 300 mm NaCl was present in both the bath and pipette is shown by the filled circles. When the bath was switched first to 600 mm NaCl, the zero current potential shifted to 11.2 ± 0.8 mV (n = 4; predicted NernstCl = 17 mV), indicating aPNa/PCl of 0.18. After the bath was switched to 150 NaCl, the mean reversal was −12.0 ± 0.6 mV (n = 4; predicted NernstCl = −17 mV), and thePNa/PClwas ∼0.2. C, Comparison of the I–Vrelationship in 150 mm NaCl solutions (filled circles) with one obtained in symmetrical 150 NMDG–Cl solutions (n = 12; unfilled circles). In the Na-free solutions, note the decrease in both inward and outward current amplitude, although the Cl− concentrations remain the same.
The finite cation permeability increased in solutions of increasing ionic strength. Figure 3B details the results of a representative experiment in which a patch was exposed first to symmetrical 300 mm NaCl solutions; then the bath was shifted sequentially to one with 150 NaCl and finally to one with 600 NaCl. The pipette solution was fixed at 300 NaCl. After the first solution change to 150 NaCl, the zero current potential shifted to −12.0 ± 0.6 mV (n = 4; predicted Nernst = −17 mV). After the second solution change, the zero current potential shifted to 11.2 ± 0.8 (n = 4; predicted Nernst = 17 mV). ThePNa/PCl from the first shift to 150 NaCl was 0.18; thePNa/PCl for the second shift was 0.22. Thus, the permeability of the astroglial outward rectifier to Na+ seemed to increase with progressively higher salt concentrations.
Both inward and outward currents (Cl− current from the pipette to the bath) were reduced when the concentration of NaCl in the bath was lower than that in the pipette, as illustrated in Figure3, A and B. Interestingly, reduction ininward current amplitude after an increase in bath NaCl with respect to pipette NaCl was not observed, as demonstrated in Figure 3. This paradoxical reduction in both inward and outward current in asymmetrical solutions has been reported in selectivity experiments for outwardly rectifying Cl− channels in epithelial cells (Halm et al., 1988; Tabcharani et al., 1989).
Channel inhibition by DIDS, ATP, and Zn2+
Figure 4 demonstrates block of the outward rectifier by three agents known to inhibit single-channel and whole-cell anion currents in other preparations, including morphology-dependent whole-cell Cl− currents (Lascola and Kraig, 1996). Figure 4A shows representative current traces from a patch in which two channels are active at 30 mV and only one is active at −30 mV. One minute after the application of 200 μm DIDS to the “intracellular” face of the patch, the current traces showed a rapid closure or flickering that was present at both positive and negative potentials. The flickering block persisted, after washout of submaximal inhibitory concentrations of DIDS, indicating the irreversibility of the block (n = 3). In Figure 4B, current traces are shown at 40 and −40 mV before and after the addition of 2 mm ATP to the bath. Submaximal inhibitory concentrations of ATP produced a flickering channel block similar to that observed with DIDS. ATP block was completely reversible after washout of the nucleotide (data not shown) (n = 3). Block with ATP from the intracellular face of the membrane suggests that intracellular levels of ATP could have a direct role in modulating Cl− permeability.

Block by DIDS, ATP, and Zn2+.A, Channel inhibition of 200 μm DIDS 1 min after application to the intracellular face of the patch (n = 3). DIDS produced a flickering block that was voltage-independent and irreversible. B, Channel inhibition by 2 mm ATP immediately after its addition to the intracellular/bath solution (n = 3). ATP produced an increase in open channel noise, especially at negative potentials. Some flicker block (rapid, complete closures) also was evident. Block was also voltage-independent but, in this case, completely reversible after washout of the nucleotide.C, The addition of 1 mmZn2+ completely abolished single-channel currents in <1 min (n = 3). This effect was reversible, but only after several minutes of washout. The C adjacent to the dotted line indicates the closed state of the channel.
Figure 4C shows channel inhibition by Zn2+. The addition of 1 mmZn2+ to the bath completely abolished the single-channel currents in <1 min (n = 3). This effect was reversible but only after several minutes of solution exchange.
Morphology-dependent expression
Inside-out patches from both polygonal and stellate astrocytes were examined for ORCC activity. Once activated, ORCCs from polygonal and stellate cells did not demonstrate any differences in outwardly rectifying voltage-dependent channel properties. Cells of each morphology, however, did exhibit statistically significant differences in Cl− channel expression. Figure5 illustrates the difference in expression of both spontaneously active and voltage-activated ORCCs in excised inside-out patches from polygonal and stellate astrocytes. Outwardly rectifying channels that were spontaneously active immediately after patch excision were compared with the expression of channels requiring voltage activation. Spontaneously active Cl− channels were observed in 5% of polygonal cells (n = 59), as compared with 19% of stellate cells (n = 32). This difference in expression may reflect either an increase in the activity of the physiological mechanism or mechanisms responsible for activating these channels in stellate cells or an increase in the number of channels per patch. A comparison of the percentage of expression of voltage-activated channels provides some insight into these possibilities. Although the voltage activation protocol was standardized for both morphological classes of cells (see above), channel expression was still significantly greater in stellate cells (81%), as compared with polygonal cells (58%). This suggests that the actual number of channels per excised patch membrane may be greater from stellate cells than from flat cells.
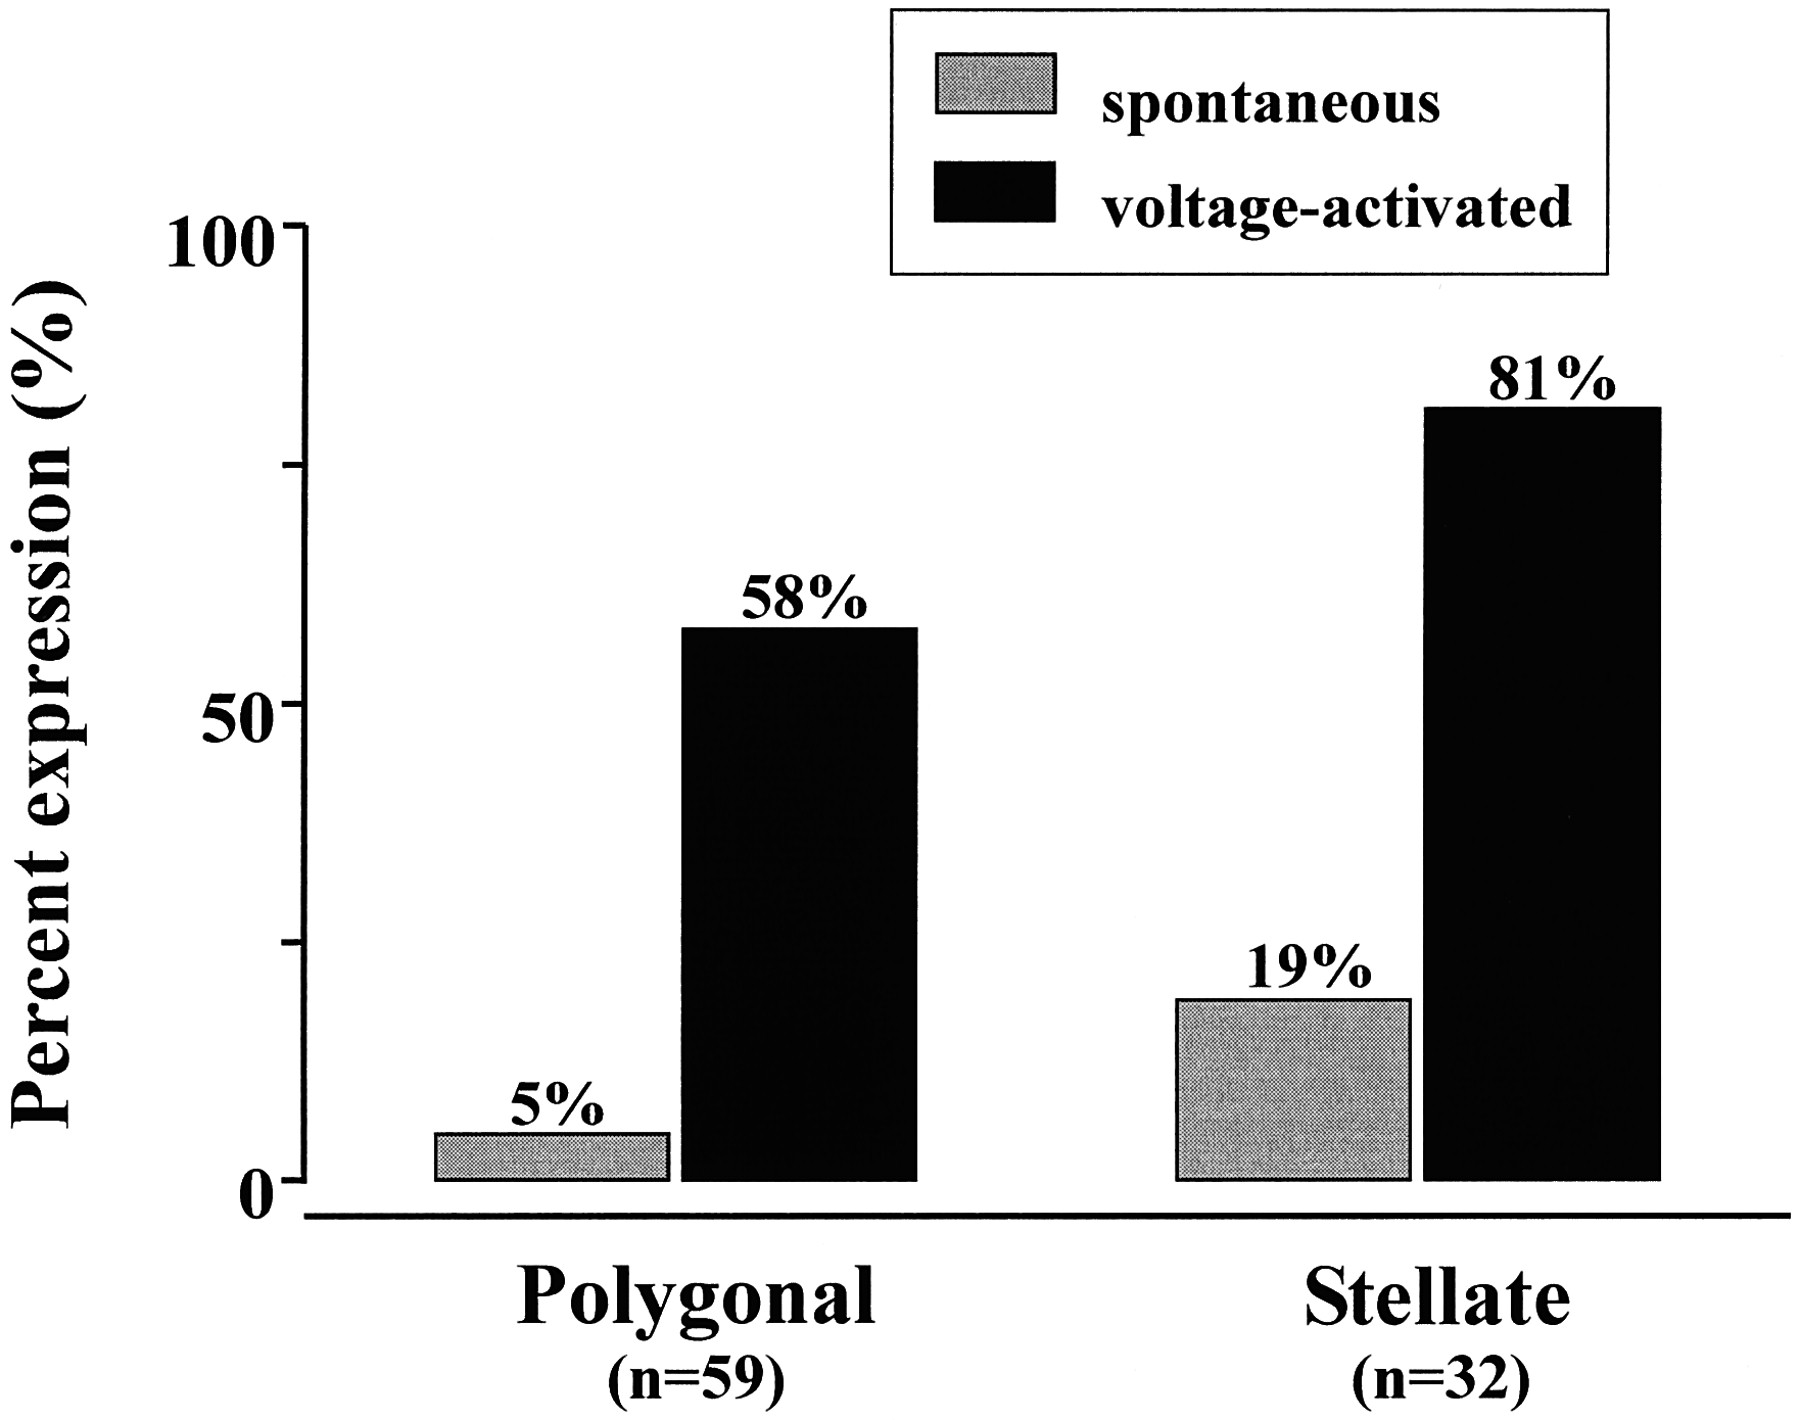
Morphology-dependent expression of the ORCC. Shown is the percentage of expression of both spontaneous and induced Cl channel activity in excised and cell-attached patches, which differed between polygonal cells and stellate cells. Percentages represent the cumulative proportion of patches expressing Cl channels. In excised inside-out recordings, spontaneously active channels were more than three times as likely to be observed in patches excised from stellate cells (19%) than from polygonal cells (5%) (n = 91). When a standardized voltage activation protocol was used, depolarization-induced Cl channel activity was also greater in patches from stellate cells (81%), as compared with polygonal cells (58%).
Spontaneous low-to-high PO transitions at negative potentials
After patch excision, spontaneous or depolarization-induced ORCCs usually exhibited stationary behavior. On occasion, however, ORCCs sometimes were observed at first to enter a state in whichPO was dramatically lower at negative potentials but only slightly reduced at positive potentials (Fig.6). The low POstate just after channel activation, seen especially at negative potentials, was observed in approximately one-third of inside-out patches and was highly variable both in PO and in duration. Sometimes, it was observed briefly at a single negative potential within the first few seconds of recording, before channel activity became relatively fixed at a higher PO. In other patches a state of low PO could be observed for several minutes at all negative potentials before the channel ultimately would undergo an apparently spontaneous transition to higher PO.

Spontaneous low-to-highPO transition at negative potentials. A lowPO state at negative potentials was observed transiently in approximately one-third of outward rectifiers in inside-out patches. A, The two current traces on theleft represent an ORCC at 40 and −40 mV within the first minute after channel activation (after a 30 sec, 60 mV voltage pulse). Channel PO at 40 mV was 0.82.PO at −40 mV, in contrast, was 0.14. At lowPO, channel openings at −40 occurred only in brief bursts, separated by long closures. Theright current traces represent the same channel at 40 and −40 mV 1 min later. PO at 40 mV was 0.87, which was only slightly higher than POat this potential 1 min earlier. PO at −40 mV, however, increased dramatically to 0.76. The long and short closures of the channel at −40 mV now more closely resembled those at 40 mV above. The C adjacent to the dotted line indicates the closed state of the channel.B, Representative amplitude histograms of theleft and right current traces at −40 mV shown in A. The small open peak (at 1.7 pA) in theleft histogram indicates a peak conductance of 44 pS. The right histogram demonstrates both the increase inPO at −40 mV and the increase in channel conductance after this transition in PO. Peak conductance was 51 pS. The black arrow pointing to the right current trace in A calls attention to the brief transition to the former peak conductance level seen 1 min earlier. This conductance sublevel is represented by the 44 pS peak in the right histogram.
We examined the open, closed, and burst time distributions of representative ORCCs undergoing such a spontaneous transition from low-to-high PO at negative potentials. This analysis showed that spontaneous changes from low-to-highPO (and experimental changes from high-to-lowPO shown later) arose from significant changes in the long groups of channel openings, closures, and burst distributions. The results from 26 spontaneousPO transitions (“control” patches) are summarized in Table 1. The experiments are described below.
Open-state probability (PO) and time constants from open time, closed time, and burst time distributions
Figure 6A shows current traces from a channel undergoing a spontaneous transition from low-to-highPO at negative potentials. Within the first minutes of recording after activation, there was an obvious difference in PO between the top left trace (40 mV) and the bottom left trace (−40 mV). In the top trace, channelPO was high (0.72). In the bottom trace, channelPO was much lower (0.14). Within the next minute of recording, however, the top right trace (40 mV) demonstrated approximately the same high PO (0.77) as before, but the bottom right current trace underwent a transition to higherPO (0.68).
In Figure 6B, representative amplitude histograms of current traces at −40 mV from Figure 6A are shown. The small peak for open events at 1.7 pA (44 pS) demonstrates the lowPO of the channel at −40 mV. The increase inPO at −40 mV 1 min later was accompanied by an increase in channel conductance (from 44 to 51 pS). The phenomenon of increased conductance with increased PO was observed in many, but not all, patches that exhibited this early transition from low-to-high PO. In addition, very brief transitions to lower conductances also were seen sometimes at positive potentials as well, although none was obvious in the recording of the channel that is shown here. These results suggested that the maximal conductance of the ORCC may be composed of subconductances representing either molecularly distinct conducting pores that function synchronously at high PO or a single conducting pore with sublevels states of conductance rarely evident at high PO.
Dwell time distributions
Visual inspection of channel activity in the right current traces of Figure 6A, as well as channel activity in the current traces presented earlier in Figure 1B, suggested the presence of multiple closed states (Colquhoun and Hawkes, 1981). In Figure 7A, the right histogram shows the distribution of closed intervals for the channel shown in Figure 6A at −40 mV after highPO is achieved. A second-order exponential fit of this histogram indicated the presence of (at least) two closed states. The two time constants for channel closed states, τS and τL (“S” for short; “L” for long) were 2.1 and 21 msec, respectively. For 26 patches, τS was 3.0 ± 0.4, and τLwas 21 ± 1.4. In the left histogram in Figure 7A, which demonstrates the closed time distributions of the lowPO state in the −40 mV current trace in Figure6A, τS was 2.5 msec, and τL was 85 msec, suggesting that the transition from low-to-high PO arises in part from a decrease in the time constant for long closures, whereas the time constant for short closures remains primarily unchanged.

Closed, open, and burst time distributions at low and high PO. A,Left and right histograms represent the distribution of closed events for the −40 mV traces of the channel displayed in Figure 6. Both histograms were fit with second-order exponentials. The two time constants displayed within the histograms represent the mean times of the group of short closures (τS) and long closures (τL). For 26 control patches, mean τS = 3.0 ± 0.4 msec and τL = 21 ± 1.4 msec. Thus, the spontaneous transition from low-to-high PO in theleft and right current traces inA involved primarily a change in the long group of channel closures. B, Left andright histograms graph the distribution of open events at −40 mV before and after the transition inPO. Second-order exponential fits suggested two channel open states. For control patches, τS = 3.6 ± 0.3 msec and τL = 75 ± 3.9 msec (n = 26). Thus, the low-to-high transition inPO arose principally from a change in the long open state. C, The left andright histograms represent the distribution of channel bursts at −40 mV for the transition between low and highPO. As with open and closed states, the burst distribution histograms could be fit accurately with a second-order exponential. The shorter group of bursts (τ1) and the longer group of bursts (τ2) were 121 ± 16 and 2777 ± 181 msec, respectively. Thus, the spontaneous transition from low-to-highPO appears to arise mainly from an increase in the longer group of bursts, although an increase in the short burst lengths also was evident.
The open time distributions of the channel are demonstrated analogously in Figure 7B for the channel transitions from low-to-highPO at −40 mV shown in Figure 6. For the channel at low PO, the short and long time constants, τS and τL, from a second-order exponential fit in the left histogram are 3.9 and 9.2 msec, respectively. The right histogram represents open time distribution and a second-order exponential fit after the channel has reached high PO. Now τS is 4.2 msec, and τL is 90 msec. For 26 patches at −40 mV, τS is 3.6 ± 0.3 and τL is 75 ± 3.9. Thus, the increase in PO for the representative channel in Figure 6 appears to arise from an increase in the time constant for long openings as well as a decrease in the time constant for long closures. The time constant for short openings remains primarily unchanged.
The short closed states also appeared to group channel openings into bursts of activity. Figure 7C shows burst duration histograms for the ORCC (from Fig. 6) as it underwent the transition from low-to-high PO. Second-order exponential fits indicated that burst durations could be described by two time constants, τ1 and τ2, analogous to the short and long time constants for closed and open states. At lowPO, τ1 was 38 msec, and τ2 was 254 msec for the channel in Figure 6. After 1 min, at high PO, τ1 was 71 msec and τ2 was 2341 msec. For 26 patches showing highPO activity, τ1 and τ2 were 121 ± 16 and 2777 ± 181 msec, respectively, suggesting that the largest increase with the transition to high PO was in the longer burst length.
Phalloidin and gelsolin modulate POand conductance
Phalloidin is a bicyclic heptapeptide “phallotoxin” derived from poisonous mushrooms (Wieland and Faulstich, 1978) that binds actin polymers much more tightly than actin monomers; it also shifts the equilibrium between actin filaments and monomers toward filaments, lowering the critical concentration for polymerization by 10- to 30-fold (Cooper et al., 1987). Stabilization of actin filaments arises by reducing the subunit dissociation rate constants to near zero at both ends of actin polymers (Pollard et al., 1990).
When excised inside-out patches were pulled in the presence of 10 μm phalloidin, the first obvious change was the preservation of low PO at negative membrane potentials. Figure 8Aillustrates activity from an ORCC activated in the presence of phalloidin after the patch was stepped to 90 mV for 5 sec. At −40 mV the mean PO was 0.70 ± 0.04 (n = 26) for channels in control solutions and 0.13 ± 0.03 (n = 11) in the presence of 5 μm phalloidin, representing a statistically significant difference (p < 0.001). At 40 mV, however, the mean PO was 0.81 ± 0.04 (n= 11) for control patches and 0.72 ± 0.04 (n = 11) in the presence of 5 μm phalloidin, representing a statistically insignificant difference (p = 0.09).

Phalloidin and gelsolin modulatePO and conductance. A, Current traces from a patch excised in the presence of 5 μm phalloidin. In 11 patches exposed to phalloidin, channels at negative potentials remained fixed at lowPO. B, A black line is drawn from a short burst of channel openings to a current trace that expands the short burst both in amplitude and time. The top dotted line (labeled C) represents the closed state of the channel. The next three dotted lines from top to bottomrepresent three different channel subconductance levels. The current trace on the right represents the same channel at −40 mV after the application (1 U/ml) of the actin-severing protein gelsolin. Note the marked increase in channelPO. The peak amplitude of the current trace on the right is indicated by the bottom dotted line. This line also is reproduced as the lowest dotted line in the left current trace before gelsolin addition. C, Amplitude histograms plot the change in conductance for the channel in the presence of phalloidin and after the subsequent addition of gelsolin. Note the clear delineation of three conductance levels (9, 24, and 35 pS) in the lefthistogram. Peak conductance in the presence of phalloidin was 35 pS. The right histogram shows the change in conductance after the addition of gelsolin. Peak conductance increased to 44 pS with increasing PO, and conductance sublevels were no longer evident.
Table 1 compares mean channel open, closed, and burst times for the ORCCs at −40 mV in the presence and absence of phalloidin. The increase in long closed times (from 21 ± 1.4 to 97 ± 6.3 msec; p ≪ 0.001), the decrease in long open times (from 75 ± 3.9 to 11 ± 1.1 msec; p ≪ 0.001), and the decrease in long burst lengths (from 2777 ± 181 to 278 ± 39 msec; p ≪ 0.001) all contribute to the dramatic decrease in PO at −40 mV in the presence of phalloidin. Note that the time constants for the short open and closed states and short burst lengths for phalloidin-treated patches were not significantly different from those in control solutions.
Preservation of the patch cytoskeleton with phalloidin not only loweredPO but also allowed for the observation of additional conductance sublevels otherwise not observed at highPO. Figure 8B demonstrates subconductance levels in the presence of phalloidin. The left histogram in Figure 8C demonstrates the conductance sublevels as individual peaks of current amplitude. Individual conductance sublevels were observed in 11 patches excised in phalloidin, although the lowest sublevel (9 pS) was difficult to resolve in seven of those patches. Mean conductances for each sublevel were 8.8 ± 0.2, 25 ± 0.3, 35 ± 0.7, and 44 ± 0.6 pS (n = 11) in patches treated with phalloidin.
Gelsolin is a Ca2+-dependent F-actin capping and severing protein observed ubiquitously in all cells (Vandekerckhove, 1990). In brain, it may be concentrated preferentially in glial cells (Tanaka and Sobue, 1994). Gelsolin not only severs actin filaments but also appears both to sever actin filaments in the presence of phalloidin and possibly to displace phalloidin from actin filaments. We examined the effects of 1 U/ml gelsolin applied to five patches excised in the presence of phalloidin. As shown in the right current trace in Figure 8B, application of gelsolin resulted in a marked increase in channel PO and in peak conductance level. Moreover, sublevels of conductance no longer were observed.
A summary of the effects of phalloidin and phalloidin plus gelsolin on channel conductance and gating is given in Figure9. Cumulative data from 15 control, 7 phalloidin, and 5 phalloidin plus gelsolin experiments from which complete I–V plots were obtained are illustrated in Figure9. Note the dramatic decrease in PO at all negative potentials for the phalloidin, as compared with the control patches (membrane potentials >40 mV were excluded to avoid the confounding influence of depolarization-dependent inactivation onPO; see Fig. 2). ChannelPO after gelsolin treatment was not significantly different from that under control conditions (p = 0.86).

PO and conductance levels in the presence of phalloidin and phalloidin plus gelsolin. These two graphs show the cumulative data from 15 control, 7 phalloidin, and 5 phalloidin plus gelsolin experiments from which complete I–V plots were obtained. Membrane potentials >40 mV were excluded to avoid the confounding influence of depolarization-dependent inactivation on PO.A, Plot of PO versus membrane potential (mV) showing the decrease in PO at negative potentials and the statistically insignificant decrease inPO at positive potentials in the presence of phalloidin (filled squares), as compared with control patches (filled circles). The actin-severing protein gelsolin (unfilled squares) reverses the effects of phalloidin at negative potentials.B, I–V plot reconstructed from the single-channel data shown in Figure 8. In the presence of phalloidin, mean conductance levels for all patches were 8.8 ± 0.2 (n = 4), 25.0 ± 0.3 (n = 9), 35 ± 0.7 (n = 8), and 44 ± 0.6 (n = 11). In this particular cell the peak level of conductance at −40 mV was 35 pS (filled circles). After the addition of gelsolin, peak conductance increased to 44 pS (unfilled circles). Each conductance level within the negative voltage range was well fit by linear regression via the expected reversal of the Cl−channel in symmetrical solutions. Dotted lines from the regressions are extended into the positive voltage range to illustrate the different degrees of I–V rectification at the level of the single channel as it transitions between different conductance sublevels at negative potentials.
Figure 9B depicts current levels in the presence of phalloidin and phalloidin plus gelsolin for the channel illustrated in Figure 8. Note that the I–V relationship for the sublevels at negative conductances is well fit by linear regressions via the expected reversal of 0 mV. The significance of these regression fits was extremely high: p < 0.005 for the 9 pS level,p < 0.0001 for 24 pS level, and p < 0.005 for the 35 pS level. The fits were extended into the positive voltage range to help in visualizing channel rectification with respect to subconductance level. At negative potentials the conductance level represented by the unfilled circles is well fit by linear regression (p < 0.005).
Actin and cytochalasin D modulate PO at negative potentials
The foregoing phalloidin–gelsolin experiments do not demonstrate whether actin directly interacts with channels to changePO and conductance or whether actin works in conjunction with other soluble modulators distinct from channel proteins to affect channel function. We explored this issue by applying actin directly to inside-out patches containing activated ORCCs. As shown below, the addition of actin reduced POthroughout the negative voltage range. This reduction was associated with changes in the long open, closed, and burst time distributions.
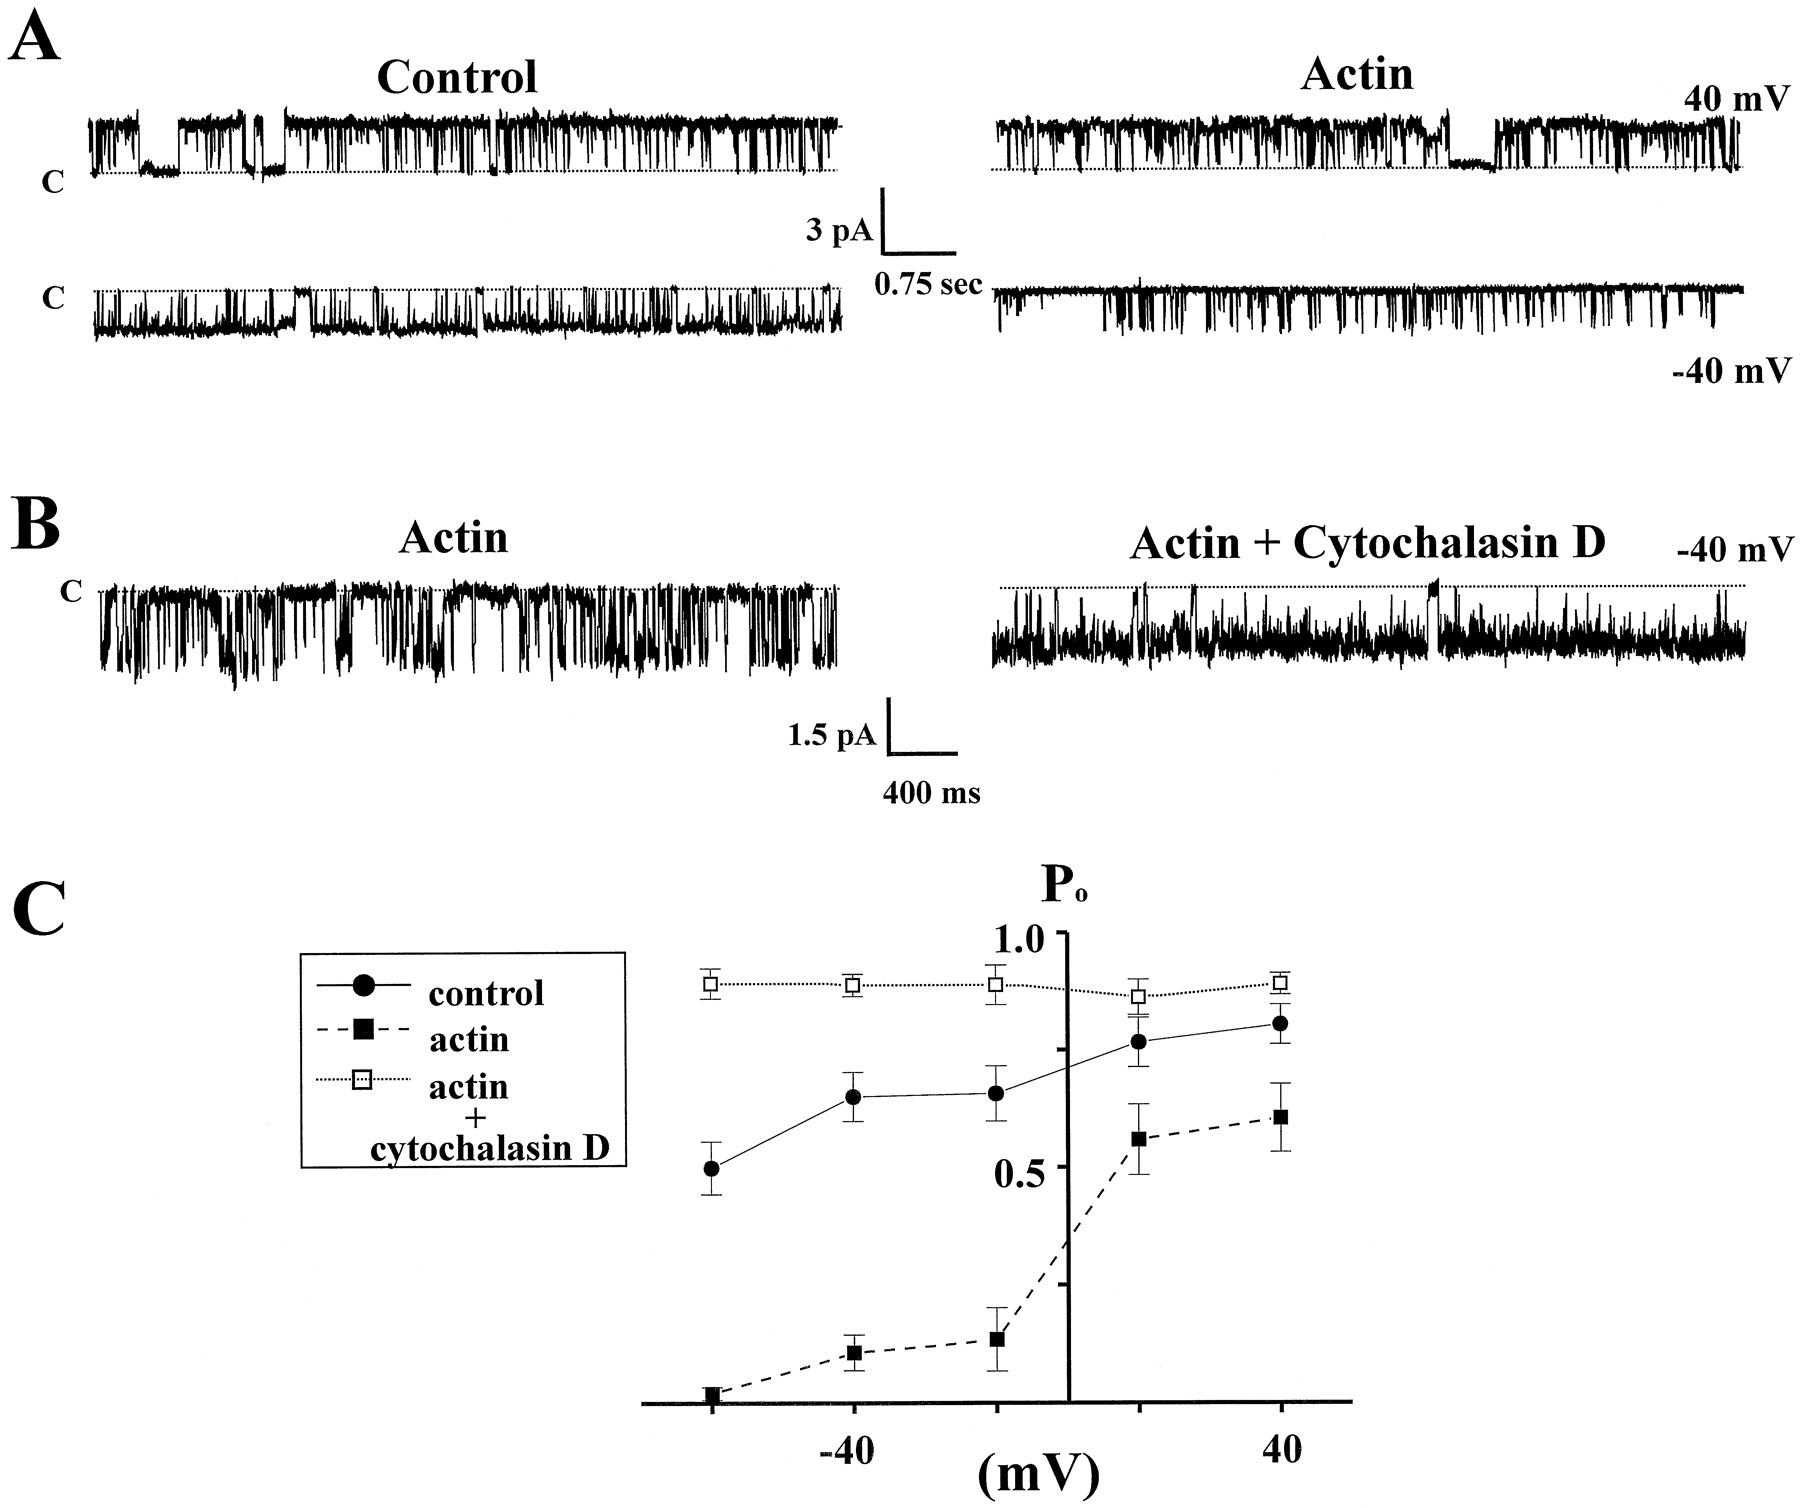
In Figure 10A, the left current traces represent an outward rectifier after activation by a 90 sec, 60 mV voltage pulse. At 40 mV (the top trace), channel PO was 0.74; at −40 mV, channelPO was 0.71. These values representPO over 30 sec of recordings at each potential. The right current traces demonstrate records of the same channel ∼5 min after the addition of a mixed actin solution of polymers, short filaments, and monomers (final concentration, 1 mg/ml). Actin caused a profound decrease in PO at negative potentials, leaving PO at positive potentials unchanged. For the channels in Figure 10, PO at −40 mV was 0.05 over 30 sec, whereas at 40 mV PO was 0.69 after the addition of actin. For seven patches exposed to actin solutions, PO at −40 mV was 0.11 ± 0.04. This compares with the control PO of 0.70 ± 0.04 (n = 26). The changes inPO for actin and control solutions are summarized in Table 1. As with phalloidin, the changes inPO appear to be the cumulative result of an increase in the long closed state, a decrease in the long open state, and a decrease in longer burst lengths.

Actin and cytochalasin D modulatePO at negative potentials. A, The left current traces are taken from a patch initially in control solutions. PO at 40 mV was 0.74;PO at −40 mV was 0.71. Theright current traces demonstrate records of the same channel ∼5 min after the addition of a mixed solution of actin polymers, short filaments, and monomers (final concentration, 1 mg/ml). Actin caused a dramatic decrease in PO at negative potentials. PO at −40 mV was 0.05 over 30 sec, whereas at 40 mV PO was 0.69 after the addition of actin. B, The current trace on theleft represents an outwardly rectifying channel at −40 mV after it had been exposed to 1 mg/ml actin.PO at −40 mV was 0.23. The current trace on the right shows the same channel 17 min after the addition of 10 mm cytochalasin D while the amount of actin in the bath remained unchanged. Channel POincreased to 0.95. Note also the marked increase in open channel noise accompanying the increase in PO. TheC adjacent to the dotted line indicates the closed state of the channel. C,PO is plotted versus membrane potential (mV). Note that the increase in PO after the addition of cytochalasin D (unfilled squares) surpasses the PO of control patches. MeanPO at −40 mV after the addition of cytochalasin D was 0.89 ± 0.02 (n = 5), significantly higher (p < 0.05) than thePO (0.70 ± 0.04) in control cells.
In the presence of actin, application of cytochalasin D (Cyt D) to excised patches caused a dramatic increase in POat all potentials (Fig. 10B). Excised patches, however, required at least a 10–15 min incubation period before the increase in PO was observed. Patches were remarkably stable for prolonged periods after the addition of actin to the recording bath. An example of an actin/Cyt D experiment is shown in Figure 10B. The current trace at the left represents an ORCC at −40 mV after it had been exposed to 1 mg/ml actin. ThePO of this channel at −40 mV in the presence of actin is 0.23. The current trace on the right in Figure10B shows the same channel 17 min after the addition of 10 μm Cyt D while the amount of actin remains unchanged. Channel PO in this case increased to 0.95 at −40 mV. Note also the marked increase in open channel noise accompanying the increase in PO. Although this noise potentially could arise from actin and/or cytochalasin directly interacting with the channel pore, another explanation is that the open channel noise is caused by ATP in the bath. ATP was always present as a component of the actin solution. We previously observed a similar increase in open channel noise by directly adding ATP to activated channels (see Fig. 4B). Moreover, voltage-activated channels in control experiments did not demonstrate any flickering or open channel noise with Cyt D in the bath. The meanPO at −40 mV after the addition of Cyt D was 0.89 ± 0.02 (n = 5), which was significantly higher (p < 0.05) thanPO (0.70 ± 0.04) in control patches at this potential. Control PO (0.81 ± 0.04) and Cyt D PO (0.89 ± 0.02) at 40 mV were not significantly different (p = 0.26).
A plot of PO versus membrane potential (mV) for control, actin, and actin/Cyt D patches is shown in Figure10C. Note the small but statistically significant (p < 0.05) reduction inPO observed at positive potentials. MeanPO at 40 mV for control patches was 0.81 ± 0.02 (n = 26) whereas, for patches exposed to actin,PO was 0.60 ± 0.03 (n = 7). Although actin may lower PO at positive potentials, the flickering block of ATP (see Fig. 4) also may explain this reduction in PO, because ATP is a component of the actin solutions. In Figure 10C, also note the increase in PO at all negative potentials after exposure to Cyt D. PO at all potentials in the presence of cytochalasin exceeded even that measured in control patches.
DISCUSSION
These results provide the first report of an ORCC in neocortical astrocytes. Single-channel activation and kinetics suggest that this Cl− channel may contribute to morphology-dependent and actin-dependent changes in astroglial whole-cell Cl− conductance (Lascola and Kraig, 1996). Paralleling whole-cell currents, channel activation increased with changes in cell morphology. In addition, single ORCCs were blocked incompletely but irreversibly by DIDS, mimicking the DIDS inhibition of whole-cell currents. Finally, depolarization-dependent inactivation was observed in ORCCs, a kinetic feature of morphology-dependent whole-cell Cl− conductances. Voltage-dependent inactivation was observed in single channels at a frequency (20–30%) close to that observed in shape-dependent whole-cell currents (10–20%).
Results in this study also show that ORCCs can undergo marked changes in PO and conductance spontaneously and that these changes occur predominantly at membrane potentials negative to 0 mV. An analysis of open, closed, and burst time distributions between low and high PO states indicates that spontaneous PO transitions arise from significant changes in the longer groups of channel openings, closures, and bursts. In the presence phalloidin, an agent that stabilizes cytoskeletal actin, low PO states at negative potentials are preserved throughout the length of patch recordings. In addition, channel conductance may be reduced with phalloidin, indicating that the outward rectifier has a greater tendency toward conductance sublevels at low PO. When phalloidin patches were exposed further to the actin-severing protein gelsolin, however, channel PO and conductance increased. These results suggest strongly that spontaneous transitions in excised patches from low-to-high PO and from lower to higher conductance may arise from the gradual disassembly of filamentous actin from the patch into the recording bath. Filamentous actin appears to have a “restraining” or inhibiting effect on astroglial ORCC activity, particularly within a range of negative membrane potentials.
To support this hypothesis further, we found that the addition of actin solutions to control patches lowered PO at negative potentials. Again, changes in long openings, long closures, and long bursts seem to account for the high-to-low transition inPO. These results provide strong evidence that actin itself is required for the ORCC kinetic transitions and that normally an intact cytoskeleton is not simply holding some soluble inhibitor (e.g., a phosphatase) in place. Further evidence that actin polymers, and not monomers, are responsible for the reduction inPO follows from the subsequent application of cytochalasin D to patches in the presence of actin. Cytochalasin D, which shifts the equilibrium between actin polymers and monomers toward monomers, leads to a dramatic reversal of the effects of actin. The increase in PO at negative potentials actually exceeds the PO of control cells. If actin monomers in solution led to the initial decrease inPO, cytochalasin D would not be expected to influence channel PO.
Together, these results indicate that cytoskeletal actin can influence the degree of rectification of whole-cell Cl−currents profoundly because of ORCC activation. Preservation of actin, or the addition of actin to inside-out patches, leads to a 70–80% decrease in channel PO at negative potentials, whereas at positive potentials PO is reduced only slightly, if at all. Moreover, at lowPO, the channel exhibits a tendency to dwell at lower conductance sublevels. Combined, these phenomenon would lead to macroscopic currents with a much lower amplitude at negative potentials as compared with positive potentials (i.e., rectification would be greatly enhanced). Because astrocytes function only at negative membrane potentials in brain, cytoskeletal actin therefore would gate most of the physiological and pathological whole-cell Cl− conductance arising from ORCC activation in these cells.
Actin and Cl− channels in other cells
Several reports now exist from other cell preparations that examine the interaction of single Cl− channels with actin and drugs that modulate actin. Two reports, one in muscle (Haussler et al., 1994) and one in proximal tubule epithelia (Suzuki et al., 1993), have investigated the interaction of actin with Cl− channels that resemble the astroglial ORCC. The report in muscle cells is consistent with our observations, whereas the study in proximal tubule cells provides contrary results. In the latter case, differences in experimental methods may explain the disparity of their results with those in the muscle study and ours.
In the experiments performed in proximal tubule cells, Suzuki et al. (1993) found that the application of cytochalasin D significantlydecreased the mean open-state probability as well as the number of active Cl− channels in excised patches from proximal tubule cells. If they added “long actin filaments” back to patches after exposure to cytochalasin D, Cl− channel PO was restored and the number of active channels increased. Cytochalasin D also reduced whole-cell Cl− currents in their preparation. This result was in conflict with previous studies that have shown that F-actin stabilization prevents Cl−secretion in epithelial cells (see Shapiro et al., 1991). Perhaps the important difference between these studies and those of others as well as ours is that Suzuki et al. (1993) examined POchanges only within the first 6 sec after cytochalasin application. In both the muscle study and in our experiments, several minutes of incubation with cytochalasins often were required before large changes in PO were observed.
Haussler and colleagues (1994), in a study of the interaction between actin and the muscle Cl− channel, obtained results more consistent with ours. Their principal observation was that cytochalasin D activated whole-cell Cl− currents and increased the PO of previously activated single Cl− channels. An important similarity between their work and ours is that PO for their channel demonstrated a clear tendency to increase as membrane potentials shifted positive. However, an important difference between the two studies was that PO for their channel appeared to remain fixed at nearly zero within the range of negative voltages. In cell-free patches from astrocytes in our studies,PO at negative potentials inevitably progressed to values >0.50. Therefore, results of experiments in which cytochalasins are applied directly to astroglial inside-out patches are difficult to interpret, in that astroglial channel activity spontaneously progressed to high PO without the drug.
Perhaps astrocytes undergo a spontaneous transition to highPO in control conditions, and muscle cells remain fixed at a low PO because the cortical actin cytoskeleton in these cells is markedly different. Muscle cytoskeleton is extremely rigid. Filamentous actin in muscle has been shown to be relatively resistant to depolymerization (Pollard et al., 1990). This rigidity may arise in part because of the high concentrations of actin-capping proteins in muscle (Vandekerckhove, 1990). Indeed, muscle myosin itself binds actin and adds stability to actin polymers. Astrocytes, on the other hand, may have a more dynamic cortical cytoskeleton. In fact, this would be consistent with the observation that astrocytes possess a high capacity to undergo dramatic morphological changes. Greater cytoskeletal flexibility would facilitate this unusual capacity for morphological transformation. Thus, the ease with which the astroglial cytoskeleton is poised to undergo dynamic changes could manifest itself when membrane patches are excised. With patch excision, actin may depolymerize spontaneously and diffuse into the recording bath. Spontaneous depolymerization of actin would explain spontaneous low-to-high transitions inPO of the astroglial ORCC.
The actin cytoskeleton as a signal transducer in astrocytes
The results presented in this study suggest that cytoskeletal actin may be part of a novel signaling mechanism in astrocytes that regulates the activity of Cl− channels. The experiments in which actin was added directly to excised patches provided compelling evidence that actin itself is interacting with Cl− channels or closely associated channel proteins to modulate channel function. However, these experiments were not intended to prove that only actin, and not other messenger systems, could activate and modulate astroglial Cl−conductances. Instead, it is likely that actin is part of complex regulatory system in astrocytes and perhaps other cells that interacts with second messenger systems and target proteins to elicit changes in membrane-based functions.
The functions of the almost 70 actin-binding proteins described to date are regulated by second messengers, kinases, bioactive lipids, and phospholipids (Stossel, 1989; Cooper, 1991; Matsudaira, 1991). Ca2+, for example, regulates the cross-linking of actin filaments by nonmuscle α-actinins and activates the nucleating, severing, and filament-capping activities of gelsolin, villin, and severin. Analogously, phosphorylation by cAMP-dependent protein kinase A reversibly inhibits the bundling of actin filaments by synapsin I and by erythrocyte band 4.9 (Stossel, 1989). Thus, changes in the physical state of actin in astrocytes and other cells may arise from the complex interplay of several messenger systems that act on the actin cytoskeleton. If this is true, then cytoskeletal actin could be considered a cellular “integrator.” In astrocytes, actin appears to integrate changes in cell form with changes in Cl−channel function.
Footnotes
R.P.K. was supported by a Grant from the National Institute of Neurological Disorders and Stroke (NS-19108), a Zenith Award from the Alzheimer’s Association (ZEN-96-031), and the Brain Research Foundation of The University of Chicago. D.J.N. was supported by ROI GM36823 and ROI GM54266 and a grant from the Cystic Fibrosis Foundation. C.D.L. was supported by an MD/PhD Training Grant in Growth and Development (HD-07009) from the National Institute of Child Health and Human Development and a National Research Service Award (F31-MH11126) from the National Institute of Mental Health.
Correspondence should be addressed to Dr. Richard P. Kraig, Department of Neurology, MC 2030, University of Chicago, 5841 South Maryland Avenue, Chicago, IL 60637.


