

Article Figures & Data
Figures
- Fig. 1.
Nerve cuff electrode design and comparison of sensory responses in VPM and SI resulting from nerve cuff stimulation and manual whisker deflection. a, Schematic diagram of nerve cuff electrode and microwire placement. b, c, Peristimulus time histograms of responses to nerve cuff stimulation and manual whisker deflection from the same recording session in anesthetized rats. Examples of a single-unit and a multiunit recording are shown for VPM (c) and SI (b). Note that b andc were collected from two separate animals.Vertical dashed lines indicate the time of stimulus presentation (0 msec).
- Fig. 2.
Single-unit and multiunit responses to individually presented tactile stimuli during different behavioral states. Peristimulus time histograms (bottom) and the accompanying raster plots (top) were each compiled from 200 stimulus presentations. Vertical dashed lines in the histograms and vertical solid lines in the raster plots represent the time of stimulus presentation (0 msec). a,Responses of a single unit in VPM and a single unit in SI during four behavioral states. b, Responses from a multiunit recording in VPM and one in SI during four behavioral states.
- Fig. 3.
Average responses to single stimuli during different behavioral states. In each graph, responses were normalized to responses during the quiet state. a, Average responses of single units. b, Average responses of single-unit and multiunit recordings combined. Topgraphs in a and b represent the maximum magnitude (max mag) of the responses. Bottom graphs ina and b represent the integrated response (intg) values (see Materials and Methods for a description of these measures). Asterisks indicate values significantly different from the quiet state in each graph. Error bars represent ± SEM. ANOVA results: a, VPM max mag,F = 1.99, p = 0.187; VPM intg,F = 8.77, p = 0.0012; SI max mag, F = 5.74, p = 0.0022; SI intg, F = 10.99, p = 0.000023.b, VPM max mag, F = 9.82,p = 0.0099; VPM intg, F = 10.22, p = 0.0090; SI max mag,F = 9.82, p = 0.0099; SI intg,F = 23.94, p = 0.00097. Please see text for p values from post hoc tests (Tukey’s HSD). A, Active;Q, quiet; W, whisking; WT,whisker twitching.
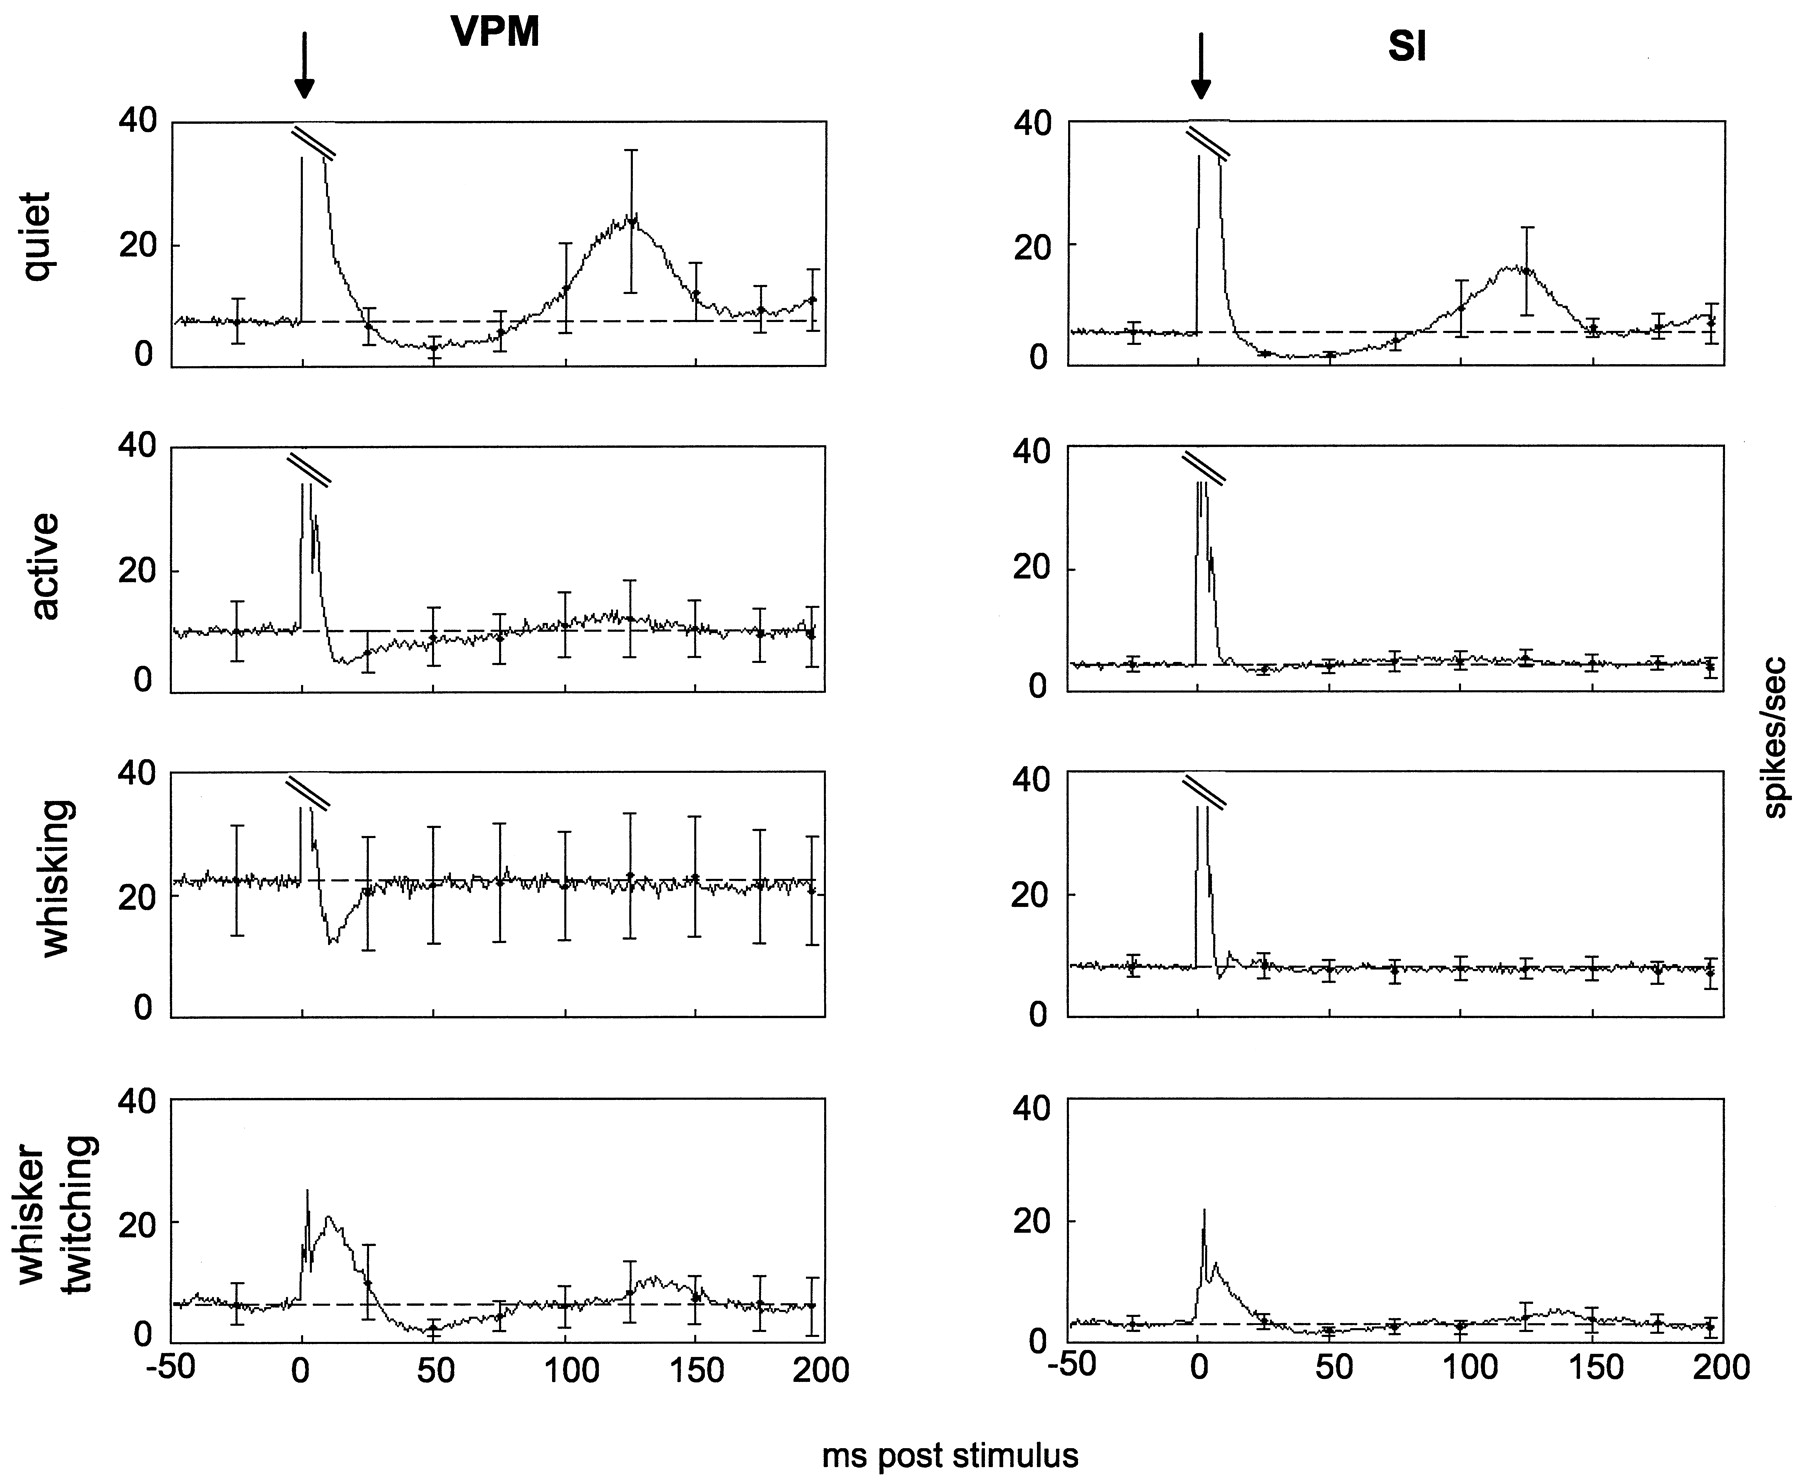
- Fig. 4.
Average levels of neural activity before and after presentation of single stimuli across four behavioral states.Traces are averages of 200 trials from each of five rats (quiet, active, and whisking) and three rats (whisker twitching) and include single-unit and multiunit data combined. Arrows above each column represent stimulus onset (0 msec). The y-axes are the same across all four behavioral conditions, necessitating truncation of the response magnitudes (parallel diagonal lines) in quiet, active, and whisking.Horizontal dashed lines in each graph show the average baseline level, calculated as the average activity level in the 100 msec preceding stimulus onset. Error bars represent ± SEM of points 25 msec before and 25, 50, 75, 100, 125, 150, 175, and 200 msec after the stimulus. Left, Responses in VPM. Right, Responses in SI. Note that the truncated peaks in this figure only include neural responses to the stimulation and do not include electrical artifact resulting from cuff stimulation. Stimulation artifact occurred in the 0 msec time bin and was removed when plotting these figures by excluding that bin.
- Fig. 5.
Responses in VPM to pairs of stimuli with varying interstimulus intervals during different behavioral states. In each graph, average responses are shown to the first stimulus in a pair (left-hand bar on each graph labeled “1st stimulus”) and to the second stimulus in the pairs with varying interstimulus intervals (interstimulus interval shown below bar). All responses were normalized to responses to the first stimulus in the pairs during the quiet state. These data represent single-unit and multiunit data combined. Error bars represent ± SEM, and asterisks represent values that are significantly different from the responses to the first stimulus in the pairs within each behavioral state. a, The maximum magnitude of the responses. b, The integrated response values. ANOVA results: a, quiet,F = 10.42, p = 0.000004; active, F = 2.49, p = 0.04 (no differences found between the first stimulus and any other values); whisking, F = 1.20, p = 0.34.b, quiet, F = 9.90,p = 0.000006; active, F = 2.71,p = 0.03; whisking, F = 0.3,p = 0.96. Please see text for pvalues from post hoc tests (Tukey’s HSD).
- Fig. 6.
Responses in SI to pairs of stimuli with varying interstimulus intervals during different behavioral states. Labeling conventions are described in Figure 5. ANOVA results: a,quiet, F = 18.9, p < 0.000001; active, F = 1.86, p = 0.11; whisking, F = 0.73, p = 0.66.b, quiet, F = 11.95,p = 0.000001; active, F = 3.70,p = 0.006; whisking, F = 1.17,p = 0.39. Please see text for pvalues from post hoc tests (Tukey’s HSD).
- Fig. 7.
Sensory responses during pentobarbital anesthesia.a, Average levels of neural activity in VPM and SI before and after stimulus presentation. Labeling conventions fora are described in Figure 4. b, c, Response magnitude and integrated response to pairs of stimuli at varying interstimulus intervals. Labeling for b andc is described in Figure 5. These data represent single-unit and multiunit data combined. ANOVA results:b, max mag, F = 6.45,p = 0.003; intg, F = 7.12,p = 0.002; c, max mag,F = 4.44, p = 0.014; intg,F = 6.02, p = 0.004. Please see text for p values from post hoc tests (Tukey’s HSD).
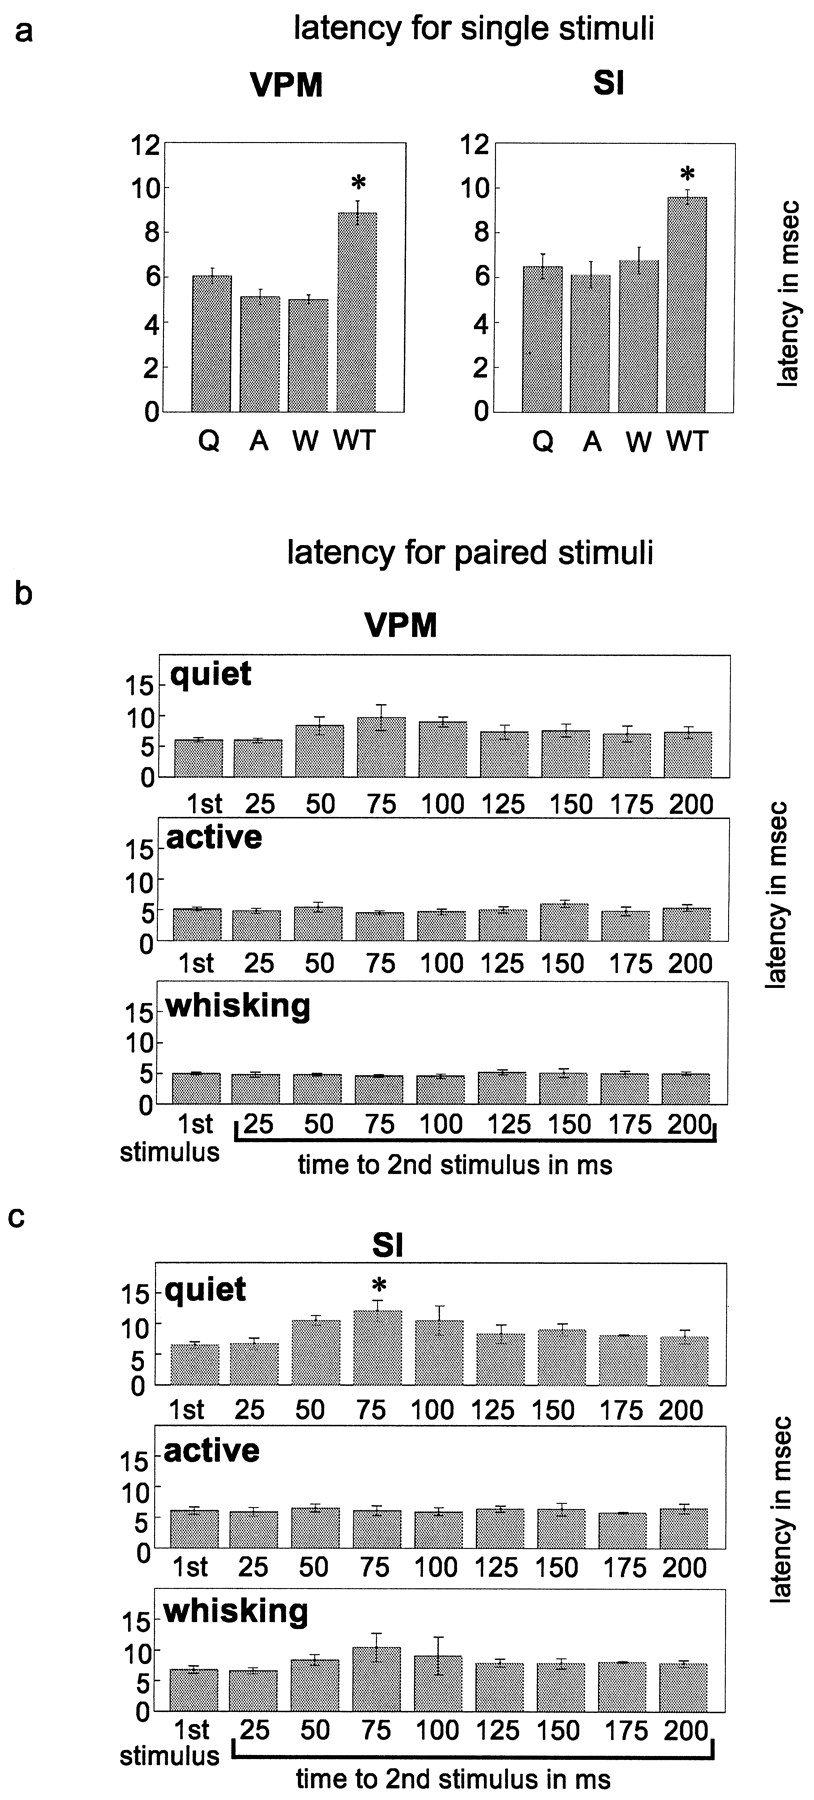
- Fig. 8.
Response latencies in VPM and SI across behavioral states. a, Latencies for single stimuli.b, c, Latencies for pairs of stimuli. Labeling conventions are described in Figure 5. These latency values were obtained from single-unit and multiunit data combined. ANOVA results: a, VPM, F = 35.86,p = 0.0003; SI, F = 18.33,p = 0.002; b, quiet,F = 1.55, p = 0.19; active,F = 0.86, p = 0.57; whisking,F = 5.79, p = 0.011 (no values found significantly different from the first stimulus value);c, quiet, F = 3.62,p = 0.013; active, F = 0.18,p = 0.99; whisking, F = 0.93,p = 0.51. Please see text for pvalues from post hoc tests (Tukey’s HSD).


